QuantSystem MTF Direction Panel

3
QuantSystem Multi Timeframe Panel

QuantSystem Multi Timeframe Panel is a free MetaTrader 5 indicator that displays the current market direction across several important timeframes in a clean chart dashboard.

The indicator was developed to give traders a fast, clear and structured overview of the current multi-timeframe market situation. Instead of opening each timeframe manually and checking several indicators separately, the panel summarizes the most relevant information directly on the chart.

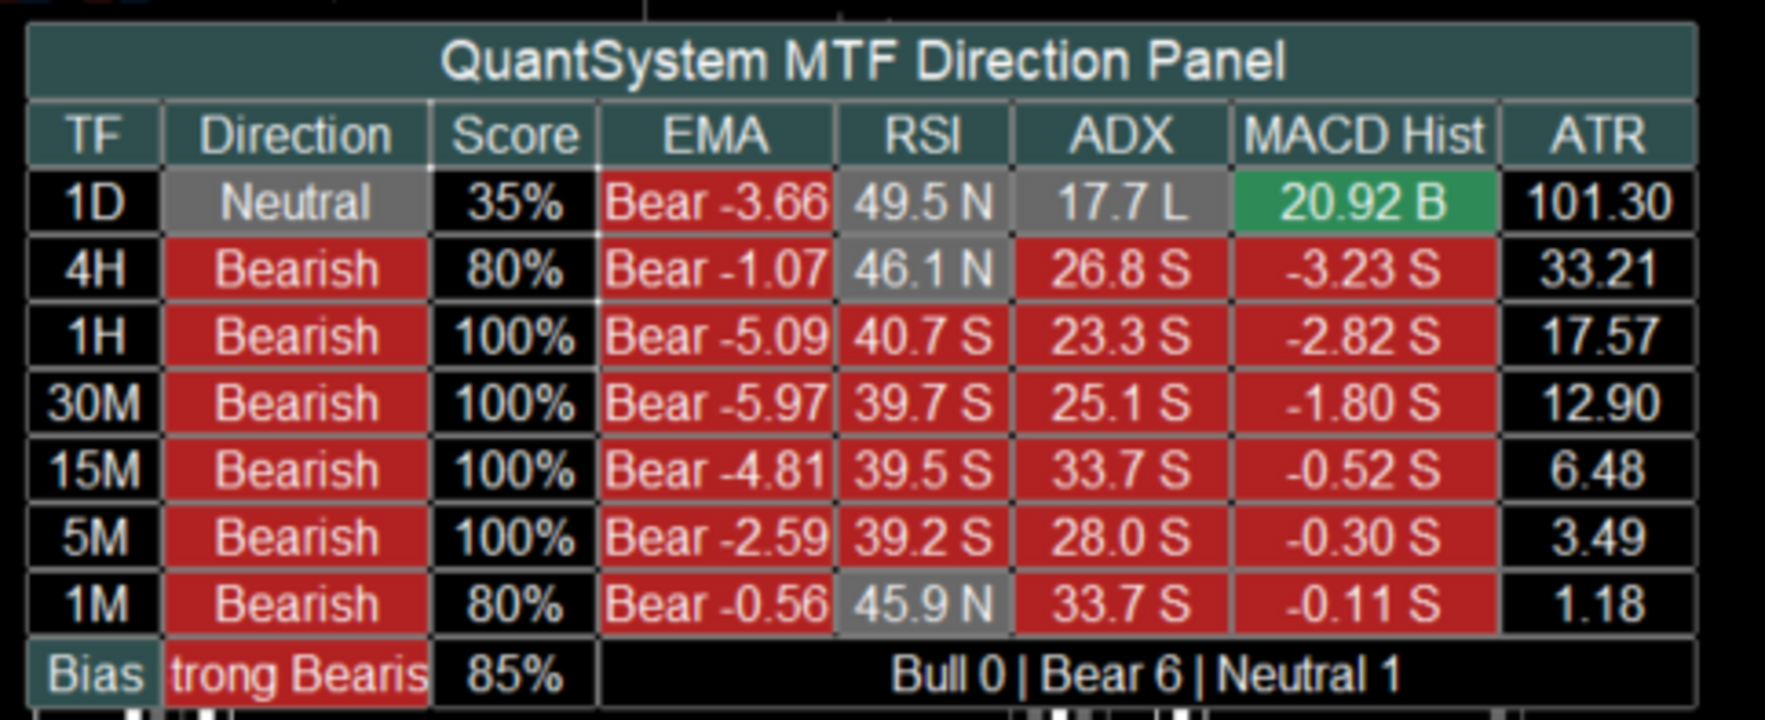
By default, the tool analyzes the following timeframes: 1D, 4H, 1H, 30M, 15M, 5M and 1M. For each timeframe, the panel calculates an individual market direction based on several technical components such as EMA, RSI, ADX, MACD Histogram and ATR.

The user can decide which values should be displayed in the panel and which components should be included in the score calculation. This allows the panel to be used either in a compact format or as a more detailed analysis dashboard.

The indicator is not designed as a standalone trading system. It is built as a professional market context and orientation tool for manual traders, systematic traders and users of automated trading strategies.

Main Idea of the Indicator

Many traders use multi-timeframe analysis to get a better understanding of the current market structure. However, a common mistake is focusing only on the current chart while ignoring the higher timeframes.

For example, an M1 chart may look bullish in the short term, while 1H, 4H and 1D are still clearly bearish. In such situations, a trader may be trading against the larger market structure without immediately noticing it.

This is exactly where QuantSystem Multi Timeframe Panel is designed to help. The panel shows at a glance which timeframes are bullish, which timeframes are bearish, which timeframes are neutral, how strong the current direction is, whether several timeframes are aligned in the same direction and whether the market is clearly directional or mixed.

This gives the user a fast visual overview without overloading the chart with many separate indicators.

What the Panel Displays

The panel consists of several columns. Some columns are always visible, while others can be enabled or disabled in the input settings.

The columns TF, Direction and Score are always visible.

The TF column shows the corresponding timeframe, for example 1D, 4H, 1H, 30M, 15M, 5M and 1M.

The Direction column shows the calculated direction of each timeframe. Possible values are Bullish, Bearish and Neutral. The direction is not based on only one value. Instead, it is calculated from a weighted combination of different technical components. By default, EMA, RSI, ADX and MACD can be included in this evaluation.

The Score column shows the strength of the calculated direction in percent. A high score means that several active analysis components are pointing in the same direction. A score of 100 percent means that all active score components confirm the same direction. A lower score means that the signals are more mixed or that some components are neutral or opposite.

In addition, the following optional columns can be displayed: EMA, RSI, ADX, MACD Hist and ATR. Each of these columns can be enabled or disabled separately through the inputs. This allows the user to customize the panel and keep the chart clean.

EMA Column

The EMA column shows the direction of the moving average structure.

By default, the indicator uses a Fast EMA with a length of 9 and a Slow EMA with a length of 21.

The logic is simple: if the Fast EMA is above the Slow EMA, the EMA component is evaluated as bullish. If the Fast EMA is below the Slow EMA, the EMA component is evaluated as bearish.

In compact mode, the EMA column does not display both full EMA prices. Instead, it shows the direction and the difference between the Fast EMA and the Slow EMA. This keeps the panel much cleaner and easier to read.

Example: Bull 2.35 means that the Fast EMA is above the Slow EMA. Bear -4.18 means that the Fast EMA is below the Slow EMA.

The EMA difference also gives the user an idea of how far both moving averages are apart. This means the panel does not only show direction, but also provides a basic sense of EMA separation.

RSI Column

The RSI column shows the current RSI value of each timeframe.

By default, the indicator uses an RSI period of 14, an RSI midline of 50 and a neutral zone of 5 points.

With the default settings, this means: RSI above 55 is evaluated as bullish, RSI below 45 is evaluated as bearish and RSI between 45 and 55 is evaluated as neutral.

The RSI value is displayed in a compact format, for example 56.8 B, 43.2 S or 49.5 N.

B stands for bullish, S stands for bearish and N stands for neutral.

The neutral zone is important because RSI values around the 50 level often do not provide a clear directional signal. Without a neutral zone, every small movement above or below 50 would immediately be interpreted as bullish or bearish. The neutral zone makes the evaluation smoother and cleaner.

ADX Column

The ADX column shows trend strength and trend direction using ADX, PlusDI and MinusDI.

By default, the indicator uses an ADX period of 14 and a minimum ADX value of 18.

The logic is: if ADX is below the minimum value, the ADX component is evaluated as weak or neutral. If ADX is above the minimum value and PlusDI is greater than MinusDI, the component is evaluated as bullish. If ADX is above the minimum value and MinusDI is greater than PlusDI, the component is evaluated as bearish.

Example displays are 26.8 B, 31.2 S or 14.5 L.

B stands for bullish, S stands for bearish and L stands for low or too weak.

ADX is useful because it does not only evaluate direction, but also checks whether there is enough trend strength. This can help identify weak or unclear market phases.

MACD Histogram Column

The MACD column does not display MACD Main and MACD Signal as two long values. Instead, it shows the difference between both lines.

The calculation is: MACD Histogram = MACD Main minus MACD Signal.

By default, the indicator uses MACD Fast 12, MACD Slow 26 and MACD Signal 9.

The logic is: if the MACD Histogram is greater than 0, the MACD component is evaluated as bullish. If the MACD Histogram is below 0, the MACD component is evaluated as bearish.

Example displays are 1.25 B or -3.42 S.

This format is much clearer than displaying both full MACD values. The user can immediately see whether MACD momentum is bullish or bearish.

ATR Column

The ATR column shows the current average price movement of each timeframe.

By default, the indicator uses an ATR period of 14.

ATR is currently displayed as a volatility value and is not included in the Direction Score calculation by default. This is intentional, because ATR does not provide a direct bullish or bearish direction. ATR mainly shows how much the market is currently moving.

A higher ATR value means higher market volatility. This can be especially useful in markets such as Gold, indices, Forex or cryptocurrencies, where volatility plays an important role.

How the Direction Is Calculated

The direction of each timeframe is calculated through a weighted point system.

By default, EMA, RSI, ADX and MACD can be included in the score.

The default weighting is: EMA Weight 35, RSI Weight 20, ADX Weight 25 and MACD Weight 20.

Together, this equals 100 points.

If all active components are bearish, the timeframe receives a bearish score of 100 percent. If some components are bullish while others are bearish or neutral, the score is calculated accordingly.

Example: EMA bearish gives 35 points to bearish, RSI neutral gives no points, ADX bearish gives 25 points to bearish and MACD bullish gives 20 points to bullish. The indicator then compares bullish and bearish points. The stronger side determines the direction, as long as the minimum score requirement is reached.

Neutral State

The indicator can also display a neutral state.

This is controlled by the settings Allow Neutral State and Min Directional Score.

By default, the minimum score is set to 60.

This means: if the stronger direction is below 60 percent, the timeframe is evaluated as neutral.

This prevents the indicator from showing a clear direction too quickly when the market situation is actually mixed.

Overall Bias

At the bottom of the panel, the indicator displays an overall market bias.

Possible values are Strong Bullish, Mild Bullish, Mixed, Mild Bearish and Strong Bearish.

This overall bias is based on how many of the analyzed timeframes are bullish, bearish or neutral.

By default, the Strong Alignment Count is set to 5. This means that if at least 5 out of 7 timeframes point in the same direction, the panel displays a strong bias.

Example: if 5 timeframes are bearish, the panel displays Strong Bearish. If 5 timeframes are bullish, the panel displays Strong Bullish.

If there is no clear majority, the panel displays a mixed or milder market condition.

Closed Candle Mode

An important setting is Use Closed Candle Mode.

When this option is enabled, the indicator uses only already closed candles for the higher timeframes.

This is important because values on open higher-timeframe candles can still change while the candle is forming.

For example, a 4H candle can look bullish during its formation, but close bearish by the end of the period. With Closed Candle Mode enabled, the panel works more conservatively and more stable because it only uses confirmed candle values.

If the user wants to see the most current live values, this option can be disabled. The panel will then react faster, but values may change more often during the still-open candle.

Compact Display

The Compact Display setting controls how compactly values are shown inside the panel.

When Compact Display is enabled, the panel shows short and clean values.

Examples: EMA Bear -3.20, RSI 43.5 S, ADX 28.4 S, MACD Hist -1.25 S and ATR 4.80.

When Compact Display is disabled, some values can be displayed in a more detailed format.

For most users, compact mode is recommended because it keeps the panel easier to read and uses less chart space.

Displayed Columns

The user can choose which values are displayed in the panel through the input settings.

The relevant settings are Show EMA, Show RSI, Show ADX, Show MACD and Show ATR.

If a column is disabled, it disappears from the panel. The basic columns TF, Direction and Score always remain visible.

This allows each user to decide whether they want a simple overview or a more detailed analysis panel.

A simple setup can display only TF, Direction and Score. A detailed setup can additionally display EMA, RSI, ADX, MACD Hist and ATR.

Score Components

In addition to the visible columns, the user can choose which components are included in the score calculation.

The relevant settings are Use EMA In Score, Use RSI In Score, Use ADX In Score and Use MACD In Score.

This is important because display and calculation are controlled separately.

For example, a user can display RSI in the panel but exclude RSI from the score calculation. Another user can base the score only on EMA and ADX, while MACD and RSI are shown only as additional information.

This makes the indicator flexible and adaptable to different trading styles.

Adjustable Periods and Parameters

The indicator provides several inputs that allow the user to customize the calculation.

In the EMA Settings, the user can adjust Fast MA Length, Slow MA Length, MA Method, Applied Price, Use EMA In Score and EMA Weight.

In the RSI Settings, the user can adjust RSI Period, RSI Midline, RSI Neutral Zone, Use RSI In Score and RSI Weight.

In the ADX Settings, the user can adjust ADX Period, Minimum ADX, Use ADX In Score and ADX Weight.

In the MACD Settings, the user can adjust MACD Fast, MACD Slow, MACD Signal, Use MACD In Score and MACD Weight.

In the ATR Settings, the user can adjust the ATR Period.

In the Bias Settings, the user can adjust Allow Neutral State, Min Directional Score and Strong Alignment Count.

Panel Position and Design

The user can also customize the visual appearance of the panel.

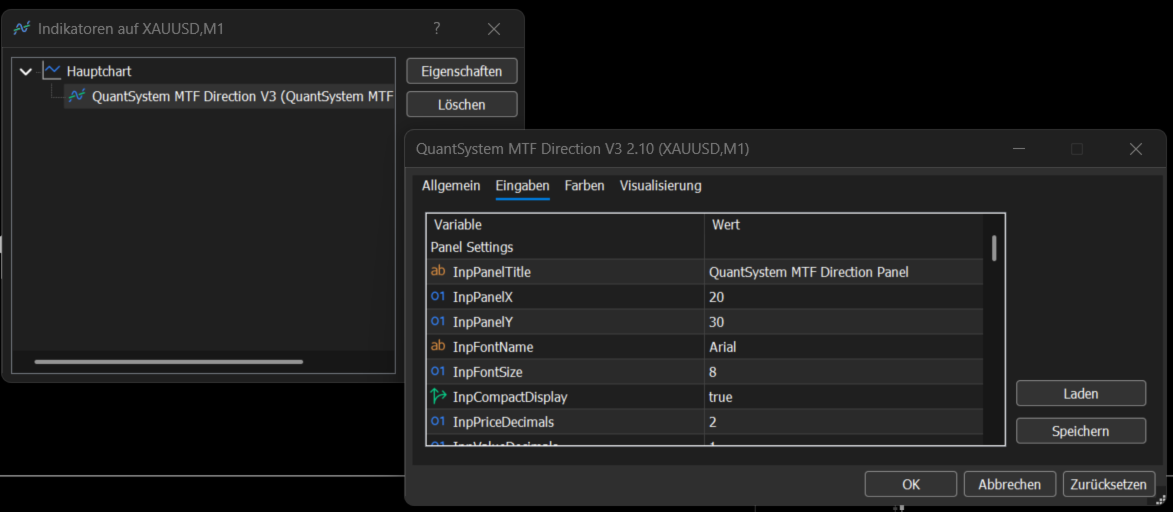
This includes Panel X, Panel Y, Font Name, Font Size, Compact Display, Price Decimals, Value Decimals, MACD Decimals and the colors.

Panel X and Panel Y can be used to move the dashboard on the chart. If the panel should be moved further to the right, Panel X can be increased. If the panel should be moved further down, Panel Y can be increased.

Colors for bullish, bearish, neutral, header, text and borders can also be adjusted.

Alerts

The indicator includes an optional alert function.

If Enable Bias Alerts is activated, an alert can be triggered when the Overall Bias changes.

Examples of possible changes are Strong Bearish to Mixed, Mixed to Strong Bullish or Mild Bullish to Strong Bullish.

This function can be useful if the user wants to be notified when the multi-timeframe structure changes significantly.

Notes About the Screenshots

The screenshots show different display versions of the indicator directly on a MetaTrader 5 chart.

The screenshots show how the panel appears in the main chart window, how multiple timeframes are analyzed at the same time, how Direction and Score are displayed for each timeframe, how optional values such as EMA, RSI, ADX, MACD Histogram and ATR appear in detailed mode and how the Overall Bias is summarized at the bottom of the panel.

The screenshots are visual examples of how the indicator can look in practical chart use. Depending on the symbol, timeframe, broker data, enabled inputs and selected panel position, the display may differ slightly.

Suitable Markets

The indicator can generally be used on all markets available in MetaTrader 5.

Examples include Gold, Forex, indices, cryptocurrencies, commodities and stock CFDs.

The panel can be especially useful in markets where multi-timeframe structure plays an important role, for example XAUUSD, EURUSD, GBPUSD, US100, US500, BTCUSD and ETHUSD.

The indicator is not limited to a specific symbol.

Practical Use

The indicator can be used for different purposes, for example as a fast multi-timeframe market overview, as a trend filter for manual trades, as additional confirmation before an entry, for identifying mixed market phases, for comparing short-term and long-term timeframes and for supporting the analysis of trend strength, momentum and volatility.

One possible use case: if 1D, 4H and 1H are bearish while M1 is temporarily bullish, the user can quickly recognize that the short-term move may only be a correction within a larger bearish structure.

On the other hand, strong alignment across several timeframes can indicate a clearer market phase.

Important Notice

QuantSystem Multi Timeframe Panel is not a standalone trading system and does not provide guaranteed buy or sell signals.

The indicator is designed only for technical market analysis and for better understanding the current multi-timeframe structure.

Trading involves risk. Technical indicators, historical price movement or current market structures do not guarantee future results. Every user should perform their own testing, adjust the settings to their own trading style and use appropriate risk management.
Produits recommandés
Multi Timeframe Volatility Dashboard Free indicator for multi-timeframe volatility analysis Description Multi Timeframe Volatility Dashboard is a powerful and convenient tool for traders that allows instant assessment of current market volatility across 7 timeframes simultaneously. The indicator displays ATR (Average True Range) values and classifies volatility as **LOW, MEDIUM, or HIGH** relative to the average value over a specified lookback period. Key Features - Multi-timeframe analy
FREE
Nous vous présentons l' Oscillateur Heikin Ashi RSI ! Cet indicateur combine les concepts des bougies Heikin Ashi avec l'indicateur RSI (Relative Strength Index) pour produire un format de type oscillateur qui peut être utilisé pour filtrer une partie du bruit associé aux lectures standards du RSI. Cela offre aux traders une représentation plus fluide des conditions du marché. Voici quelques articles pour en savoir plus sur le RSI et les bougies Heikin Ashi : https://www.investopedia.com/terms/r
SafePair Manual Trader Pro MultiPairs SafePair Manual Trader Pro MultiPairs est un Expert Advisor avancé pour MetaTrader 5, conçu pour accompagner le trading manuel professionnel, la gestion semi-automatique des opérations, la surveillance multi-symboles, la planification du risque et l’analyse intelligente du marché à partir d’un seul panneau de contrôle puissant. Cet EA est conçu pour les traders qui recherchent une exécution manuelle rapide, un contrôle structuré du risque, une assistance int
Divergent Stochastic Filter II Catch Reversals Early, Filter Noise, Trade with Confidence The Edge: Why This Stochastic is Different  Every trader knows the Stochastic oscillator. But knowing when to trust its signals, that's the real challenge. The Divergent Stochastic Filter II transforms this classic indicator into a precision reversal detection system by adding critical elements: divergence intelligence, signal filtering and exhaustion detection.  While standard Stochastic oscillators fire s
BlueBoat – Prime Cycle is a technical indicator for MetaTrader 5 that visualizes market cycles based on the Fimathe cycle model (Marcelo Ferreira) . It identifies and displays historic and live cycle structures such as CA, C1, C2, C3, etc., helping traders understand the rhythm and timing of price movement across multiple sessions. This tool is ideal for manual analysis or as a supporting signal in discretionary strategies. Key Features Historical Cycle Analysis – Backtest and visualize as many
Axiom Point
Tatiana Savkevych
Axiom Point — Precision Structural Breakout Indicator Axiom Point is a high-performance analytical indicator designed to identify high-probability reversal zones using price-action behaviour and adaptive balance filtering. The indicator applies a multi-layer analytical model to detect moments when price transitions beyond its normal equilibrium area, indicating a potential shift in market momentum. Unlike conventional trend-following tools, Axiom Point focuses on so-called points of no return —
Scanner multimarchés et multi-unités de temps qui évalue la tendance, la position et la dynamique en un score de trading unique de 0 à 100, avec détection adaptative des régimes et filtres anti-bruit intégrés. Analyse simultanément 10 symboles sur le Forex, les cryptomonnaies, les indices, les métaux et le pétrole. Description complète APEX Scanner multimarchés : Visualisez l’ensemble du marché en un coup d’œil. APEX est un tableau de bord professionnel qui analyse jusqu’à 10 symboles simult
"Adjustable Fractals" - est une version avancée de l'indicateur fractal, un outil de trading très utile ! - Comme nous le savons, l'indicateur fractal standard MT5  n'a aucun paramètre - c'est très gênant pour les traders. - Les fractales ajustables ont résolu ce problème - il dispose de tous les paramètres nécessaires : - Période réglable de l'indicateur (valeurs recommandées - supérieures à 7). - Distance réglable par rapport aux hauts/bas du prix. - Conception réglable des flèches fractales.
Prime Vortex Pro (MT5) — Multi-Layer Confluence Trend & Reversal Signal Indicator Built natively for MetaTrader 5. Fewer signals. Stronger confluence. Why Prime Vortex Pro Exists Most signal indicators fire on nearly every candle — dozens of arrows a day, most of them noise that pulls traders into weak, low-probability setups. Prime Vortex Pro flips that approach: silence is the default. A signal only appears when multiple, independent layers of market evidence — trend, trend strength, market st
SuperTrend Indicator for MT5
Vijaykumar Jayantilal Panchal
Le Supertrend est un indicateur technique relativement impopulaire qui a été développé - comme indiqué ci-dessus - par Olivier Sebam pour aider les traders à identifier les tendances et savoir quand acheter ou vendre un actif financier. L'indicateur n'est pas trouvé par défaut dans TradingView et MetaTrader. Pourtant, vous pouvez trouver des indicateurs Supertrend personnalisés sur le marché. Lorsqu'il est appliqué sur un graphique, l'indicateur supertrend est visible avec ses deux couleurs. B
Indicateur Crypto_Forex « WPR avec 2 Moyennes Mobiles » pour MT5, sans repeint. - Le WPR est l'un des meilleurs oscillateurs pour le scalping. - L'indicateur « WPR et 2 Moyennes Mobiles » permet de visualiser les moyennes mobiles rapide et lente de l'oscillateur WPR. - Cet indicateur permet d'anticiper les corrections de prix. - Très facile à configurer via ses paramètres, il est utilisable sur toutes les unités de temps. - Les conditions d'entrée à l'achat et à la vente sont illustrées. - Ave
Restez en avance sur l’élan du marché avec le Pip Movement Alert MT5, un indicateur polyvalent multi-devises conçu pour suivre et alerter les traders sur des mouvements précis en pips à travers plusieurs symboles, idéal pour le trading de forex, actions, cryptomonnaies et matières premières. Loué dans les communautés de trading telles que Forex Factory et Reddit’s r/Forex, et mis en avant dans les discussions sur Investopedia et TradingView pour sa capacité à détecter les changements soudains du
FREE
Divergence Hunter
Rizwan Akram
5 (3)
Divergence Hunter - Professional Multi-Oscillator Divergence Detection System Overview Divergence Hunter is a professional-grade technical indicator designed to automatically detect and visualize price-oscillator divergences across multiple timeframes. Built for serious traders who understand the power of divergence trading, this indicator combines precision detection algorithms with an intuitive visual interface. Key Features Multiple Oscillator Support: RSI (Relative Strength Index) MACD (Mo
FREE
Trade history
Andriy Konovalov
5 (2)
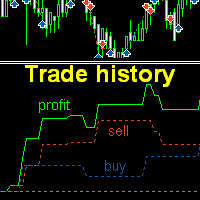
The indicator plots charts of profit taken at the Close of candles for closed (or partially closed) long and short positions individually. The indicator allows to filter deals by the current symbol, specified expert ID (magic number) and the presence (absence) of a substring in a deal comment, to set the start time and the periodicity of profit reset (daily, weekly or monthly) to calculate the profit chart. The indicator also displays the floating (not fixed) profit of the opened positions at th
Short Description Swing Timing Breakout EA is a smart Expert Advisor for MetaTrader 5 that combines trend filtering, momentum timing, and dynamic risk management to capture high-probability swing and breakout opportunities. Full Description Swing Timing Breakout EA is a professional trading robot designed for MetaTrader 5, suitable for traders who want a balance between automation, control, and disciplined risk management. This EA uses a trend-following and momentum confirmation approach ,
Show Pips for MT5
Roman Podpora
4.48 (31)
Cet indicateur d'information sera utile pour ceux qui veulent toujours être au courant de la situation actuelle du compte. VERSION MT 4 -   More useful indicators L'indicateur affiche des données telles que le profit en points, en pourcentage et en devise, ainsi que le spread pour la paire actuelle et le temps jusqu'à la fermeture de la barre sur la période actuelle. Il existe plusieurs options pour placer la ligne d'information sur le graphique : À droite du prix (passe derrière le prix) ; En c
FREE
EUR 8 of 8
Tomas Michalek
Plug & Play portfolio - series of high-quality EURUSD H1 strategies for maximized success. The eighth strategy, the last one from the EUR-8 portfolio , uses BollingerBands mean reversal method for setting up the pending order. To have a whole portfolio of strategies, which trades for you is incredibly efficient, don't miss that opportunity. Check my other strategies today! and assemble your portfolio. Benefits for you Plug & Play system , designed to have   simple initial setup . That's saved
Knowledge of the strength and weakness of each currency is vital for every forex trader. Our   Currency Strength Meter indicator   measures the strength of eight major currencies (USD, EUR, GBP, CHF, JPY, CAD, AUD, NZD) by using the Relative Strength Index indicator, also known as RSI. The Currency Strength Meter indicator shows you, simply and quickly, when a currency is oversold, overbought, or in "normal area". This way, you can identify which currency is the strongest and the weakest. Our
Quant Lattice
Dilwyn Tng
5 (1)
1 Prix pour 3 Stratégies Signal en direct :   QL Drive   |   QL Steady          Fichiers set Qu'est-ce que Quant Lattice (Treillis Quantique) Quant Lattice (Treillis Quantique) est un Expert Advisor entièrement automatisé qui trade une seule paire de devises : AUDCAD. Il est livré avec 2 stratégies différentes, Steady (Régulier) et Drive (Impulsion).  Vous l'installez une fois, choisissez une stratégie, définissez la gestion du capital, et il trade sans que vous ayez à y toucher. Pourquoi AUD
Smart Fair Value Gap Pro
Joao Luiz Savioli Filho
Unlock the power of Smart Money Concepts (SMC) with the cleanest FVG indicator on the market. Smart FVG Pro is not just another gap detector. It is designed for professional traders who need to filter out noise and focus on high-probability reversal zones. Unlike standard indicators that clutter your chart with every minor gap, Smart FVG Pro uses advanced filtering logic (Trend + Volatility) and a unique "Smart Mitigation" system to automatically remove invalidated zones, keeping your chart clea
Order Blocks Scan MT5
Reza Aghajanpour
5 (1)
**   All Symbols   x   All Time frames   scan just by pressing scanner button ** Discount : Only 4   of 5 copy  is 35$. ***   Contact me  to send you instruction   and add you in "Order Block group" for sharing or seeing experiences with other users. Introduction: The central banks and financial institutions mainly drive the market,   Order block is considered a market behavior that indicates accumulation of orders from banks and institutions, then   the market tends to make a sharp move(Imbala
Présentation Candle Timer Countdown Pro affiche un compte à rebours fluide et précis jusqu’à la clôture de la bougie en cours, avec un arc circulaire de progression en temps réel. Fonctionnalités Compte à rebours précis Arc circulaire (anneau ou secteur rempli) 6 positions d’affichage 3 modes de couleur Mise en évidence finale Détection de connexion Alertes nouvelle bougie Faible utilisation CPU Installation Télécharger depuis MQL5 Market Ajouter au graphique Configurer les paramètres Compatibil
Magic KAMA System is a trading system based on Kaufman's Adaptive Moving Average (KAMA), with several other indicators as filters. This algorithm provides highly reliable entry points, and its simple settings allow it to be used for any symbol and trading style. Settings for notification alerts and SL/TP multiples of the ATR are included, making it flexible enough to handle market fluctuations. Similarly, settings for all indicators used are customizable. Signals are generated at the closing of
Momentum Candle MT5 - Professional Trading Indicator Overview Momentum Candle Detector V4 is a powerful and intelligent indicator designed to identify high-probability momentum candles across all timeframes and instruments. Built with advanced filtering technology, this indicator helps traders spot explosive price movements before they happen. Key Features Core Detection System Universal Compatibility: Works on all pairs - Forex (EURUSD, GBPUSD, USDJPY, etc.), Gold (XAUUSD), Bitcoin (BTCUSD), a
FREE
LT Rainbow Trend
Thiago Duarte
5 (1)
== LT RAINBOW TREND - L'INDICATEUR DE TENDANCE AUX 36 MOYENNES MOBILES == APERÇU Le LT Rainbow Trend est un indicateur technique avancé d'analyse de tendance qui utilise 36 Moyennes Mobiles simultanées dotées d'un système de couleurs intelligent (Rainbow). Développé pour les traders souhaitant opérer dans le sens de la tendance principale avec une clarté visuelle maximale, cet indicateur transforme la complexité de l'analyse multi-timeframe en une visualisation simple, colorée et hautement int
FuturePath Forecast – Predict Your Next Move! See potential price movements instantly with AI_Path! Combines trend slope and smooth cycles to create a clear forecast path on your chart. Perfect for traders who want an edge and smarter decisions in real time. Visual Forecasting: Instantly see where the market could go next. Trend + Cycle Analysis: Combines linear trend slope with smooth sinusoidal patterns for realistic projections. Customizable Horizon: Adjust the number of bars to forecast acc
Introducing the   Range Predictor : Your Ultimate Guide to Future Trading Ranges!   Imagine having the power to see into the future of market moves— Range Predictor   brings this dream to life. Designed to deliver real-time,   predictive support and resistance levels , this tool goes beyond standard indicators, offering trend direction insights and precise range   forecasts . Whether you're a day trader or a swing trader, the   Range Predictor   is your all-in-one toolkit for mastering the ma
Welcome to ENTRY IN THE ZONE AND SMC MULTI TIMEFRAME Entry In The Zone and SMC Multi Timeframe is a real-time market analysis tool based on Smart Money Concepts (SMC), designed to analyze market structure, price direction, and key trading zones. It supports both Single-Timeframe Analysis and Multi-Timeframe Analysis, providing a clearer view of the overall market structure across multiple timeframes, with real-time BUY / SELL signals that do not repaint. It is designed to help filter trading opp
IX Power MT5
Daniel Stein
4.92 (13)
IX Power : Découvrez des insights de marché pour les indices, matières premières, cryptomonnaies et forex Vue d’ensemble IX Power est un outil polyvalent conçu pour analyser la force des indices, matières premières, cryptomonnaies et symboles forex. Tandis que FX Power offre une précision maximale pour les paires de devises en utilisant toutes les données disponibles, IX Power se concentre exclusivement sur les données du symbole sous-jacent. Cela fait de IX Power un excellent choix pour les m
KMB Smart Pattern Analyzer PRO
Karwan Msto Mohammed Mohammed
Présentation du produit KMB Smart Pattern Analyzer PRO est un indicateur avancé d'analyse technique conçu pour détecter et classer les configurations de marché présentant un fort niveau de correspondance dans une zone du graphique définie par l'utilisateur. L'indicateur combine plusieurs moteurs d'analyse dans un seul outil professionnel : Analyse des configurations de chandeliers Reconnaissance des figures chartistes classiques Détection des structures harmoniques Analyse de structure de marché
Les acheteurs de ce produit ont également acheté
Ce produit a été mis à jour pour le marché 2026 et optimisé pour les dernières versions de MT5. AVIS DE MISE À JOUR DU PRIX : Smart Trend Trading System est actuellement disponible à $99 . Le prix passera à $199 après les 30 prochains achats . OFFRE SPÉCIALE : Après avoir acheté Smart Trend Trading System, envoyez-moi un message privé pour recevoir Smart Universal EA GRATUITEMENT et transformer vos signaux Smart Trend en trades automatisés. Smart Trend Trading System est un système de trading c
Trend Sniper X
Sarvarbek Abduvoxobov
5 (11)
Trend Sniper X est un indicateur de suivi de tendance multi-période pour MetaTrader 5 qui aide les traders à identifier la direction de la tendance et les points de retournement potentiels avec clarté et précision. Informations sur le prix : Le prix actuel est un prix promotionnel et est sujet à changement à mesure que les futures mises à jour et nouvelles fonctionnalités seront publiées. Chaîne Code2Profit Maîtrisez le marché grâce à l'analyse multi-unités de temps ! Comment maximiser votre tau
SuperScalp Pro
Van Minh Nguyen
4.61 (31)
SuperScalp Pro –  Système Professionnel de Scalping à Confluence Multicouche SuperScalp Pro est un système professionnel de scalping à confluence multicouche, conçu pour aider les traders à identifier des opportunités à plus forte probabilité grâce à des confirmations d'entrée plus claires, des niveaux de Stop Loss et de Take Profit basés sur l'ATR, ainsi qu'un filtrage flexible des signaux sur le XAUUSD, le BTCUSD et les principales paires de devises du Forex. La documentation complète est disp
Divergence Bomber
Ihor Otkydach
4.89 (94)
De temps en temps, je trade moi-même selon ce système. Découvrez mon trading manuel « BOMBER » sur un compte réel : LIVE SIGNAL Chaque acheteur de cet indicateur reçoit également gratuitement : L’outil exclusif « Bomber Utility », qui accompagne automatiquement chaque opération de trading, fixe les niveaux de Stop Loss et de Take Profit, et clôture les positions selon les règles de la stratégie Des fichiers de configuration (set files) pour adapter l’indicateur à différents actifs Des set files
Neuro Poseidon MT5
Daria Rezueva
4.85 (54)
Neuro Poseidon is a new indicator by Daria Rezueva. It combines precise trading signals with adaptive TP/SL levels - creating best possible trades as a result! Message me and get  Neuro Poseidon Assistant  as a gift to automize your trading process! What makes it stand out? 1. Proven profitability on all assets and timeframes 2. Only confirmed BUY and SELL signals present on the chart 3. Adaptive TP & SL levels generated by the software for each trade 4. Easy to understand - suitable for al
La légende est de retour : Entry Points Pro 10. La relance de l'indicateur légendaire qui s'est maintenu 3 ans dans le Top-3 du MQL5 Market. Des centaines d'avis enthousiastes (589 sur les deux versions), des milliers de traders l'utilisent chaque jour, 31 000+ téléchargements de la démo   MT4+MT5 . J'ai lu chacun de vos avis publiés en cinq ans — et au lieu de promettre, j'ai intégré les réponses directement dans la version 10. Par un auteur présent sur les marchés depuis 1999, qui tient à l'ho
Commençons par être honnêtes. Aucun indicateur ne vous rendra rentable à lui seul. Si quelqu’un vous dit le contraire, il vous vend un rêve. Tout indicateur qui affiche des flèches parfaites d’achat/vente peut être rendu impeccable — il suffit de zoomer sur la bonne partie de l’historique et de capturer uniquement les trades gagnants. Nous ne faisons pas cela.  SMC Intraday Formula est un outil. Il lit la structure du marché pour vous, identifie les zones de prix à la probabilité la plus élevée
Superhero
Ihor Otkydach
5 (2)
L'indicateur SUPERHERO est un système de trading multidevises conçu selon un principe « tout compris ». Cet indicateur analyse le marché de manière autonome et fournit des signaux indiquant quand ouvrir et clôturer des positions. Il utilise des ordres Stop Loss et Take Profit. Le rapport R:R est de 1:1. De temps en temps, je passe moi-même des ordres en me basant sur les signaux de ce système, et voici les résultats que j'obtiens — SIGNAL EN DIRECT Ce système peut envoyer des notifications push
M1 Sniper MT5
Oleg Rodin
5 (6)
M1 SNIPER   est un système d'indicateurs de trading facile à utiliser. Il s'agit d'un indicateur à flèche conçu pour l'unité de temps M1. Cet indicateur peut être utilisé seul pour le scalping sur l'unité de temps M1 ou intégré à votre système de trading existant. Bien que conçu spécifiquement pour le trading sur l'unité de temps M1, ce système peut également être utilisé avec d'autres unités de temps. Initialement, j'avais conçu cette méthode pour le trading du XAUUSD et du BTCUSD. Cependant, j
GoldenX Entry MT5
Kareem Abbas
5 (15)
GoldenX Entry est un indicateur MT5 doté d’un algorithme adaptatif Smart Entry Trend, d’un système de scoring des signaux, d’un détecteur de régime de marché et d’un filtre de volatilité. Chaque signal inclut un niveau d’entrée calculé, trois niveaux de Take-Profit (TP1, TP2, TP3) ainsi qu’un niveau de Stop-Loss. Il est construit sur plusieurs couches analytiques conçues pour s’adapter à différentes conditions de marché, combinant un système analytique multicouche avec un optimiseur intégré et u
Zoryk Gold
Reda El Koutbane
5 (6)
ZORYK — Système avancé de signaux XAUUSD pour MetaTrader 5 Vous connaissez certainement cette sensation. Vous passez du temps à analyser l’or. Vous attendez le bon point d’entrée. Vous ouvrez enfin la position, puis le prix commence immédiatement à évoluer contre vous. Vous fermez trop tôt, déplacez le Stop Loss ou hésitez pendant quelques secondes. Ensuite, le marché atteint exactement l’objectif que vous aviez initialement prévu, mais sans vous dans la position. Le problème n’était pas toujour
Session High Low Lines Indicator that plots key intraday reference levels directly on the chart: the previous day's high/low and the current day's high/low, updated automatically as the new day forms. An optional previous week high/low can also be displayed. These levels are widely used as reference points for potential support and resistance zones, breakout confirmation, and range context during a trading session. Features Previous day High/Low lines Current day High/Low lines (updates in real
Atomic Analyst MT5
Issam Kassas
4.43 (53)
Ce produit a été mis à jour pour le marché 2026 et optimisé pour les dernières versions de MT5. AVIS DE MISE À JOUR DU PRIX : Atomic Analyst est actuellement disponible à $99 . Le prix passera à $199 après les 30 prochains achats . OFFRE SPÉCIALE : Après avoir acheté Atomic Analyst, envoyez-moi un message privé pour recevoir Smart Universal EA GRATUITEMENT et transformer vos signaux Atomic Analyst en trades automatisés. Atomic Analyst est un indicateur de trading Price Action sans repaint, san
Gold Entry Sniper
Tahir Mehmood
5 (19)
Gold Entry Sniper – Tableau de Bord ATR Multi-Unités de Temps pour Scalping et Swing Trading sur l'Or Gold Entry Sniper est un indicateur avancé pour MetaTrader 5 qui fournit des signaux d'achat/vente précis sur XAUUSD et autres actifs, basé sur la logique de Trailing Stop ATR et l' analyse multi-unités de temps . Caractéristiques et Avantages Clés Analyse Multi-Unités de Temps – Affiche les tendances en M1, M5, M15 sur un seul tableau. Trailing Stop Basé sur l'ATR – Ajuste automatiquement selon
L'indicateur UZFX {SSS} Scalping Smart Signals v4.0 MT5 est un indicateur de trading haute performance sans « repaint », conçu pour les scalpers, les day traders et les swing traders qui recherchent des signaux précis et en temps réel sur des marchés très volatils. Développé par (UZFX-LABS), cet indicateur combine l'analyse de l'action des prix, la confirmation de tendance et un filtrage intelligent pour générer des signaux d'achat et de vente à forte probabilité, des signaux d'alerte et des opp
Gann Made Easy   est un système de trading Forex professionnel et facile à utiliser qui est basé sur les meilleurs principes de trading en utilisant la théorie de mr. WD Gann. L'indicateur fournit des signaux d'ACHAT et de VENTE précis, y compris les niveaux Stop Loss et Take Profit. Vous pouvez échanger même en déplacement en utilisant les notifications PUSH. VEUILLEZ ME CONTACTER APRÈS L'ACHAT POUR RECEVOIR GRATUITEMENT DES INSTRUCTIONS DE TRADING ET D'EXCELLENTS INDICATEURS SUPPLÉMENTAIRES! V
Trend Catcher ind mt5
Ramil Minniakhmetov
5 (18)
INDICATEUR DE DÉTECTEUR DE TENDANCE L'indicateur de détecteur de tendance analyse les mouvements de prix du marché grâce à une combinaison d'indicateurs d'analyse de tendance adaptatifs, propriétaires et personnalisés. Il identifie la véritable direction du marché en filtrant les fluctuations à court terme et en se concentrant sur la force de la dynamique sous-jacente, l'expansion de la volatilité et la structure des prix. Il utilise également une combinaison d'indicateurs personnalisés de lis
SkyHammer Signal Pro Indicateur professionnel de signaux de tendance sans repaint, avec niveaux Entry, SL et TP verrouillés SkyHammer Signal Pro est un indicateur de tendance et de momentum structuré, conçu pour les traders qui recherchent des signaux clairs, fixes et vérifiables. Il fonctionne le mieux sur les timeframes courts, comme M1 et M5 . L’indicateur ne cherche pas à prédire les sommets ou les creux du marché. Il attend plutôt une structure de marché confirmée, une direction de tendance
Crystal Heikin Ashi Signals
Muhammad Jawad Shabir
5 (3)
Crystal Heikin Ashi Signals - Professional Trend & Signal Detection Indicator Advanced Heikin Ashi Visualization with Intelligent Signal System for Manual & Automated Trading Final Price: $149 ---------> Price goes up $10 after every 10 sales . Limited slots available — act fast . Overview Crystal Heikin Ashi Signals is a professional-grade MetaTrader 5 indicator that combines pure Heikin Ashi candle visualization with an advanced momentum-shift detection system. Designed for both manual traders
SR Liquidity   est un indicateur de trading conçu pour révéler les zones cachées où se concentre la liquidité du marché et où le prix réagit avec le plus d'intensité. Ces zones de liquidité spécifiques agissent comme de puissants niveaux de support et de résistance, vous offrant une cartographie claire des points où le marché est le plus susceptible de se retourner. Plutôt que de tracer des lignes de support et de résistance classiques, l'indicateur SR Liquidity analyse le comportement réel des
Power Candles MT5
Daniel Stein
5 (9)
Power Candles V3 - Indicateur de force à optimisation automatique Power Candles V3 transforme la force des devises et des instruments en un plan de trading exploitable sur chaque graphique auquel il est associé. Au lieu de se contenter de colorer les bougies, il effectue une optimisation automatique en temps réel en arrière-plan et vous fournit les meilleurs niveaux de Stop Loss, Take Profit et seuils de signal pour le symbole que vous avez sous les yeux. Un simple clic suffit pour l'adopter en
Azimuth Pro
Ottaviano De Cicco
5 (7)
Azimuth Pro V2: Synthetic Fractal Structure and Confirmed Entries for MT5 Overview Azimuth Pro is a multi-level swing structure indicator by Merkava Labs . Four nested swing layers, swing-anchored VWAP, ABC pattern detection, three-timeframe structural filtering, and closed-bar confirmed entries — one chart, one workflow from micro-swings to macro-cycles. This is not a blind signal product. It is a structure-first workflow for traders who care about location, context, and timing. ️ Summer Sale
The Oracle Pro
Ottaviano De Cicco
5 (1)
The Oracle Pro: Synthetic Multi-Timeframe Bias Engine for MT5 ️ Summer Launch Offer — Get The Oracle Pro for USD 199 (early buyers). Price rises with traction; final price USD 399. The Oracle Pro is a premium multi-timeframe bias engine for MetaTrader 5, built for demanding and professional traders. It answers one question with discipline: what is the directional bias on each timeframe right now, how strong is it, and how much do the timeframes agree? Everything is computed on closed bars only
Ce produit a été mis à jour pour le marché 2026 et optimisé pour les dernières versions de MT5. AVIS DE MISE À JOUR DU PRIX : Smart Price Action Concepts est actuellement disponible à $200 . Le prix passera à $299 après les 30 prochains achats . OFFRE SPÉCIALE : Après l’achat, envoyez-moi un message privé pour recevoir un bonus gratuit + un cadeau . Tout d’abord, il est important de souligner que cet outil de trading est un indicateur sans repaint, sans redrawing et sans retard, ce qui le rend
Market Structure Order Block Dashboard MT5 est un indicateur MT5 conçu pour les traders qui veulent lire la structure de marché et les principales zones de réaction du prix directement sur le graphique. Il combine BOS, ChoCH, Order Blocks, Fair Value Gaps (FVG), Liquidité, Kill Zones, Volume Profile, et un dashboard compact pour une analyse rapide. Cet indicateur s'adresse aux traders qui utilisent la structure de marché, les concepts ICT et Smart Money comme cadre de décision. Il peut aider à r
Axiom Matrix
Issam Kassas
5 (5)
AXIOM MATRIX MT5 PRIX DE LANCEMENT : $99 Axiom Matrix est disponible au prix de lancement de $99. Le prix passera à $199 après les 30 premiers achats. Après votre achat, envoyez-moi un message direct pour recevoir les instructions et réclamer votre bonus cadeau exclusif. Axiom Matrix est un scanner de marché professionnel multi-symboles et multi-timeframes, ainsi qu’un tableau de bord de décision pour MetaTrader 5. Il scanne votre Market Watch, analyse plusieurs timeframes, lit plusieurs moteurs
M1 Quantum MT5
Hamed Dehgani
4.27 (11)
Signaux de Trading en Direct avec M1 Quantum : Signal   (L’opération est exécutée automatiquement par le Quantum Trade Assistant , inclus gratuitement avec ce produit.) Dernières nouvelles : La version 1.64 a été publiée. Toutes les transactions disposent désormais d’un Stop Loss placé derrière les zones de support/résistance correspondantes. La fonction Smart Close a également été améliorée afin d’augmenter les performances de l’EA dans cette version. Depuis le 9 août, le signal en direct fonc
Crystal Quantum Pro
Muhammad Jawad Shabir
5 (2)
CRYSTAL QUANTUM PRO Institutional Signal & Trade Intelligence for MetaTrader 5 Final Price: 199 USD ----> Price goes up 10 USD after every 10 sales. Limited launch slots available, act fast. Most indicators give you an arrow and leave you alone. A naked arrow is a gamble. Winning consistently requires CONFLUENCE , a clear STOP and TARGET , and honest PROOF that the system works. Crystal Quantum Pro delivers all three in one clean, no-repaint package. Crystal Quantum Pro is a complete decision sy
Reversion King Indicator
Eugen-alexandru Zibileanu
5 (6)
Un nouveau Roi en ville - Indicateur + Gestion des ordres (TP1 + TP2 + TP3) + Envoi optionnel de signaux Telegram INCLUS (GRATUIT) (SYSTÈME COMPLET DE TRADING et DE SIGNAUX) Notre meilleur EA pour l’Or : Gold Slayer Cet indicateur inclut une stratégie avancée, un système de trading avec gestion des ordres personnalisable ainsi qu’un système de retour à la moyenne combinant des extensions d’enveloppes, soutenu par plusieurs filtres intelligents de confirmation comme le RSI afin de détecter des en
Smc Pro ToolKit
Talal N Z Aljarusha
5 (9)
SMC PRO TOOLKIT — SMART MONEY ANALYSIS & STRUCTURED TRADE PLANNING SMC Pro ToolKit is a professional Smart Money Concepts analysis workspace for MetaTrader 5. It combines market structure, multi-timeframe analysis, institutional price zones, setup evaluation, confirmation tools, volume context, alerts, and risk planning inside one organized chart environment. One workspace. Multiple layers of confirmation. One structured trading plan. OPEN COMPLETE USER GUIDE MULTI-CONDITION SETUP ENGINE At

Plus de l'auteur
ATR Long TP Box
Elias Balian Zimmermann
ATR Long Box Anchor MT5 ATR Long Box Anchor MT5 is a visual risk-reward indicator for MetaTrader 5, specifically designed for planning long setups. The indicator creates an ATR-based long box directly on the chart, including entry, stop-loss zone, take-profit zone, and optional risk-reward information. The indicator works with a freely movable anchor point. This anchor defines the desired entry price and the candle whose ATR value is used for the calculation. This allows a long setup to be plann
FREE
QuantSystem Short TP Box
Elias Balian Zimmermann
ATR Short Box Anchor MT5 ATR Short Box Anchor MT5 is a visual risk-reward indicator for MetaTrader 5, specifically designed for planning short setups. The indicator creates an ATR-based short box directly on the chart, including entry, stop-loss zone, take-profit zone, and optional risk-reward information. The indicator works with a freely movable anchor point. This anchor defines the desired entry price and the candle whose ATR value is used for the calculation. This allows a short setup to be
FREE
Filtrer:
ZZZ8989jonow
49
ZZZ8989jonow 2026.05.21 12:15 
 

QuantSystem has a good spread of MTF price strength measures to determine an overall bias for market direction. However, for me it was way too heavy on available resources (cpu /data). This was particularly noticeable during US market opening, when price data updating was much slower than usual, while trying to process and feed all the hungry parameters in the indicator. As soon as I disabled it, my price data once again returned to it's usual high speed updating, with negligible lag. As a free indicator it is quite substantial and has many positive attributes, but definitely needs to lighten up a bit (if possible) to be user friendly to me. Also, has extensive information in Overview, but have not had any communication with owner.

Elias Balian Zimmermann
539
Réponse du développeur Elias Balian Zimmermann 2026.05.22 12:13
Thank you very much for your detailed and honest feedback. You are absolutely right that the indicator is currently quite feature-rich, especially when several timeframes and multiple components such as EMA, RSI, ADX, MACD and ATR are processed at the same time. During high-volume market sessions this can increase the calculation load, depending on the symbol, broker data feed and chart setup. I really appreciate this feedback, because performance and practical usability are very important to me. I am already working on a lighter and more optimized version with improved update handling, optional calculation modes and a more resource-friendly refresh logic. The goal is to keep the detailed multi-timeframe overview, while reducing CPU and data load as much as possible. Thank you again for testing the indicator and for pointing this out in such a constructive way. Feedback like this helps me improve the tool for real trading conditions.
You are also welcome to contact me privately.
Répondre à l'avis