QuantSystem MTF Direction Panel

3
QuantSystem Multi Timeframe Panel

QuantSystem Multi Timeframe Panel is a free MetaTrader 5 indicator that displays the current market direction across several important timeframes in a clean chart dashboard.

The indicator was developed to give traders a fast, clear and structured overview of the current multi-timeframe market situation. Instead of opening each timeframe manually and checking several indicators separately, the panel summarizes the most relevant information directly on the chart.

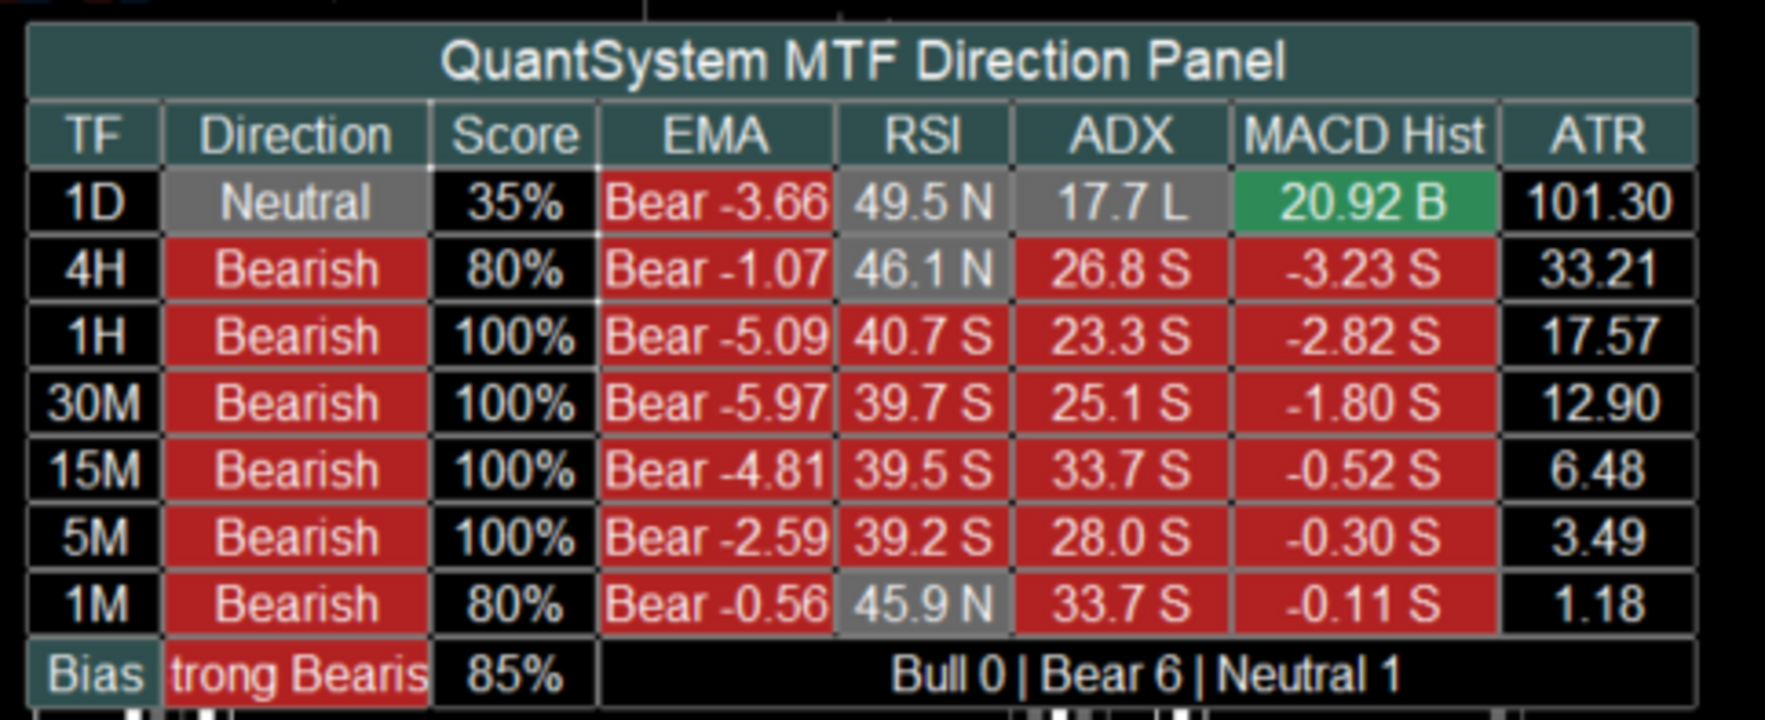
By default, the tool analyzes the following timeframes: 1D, 4H, 1H, 30M, 15M, 5M and 1M. For each timeframe, the panel calculates an individual market direction based on several technical components such as EMA, RSI, ADX, MACD Histogram and ATR.

The user can decide which values should be displayed in the panel and which components should be included in the score calculation. This allows the panel to be used either in a compact format or as a more detailed analysis dashboard.

The indicator is not designed as a standalone trading system. It is built as a professional market context and orientation tool for manual traders, systematic traders and users of automated trading strategies.

Main Idea of the Indicator

Many traders use multi-timeframe analysis to get a better understanding of the current market structure. However, a common mistake is focusing only on the current chart while ignoring the higher timeframes.

For example, an M1 chart may look bullish in the short term, while 1H, 4H and 1D are still clearly bearish. In such situations, a trader may be trading against the larger market structure without immediately noticing it.

This is exactly where QuantSystem Multi Timeframe Panel is designed to help. The panel shows at a glance which timeframes are bullish, which timeframes are bearish, which timeframes are neutral, how strong the current direction is, whether several timeframes are aligned in the same direction and whether the market is clearly directional or mixed.

This gives the user a fast visual overview without overloading the chart with many separate indicators.

What the Panel Displays

The panel consists of several columns. Some columns are always visible, while others can be enabled or disabled in the input settings.

The columns TF, Direction and Score are always visible.

The TF column shows the corresponding timeframe, for example 1D, 4H, 1H, 30M, 15M, 5M and 1M.

The Direction column shows the calculated direction of each timeframe. Possible values are Bullish, Bearish and Neutral. The direction is not based on only one value. Instead, it is calculated from a weighted combination of different technical components. By default, EMA, RSI, ADX and MACD can be included in this evaluation.

The Score column shows the strength of the calculated direction in percent. A high score means that several active analysis components are pointing in the same direction. A score of 100 percent means that all active score components confirm the same direction. A lower score means that the signals are more mixed or that some components are neutral or opposite.

In addition, the following optional columns can be displayed: EMA, RSI, ADX, MACD Hist and ATR. Each of these columns can be enabled or disabled separately through the inputs. This allows the user to customize the panel and keep the chart clean.

EMA Column

The EMA column shows the direction of the moving average structure.

By default, the indicator uses a Fast EMA with a length of 9 and a Slow EMA with a length of 21.

The logic is simple: if the Fast EMA is above the Slow EMA, the EMA component is evaluated as bullish. If the Fast EMA is below the Slow EMA, the EMA component is evaluated as bearish.

In compact mode, the EMA column does not display both full EMA prices. Instead, it shows the direction and the difference between the Fast EMA and the Slow EMA. This keeps the panel much cleaner and easier to read.

Example: Bull 2.35 means that the Fast EMA is above the Slow EMA. Bear -4.18 means that the Fast EMA is below the Slow EMA.

The EMA difference also gives the user an idea of how far both moving averages are apart. This means the panel does not only show direction, but also provides a basic sense of EMA separation.

RSI Column

The RSI column shows the current RSI value of each timeframe.

By default, the indicator uses an RSI period of 14, an RSI midline of 50 and a neutral zone of 5 points.

With the default settings, this means: RSI above 55 is evaluated as bullish, RSI below 45 is evaluated as bearish and RSI between 45 and 55 is evaluated as neutral.

The RSI value is displayed in a compact format, for example 56.8 B, 43.2 S or 49.5 N.

B stands for bullish, S stands for bearish and N stands for neutral.

The neutral zone is important because RSI values around the 50 level often do not provide a clear directional signal. Without a neutral zone, every small movement above or below 50 would immediately be interpreted as bullish or bearish. The neutral zone makes the evaluation smoother and cleaner.

ADX Column

The ADX column shows trend strength and trend direction using ADX, PlusDI and MinusDI.

By default, the indicator uses an ADX period of 14 and a minimum ADX value of 18.

The logic is: if ADX is below the minimum value, the ADX component is evaluated as weak or neutral. If ADX is above the minimum value and PlusDI is greater than MinusDI, the component is evaluated as bullish. If ADX is above the minimum value and MinusDI is greater than PlusDI, the component is evaluated as bearish.

Example displays are 26.8 B, 31.2 S or 14.5 L.

B stands for bullish, S stands for bearish and L stands for low or too weak.

ADX is useful because it does not only evaluate direction, but also checks whether there is enough trend strength. This can help identify weak or unclear market phases.

MACD Histogram Column

The MACD column does not display MACD Main and MACD Signal as two long values. Instead, it shows the difference between both lines.

The calculation is: MACD Histogram = MACD Main minus MACD Signal.

By default, the indicator uses MACD Fast 12, MACD Slow 26 and MACD Signal 9.

The logic is: if the MACD Histogram is greater than 0, the MACD component is evaluated as bullish. If the MACD Histogram is below 0, the MACD component is evaluated as bearish.

Example displays are 1.25 B or -3.42 S.

This format is much clearer than displaying both full MACD values. The user can immediately see whether MACD momentum is bullish or bearish.

ATR Column

The ATR column shows the current average price movement of each timeframe.

By default, the indicator uses an ATR period of 14.

ATR is currently displayed as a volatility value and is not included in the Direction Score calculation by default. This is intentional, because ATR does not provide a direct bullish or bearish direction. ATR mainly shows how much the market is currently moving.

A higher ATR value means higher market volatility. This can be especially useful in markets such as Gold, indices, Forex or cryptocurrencies, where volatility plays an important role.

How the Direction Is Calculated

The direction of each timeframe is calculated through a weighted point system.

By default, EMA, RSI, ADX and MACD can be included in the score.

The default weighting is: EMA Weight 35, RSI Weight 20, ADX Weight 25 and MACD Weight 20.

Together, this equals 100 points.

If all active components are bearish, the timeframe receives a bearish score of 100 percent. If some components are bullish while others are bearish or neutral, the score is calculated accordingly.

Example: EMA bearish gives 35 points to bearish, RSI neutral gives no points, ADX bearish gives 25 points to bearish and MACD bullish gives 20 points to bullish. The indicator then compares bullish and bearish points. The stronger side determines the direction, as long as the minimum score requirement is reached.

Neutral State

The indicator can also display a neutral state.

This is controlled by the settings Allow Neutral State and Min Directional Score.

By default, the minimum score is set to 60.

This means: if the stronger direction is below 60 percent, the timeframe is evaluated as neutral.

This prevents the indicator from showing a clear direction too quickly when the market situation is actually mixed.

Overall Bias

At the bottom of the panel, the indicator displays an overall market bias.

Possible values are Strong Bullish, Mild Bullish, Mixed, Mild Bearish and Strong Bearish.

This overall bias is based on how many of the analyzed timeframes are bullish, bearish or neutral.

By default, the Strong Alignment Count is set to 5. This means that if at least 5 out of 7 timeframes point in the same direction, the panel displays a strong bias.

Example: if 5 timeframes are bearish, the panel displays Strong Bearish. If 5 timeframes are bullish, the panel displays Strong Bullish.

If there is no clear majority, the panel displays a mixed or milder market condition.

Closed Candle Mode

An important setting is Use Closed Candle Mode.

When this option is enabled, the indicator uses only already closed candles for the higher timeframes.

This is important because values on open higher-timeframe candles can still change while the candle is forming.

For example, a 4H candle can look bullish during its formation, but close bearish by the end of the period. With Closed Candle Mode enabled, the panel works more conservatively and more stable because it only uses confirmed candle values.

If the user wants to see the most current live values, this option can be disabled. The panel will then react faster, but values may change more often during the still-open candle.

Compact Display

The Compact Display setting controls how compactly values are shown inside the panel.

When Compact Display is enabled, the panel shows short and clean values.

Examples: EMA Bear -3.20, RSI 43.5 S, ADX 28.4 S, MACD Hist -1.25 S and ATR 4.80.

When Compact Display is disabled, some values can be displayed in a more detailed format.

For most users, compact mode is recommended because it keeps the panel easier to read and uses less chart space.

Displayed Columns

The user can choose which values are displayed in the panel through the input settings.

The relevant settings are Show EMA, Show RSI, Show ADX, Show MACD and Show ATR.

If a column is disabled, it disappears from the panel. The basic columns TF, Direction and Score always remain visible.

This allows each user to decide whether they want a simple overview or a more detailed analysis panel.

A simple setup can display only TF, Direction and Score. A detailed setup can additionally display EMA, RSI, ADX, MACD Hist and ATR.

Score Components

In addition to the visible columns, the user can choose which components are included in the score calculation.

The relevant settings are Use EMA In Score, Use RSI In Score, Use ADX In Score and Use MACD In Score.

This is important because display and calculation are controlled separately.

For example, a user can display RSI in the panel but exclude RSI from the score calculation. Another user can base the score only on EMA and ADX, while MACD and RSI are shown only as additional information.

This makes the indicator flexible and adaptable to different trading styles.

Adjustable Periods and Parameters

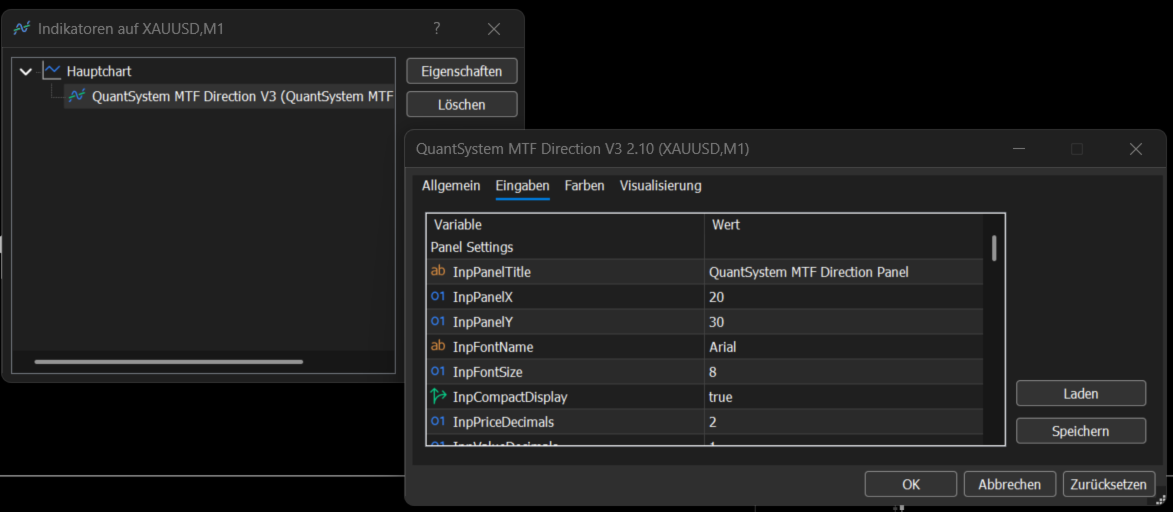
The indicator provides several inputs that allow the user to customize the calculation.

In the EMA Settings, the user can adjust Fast MA Length, Slow MA Length, MA Method, Applied Price, Use EMA In Score and EMA Weight.

In the RSI Settings, the user can adjust RSI Period, RSI Midline, RSI Neutral Zone, Use RSI In Score and RSI Weight.

In the ADX Settings, the user can adjust ADX Period, Minimum ADX, Use ADX In Score and ADX Weight.

In the MACD Settings, the user can adjust MACD Fast, MACD Slow, MACD Signal, Use MACD In Score and MACD Weight.

In the ATR Settings, the user can adjust the ATR Period.

In the Bias Settings, the user can adjust Allow Neutral State, Min Directional Score and Strong Alignment Count.

Panel Position and Design

The user can also customize the visual appearance of the panel.

This includes Panel X, Panel Y, Font Name, Font Size, Compact Display, Price Decimals, Value Decimals, MACD Decimals and the colors.

Panel X and Panel Y can be used to move the dashboard on the chart. If the panel should be moved further to the right, Panel X can be increased. If the panel should be moved further down, Panel Y can be increased.

Colors for bullish, bearish, neutral, header, text and borders can also be adjusted.

Alerts

The indicator includes an optional alert function.

If Enable Bias Alerts is activated, an alert can be triggered when the Overall Bias changes.

Examples of possible changes are Strong Bearish to Mixed, Mixed to Strong Bullish or Mild Bullish to Strong Bullish.

This function can be useful if the user wants to be notified when the multi-timeframe structure changes significantly.

Notes About the Screenshots

The screenshots show different display versions of the indicator directly on a MetaTrader 5 chart.

The screenshots show how the panel appears in the main chart window, how multiple timeframes are analyzed at the same time, how Direction and Score are displayed for each timeframe, how optional values such as EMA, RSI, ADX, MACD Histogram and ATR appear in detailed mode and how the Overall Bias is summarized at the bottom of the panel.

The screenshots are visual examples of how the indicator can look in practical chart use. Depending on the symbol, timeframe, broker data, enabled inputs and selected panel position, the display may differ slightly.

Suitable Markets

The indicator can generally be used on all markets available in MetaTrader 5.

Examples include Gold, Forex, indices, cryptocurrencies, commodities and stock CFDs.

The panel can be especially useful in markets where multi-timeframe structure plays an important role, for example XAUUSD, EURUSD, GBPUSD, US100, US500, BTCUSD and ETHUSD.

The indicator is not limited to a specific symbol.

Practical Use

The indicator can be used for different purposes, for example as a fast multi-timeframe market overview, as a trend filter for manual trades, as additional confirmation before an entry, for identifying mixed market phases, for comparing short-term and long-term timeframes and for supporting the analysis of trend strength, momentum and volatility.

One possible use case: if 1D, 4H and 1H are bearish while M1 is temporarily bullish, the user can quickly recognize that the short-term move may only be a correction within a larger bearish structure.

On the other hand, strong alignment across several timeframes can indicate a clearer market phase.

Important Notice

QuantSystem Multi Timeframe Panel is not a standalone trading system and does not provide guaranteed buy or sell signals.

The indicator is designed only for technical market analysis and for better understanding the current multi-timeframe structure.

Trading involves risk. Technical indicators, historical price movement or current market structures do not guarantee future results. Every user should perform their own testing, adjust the settings to their own trading style and use appropriate risk management.
Рекомендуем также
Let us introduce the Heikin Ashi RSI Oscillator! This indicator combines the concepts of Heikin Ashi candles with the RSI (Relative Strength Index) to produce an oscillator-like format that can be used to filter out some of the noise associated with standard RSI readings. This provides traders with a smoother representation of market conditions. Here are some articles to read more about the RSI and Heikin Ashi candles: https://www.investopedia.com/terms/r/rsi.asp https://www.investopedia.com/ter
SafePair Manual Trader Pro MultiPairs SafePair Manual Trader Pro MultiPairs — это продвинутый торговый советник для MetaTrader 5, разработанный для профессиональной ручной торговли, полуавтоматического управления сделками, мультисимвольного мониторинга, планирования риска и интеллектуального анализа рынка через одну мощную панель управления. Этот советник создан для трейдеров, которым нужны быстрая ручная торговля, структурированный контроль риска, умная торговая поддержка и понятные рекомендаци
Divergent Stochastic Filter II Catch Reversals Early, Filter Noise, Trade with Confidence The Edge: Why This Stochastic is Different  Every trader knows the Stochastic oscillator. But knowing when to trust its signals, that's the real challenge. The Divergent Stochastic Filter II transforms this classic indicator into a precision reversal detection system by adding critical elements: divergence intelligence, signal filtering and exhaustion detection.  While standard Stochastic oscillators fire s
Многорыночный, многовременной сканер, который оценивает тренд, местоположение и импульс в единый торговый рейтинг (от 0 до 100) — с адаптивным определением режима и встроенными фильтрами шума. Сканирует 10 символов одновременно на Форексе, криптовалютах, индексах, металлах и нефти. Полное описание APEX Multi-Market Scanner — перестаньте перелистывать графики. Смотрите весь рынок сразу. APEX — это профессиональная панель мониторинга, которая сканирует до 10 символов одновременно — основные/вт
Глобальная хронология сессий Описание продукта Индикатор Global Sessions Timeline, эксклюзивный для MetaTrader, отображает в виде графика динамику работы четырех крупнейших мировых финансовых рынков (Сидней, Токио, Лондон и Нью-Йорк). Она предоставляет информацию в режиме реального времени об открытии и закрытии торговых сессий, а также о пересечениях рынков, где волатильность достигает максимума, на основе времени брокерского сервера (GMT), с помощью интуитивно понятной панели управления.
FREE
BlueBoat – Prime Cycle is a technical indicator for MetaTrader 5 that visualizes market cycles based on the Fimathe cycle model (Marcelo Ferreira) . It identifies and displays historic and live cycle structures such as CA, C1, C2, C3, etc., helping traders understand the rhythm and timing of price movement across multiple sessions. This tool is ideal for manual analysis or as a supporting signal in discretionary strategies. Key Features Historical Cycle Analysis – Backtest and visualize as many
Axiom Point — индикатор точного структурного пробоя Axiom Point — это высокопроизводительный аналитический индикатор, предназначенный для определения зон разворота с повышенной вероятностью на основе анализа ценового поведения и адаптивной фильтрации баланса. Индикатор использует многоуровневую аналитическую модель для выявления моментов, когда цена выходит за пределы своего нормального равновесного диапазона, что может указывать на формирование нового импульса рынка. В отличие от классических т
"Adjustable Fractals" - это расширенная версия индикатора фракталов, очень полезный инструмент для торговли! - Как мы знаем, стандартный индикатор fractals MT5 вообще не имеет настроек - это очень неудобно для трейдеров. - Adjustable Fractals решил эту проблему - в нем есть все необходимые настройки: - Настраиваемый период индикатора (рекомендуемые значения - выше 7). - Настраиваемое расстояние от максимумов/минимумов цены. - Настраиваемый дизайн фрактальных стрелок. - Индикатор имеет встроенны
Prime Vortex Pro (MT5) — Multi-Layer Confluence Trend & Reversal Signal Indicator Built natively for MetaTrader 5. Fewer signals. Stronger confluence. Why Prime Vortex Pro Exists Most signal indicators fire on nearly every candle — dozens of arrows a day, most of them noise that pulls traders into weak, low-probability setups. Prime Vortex Pro flips that approach: silence is the default. A signal only appears when multiple, independent layers of market evidence — trend, trend strength, market st
Supertrend — относительно непопулярный технический индикатор, разработанный, как указано выше, Оливье Себамом, чтобы помочь трейдерам определять тренды и знать, когда покупать или продавать финансовый актив. Индикатор не найден по умолчанию в TradingView и MetaTrader. Тем не менее, вы можете найти на рынке специальные индикаторы Supertrend. При нанесении на график индикатор супертренда отображается двумя цветами. Хотя их можно изменить, цвета по умолчанию обычно красный и зеленый. Когда он зел
Индикатор Crypto_Forex "WPR с 2 скользящими средними" для MT5, без перерисовки. - Сам по себе WPR является одним из лучших осцилляторов для скальпинга. - Индикатор "WPR и 2 скользящие средние" позволяет видеть быстрые и медленные скользящие средние осциллятора WPR. - Индикатор дает возможность увидеть коррекцию цены на очень ранней стадии. - Этот индикатор очень легко настроить через параметры, его можно использовать на любом таймфрейме. - Условия входа на покупку и продажу показаны на изображ
Будьте на шаг впереди рыночного импульса с помощью Pip Movement Alert MT5 — универсального мультивалютного индикатора, предназначенного для отслеживания и оповещения трейдеров о точных движениях в пунктах по нескольким символам, идеально подходящего для торговли на рынках форекс, акций, криптовалют и сырьевых товаров. Высоко ценится в торговых сообществах, таких как Forex Factory и Reddit’s r/Forex, и отмечен в обсуждениях на Investopedia и TradingView за способность выявлять внезапные рыночные
FREE
Divergence Hunter - Professional Multi-Oscillator Divergence Detection System Overview Divergence Hunter is a professional-grade technical indicator designed to automatically detect and visualize price-oscillator divergences across multiple timeframes. Built for serious traders who understand the power of divergence trading, this indicator combines precision detection algorithms with an intuitive visual interface. Key Features Multiple Oscillator Support: RSI (Relative Strength Index) MACD (Mo
FREE
Trade history
Andriy Konovalov
5 (2)
Индикатор строит графики зафиксированной на момент закрытия свечи прибыли для закрытых (или частично закрытых) длинных и коротких позиции отдельно. Индикатор позволяет фильтровать сделки по текущему символу, заданному ID эксперта (магическому числу) и наличию (отсутствию) подстроки в комментарии к сделке, задавать начальное время и периодичность сброса прибыли (ежедневно, еженедельно или ежемесячно) для расчёта графика прибыли. Индикатор также отображает плавающую (не зафиксированную) прибыль от
Short Description Swing Timing Breakout EA is a smart Expert Advisor for MetaTrader 5 that combines trend filtering, momentum timing, and dynamic risk management to capture high-probability swing and breakout opportunities. Full Description Swing Timing Breakout EA is a professional trading robot designed for MetaTrader 5, suitable for traders who want a balance between automation, control, and disciplined risk management. This EA uses a trend-following and momentum confirmation approach ,
Данный информационный индикатор будет полезен тем, кто всегда хочет быть в курсе текущей ситуации на счете. VERSION MT 4 -  Больше полезных индикаторов Индикатор отображает такие данные, как прибыль в пунктах, процентах и валюте, а также спред по текущей паре и время до закрытия бара на текущем таймфрейме. Существует несколько вариантов расположения информационной строки на графике: Справа от цены (бегает за ценой); Как комментарий (в левом верхнем углу графика); В выбранном углу экрана. Так же
FREE
Plug & Play portfolio - series of high-quality EURUSD H1 strategies for maximized success. The eighth strategy, the last one from the EUR-8 portfolio , uses BollingerBands mean reversal method for setting up the pending order. To have a whole portfolio of strategies, which trades for you is incredibly efficient, don't miss that opportunity. Check my other strategies today! and assemble your portfolio. Benefits for you Plug & Play system , designed to have   simple initial setup . That's saved
Знание о силе и слабости каждой из валют очень важно для каждого трейдера, торгующего на рынке форекс. Данный индикатор силы валют измеряет силу восьми основных валют (USD, EUR, GBP, CHF, JPY, CAD, AUD, NZD) на основе индикатора индекса относительной силы (Relative Strength Index, RSI). Индикатор PipTick Currency Strength в простой и доступной форме показывает, когда валюта находится в зоне перекупленности, перепроданности или в "нормальном состоянии". Так вы с легкостью можете определить, какая
1 цена за 3 стратегии Сигнал в реальном времени:   QL Drive   |   QL Steady          Сет-файлы Что такое Quant Lattice (Квант Латтис) Quant Lattice (Квант Латтис) — это полностью автоматический торговый советник (Expert Advisor), который торгует одной валютной парой: AUDCAD. Он поставляется с двумя разными стратегиями — Steady (Стеди) и Drive (Драйв).  Вы устанавливаете его один раз, выбираете стратегию, настраиваете управление капиталом — и он торгует без вашего вмешательства. Почему AUDCAD?
Unlock the power of Smart Money Concepts (SMC) with the cleanest FVG indicator on the market. Smart FVG Pro is not just another gap detector. It is designed for professional traders who need to filter out noise and focus on high-probability reversal zones. Unlike standard indicators that clutter your chart with every minor gap, Smart FVG Pro uses advanced filtering logic (Trend + Volatility) and a unique "Smart Mitigation" system to automatically remove invalidated zones, keeping your chart clea
**   All Symbols   x   All Time frames   scan just by pressing scanner button ** Discount : Only 4   of 5 copy  is 35$. ***   Contact me  to send you instruction   and add you in "Order Block group" for sharing or seeing experiences with other users. Introduction: The central banks and financial institutions mainly drive the market,   Order block is considered a market behavior that indicates accumulation of orders from banks and institutions, then   the market tends to make a sharp move(Imbala
Candle Timer Countdown Pro отображает плавный и точный обратный отсчёт до закрытия текущей свечи с круговой шкалой прогресса, позволяющей мгновенно видеть оставшееся время. В отличие от обычных таймеров, которые замирают между тиками или сбиваются, данный индикатор использует интерполяцию серверного времени и обеспечивает плавную работу на всех таймфреймах от M1 до MN. Независимо от того, торгуете ли вы скальпинг на M1 или свинг на H4, точное знание времени закрытия свечи помогает правильно выбр
Magic KAMA System is a trading system based on Kaufman's Adaptive Moving Average (KAMA), with several other indicators as filters. This algorithm provides highly reliable entry points, and its simple settings allow it to be used for any symbol and trading style. Settings for notification alerts and SL/TP multiples of the ATR are included, making it flexible enough to handle market fluctuations. Similarly, settings for all indicators used are customizable. Signals are generated at the closing of
== LT RAINBOW TREND — ТРЕНДОВЫЙ ИНДИКАТОР НА ОСНОВЕ 36 СКОЛЬЗЯЩИХ СРЕДНИХ == ОБЗОР LT Rainbow Trend — это продвинутый технический индикатор для анализа тренда, который использует 36 одновременно работающих скользящих средних с умной цветовой системой («Радуга»). Разработанный для трейдеров, стремящихся торговать по направлению главного тренда с максимальной визуальной четкостью, этот индикатор превращает сложный мультитаймфреймовый анализ в простое, цветное и интуитивно понятное отображение. И
FuturePath Forecast – Predict Your Next Move! See potential price movements instantly with AI_Path! Combines trend slope and smooth cycles to create a clear forecast path on your chart. Perfect for traders who want an edge and smarter decisions in real time. Visual Forecasting: Instantly see where the market could go next. Trend + Cycle Analysis: Combines linear trend slope with smooth sinusoidal patterns for realistic projections. Customizable Horizon: Adjust the number of bars to forecast acc
Introducing the   Range Predictor : Your Ultimate Guide to Future Trading Ranges!   Imagine having the power to see into the future of market moves— Range Predictor   brings this dream to life. Designed to deliver real-time,   predictive support and resistance levels , this tool goes beyond standard indicators, offering trend direction insights and precise range   forecasts . Whether you're a day trader or a swing trader, the   Range Predictor   is your all-in-one toolkit for mastering the ma
IX Power MT5
Daniel Stein
4.92 (13)
IX Power: Получите рыночные инсайты для индексов, сырьевых товаров, криптовалют и форекс Обзор IX Power — это универсальный инструмент для анализа силы индексов, сырьевых товаров, криптовалют и форекс. В то время как FX Power предлагает наивысшую точность для валютных пар, используя данные всех доступных пар, IX Power фокусируется исключительно на данных рынка базового символа. Это делает IX Power отличным выбором для некорреляционных рынков и надежным инструментом для форекса, если вам не нуж
Session Atlas — профессиональная карта торговых сессий для MetaTrader 5 Session Atlas — это визуальный индикатор для MT5, который превращает обычный график в понятную карту торгового дня. Он показывает открытие, закрытие и активность основных торговых сессий прямо на графике, помогая быстрее понимать, где рынок находится сейчас: в азиатской, европейской или американской фазе. Многие трейдеры анализируют уровни, импульсы, пробои и волатильность, но при этом упускают важный фактор — время. Один и
FREE
Индикатор строит текущие котировки, которые можно сравнить с историческими и на этом основании сделать прогноз ценового движения. Индикатор имеет текстовое поле для быстрой навигации к нужной дате. Параметры : Symbol - выбор символа, который будет отображать индикатор; SymbolPeriod - выбор периода, с которого индикатор будет брать данные; IndicatorColor - цвет индикатора; Inverse - true переворачивает котировки, false - исходный вид; Далее идут настройки текстового поля, в которое можно ввес
Trades History Visualizer is a MetaTrader 5 indicator that displays your trading history directly on the chart, providing a clear visual representation of past trades with additional information. Key Features: Visual trade history display with entry arrows Entry, Stop Loss, and Take Profit horizontal lines Color-coded connector lines between entry and exit points (green for profit, red for loss) Risk-Reward ratio display for each closed trade Profit/Loss amount display option Pip display option
С этим продуктом покупают
Этот продукт был обновлен для рынка 2026 года и оптимизирован для последних сборок MT5. УВЕДОМЛЕНИЕ ОБ ИЗМЕНЕНИИ ЦЕНЫ: Smart Trend Trading System сейчас доступен за $99 . Цена увеличится до $199 после следующих 30 покупок . СПЕЦИАЛЬНОЕ ПРЕДЛОЖЕНИЕ: После покупки Smart Trend Trading System отправьте мне личное сообщение, чтобы получить Smart Universal EA БЕСПЛАТНО и превратить сигналы Smart Trend в автоматические сделки. Smart Trend Trading System — это полноценная торговая система без перерисов
Trend Sniper X
Sarvarbek Abduvoxobov
5 (6)
Trend Sniper X — это индикатор следования за трендом с несколькими таймфреймами для MetaTrader 5, который помогает трейдерам четко и точно определять направление тренда и потенциальные точки разворота. Информация о цене: Текущая цена является промо-ценой и может измениться по мере выпуска обновлений и новых функций. Канал Code2Profit Освойте рынок с помощью анализа нескольких таймфреймов! Технические характеристики Платформа MetaTrader 5 Тип индикатора Трендовый индикатор с несколькими таймфрейм
SuperScalp Pro
Van Minh Nguyen
4.69 (29)
SuperScalp Pro – Профессиональная многослойная скальпинговая система с подтверждением сигналов SuperScalp Pro — это профессиональная многослойная скальпинговая система с подтверждением сигналов по нескольким факторам, разработанная для поиска торговых возможностей с более высокой вероятностью успеха. Она предоставляет более точные подтверждения входа, уровни Stop Loss и Take Profit на основе ATR, а также гибкую систему фильтрации сигналов для XAUUSD, BTCUSD и основных валютных пар Forex. Полная
Давайте сначала будем честны. Ни один индикатор сам по себе не сделает вас прибыльным. Если кто-то говорит вам обратное — он продаёт вам мечту. Любой индикатор, который показывает идеальные стрелки покупки/продажи, можно сделать безупречным — просто увеличьте нужный участок истории и сделайте скриншот успешных сделок. Мы так делать не будем. SMC Intraday Formula — это инструмент. Он считывает структуру рынка за вас, определяет зоны с наивысшей вероятностью движения цены и точно показывает, как
Welcome to ENTRY IN THE ZONE AND SMC MULTI TIMEFRAME Entry In The Zone and SMC Multi Timeframe is a professional trading indicator built on Smart Money Concepts (SMC) , combining market structure analysis with a No Repaint BUY / SELL signal system in a single indicator. It helps traders understand market structure more clearly, identify key price zones, and focus on higher-quality trading opportunities. By combining Multi-Timeframe Analysis , Points of Interest (POIs) , and real-time signals, th
Neuro Poseidon - новый индикатор от Дарьи Резуевой. Он сочетает точные торговые сигналы с адаптивными уровнями TP/SL , в результате создавая максимально выгодные сделки! TO SWITCH TO   ENG   PLEASE CHOOSE IT IN THE UPPER-RIGHT CORNER OF THE WEBSITE Напишите мне и получите  Neuro Poseidon Assistant  в подарок для автоматизации вашей торговли! Что отличает его от других индикаторов? 1. Доказанная прибыльность на всех активах и таймфреймах 2. На графике присутствуют только подтвержденные сигналы н
M1 Quantum MT5
Hamed Dehgani
4.56 (9)
Торговые сигналы в реальном времени с использованием M1 Quantum: Сигнал  (Сделка выполнена автоматически с помощью Quantum Trade Assistant , бесплатно включённого в этот продукт.) План цен: Текущая цена: $169 (Предложение для ранних пользователей) Следующая запланированная цена: $189 Планируемая розничная цена: $299 Developer Note: После покупки свяжитесь со мной, чтобы получить последний рекомендуемый set-файл , полезные рекомендации по настройке, а также приглашение в VIP-группу поддержки , г
Gold Entry Sniper – Профессиональная Мульти-Таймфрейм ATR Панель для Скальпинга и Свинг-Трейдинга на Золоте Gold Entry Sniper — это передовой индикатор для MetaTrader 5, разработанный для точных сигналов на покупку/продажу по XAUUSD и другим инструментам. Основан на логике ATR Trailing Stop и мульти-таймфрейм анализе , этот инструмент идеально подходит как для скальперов, так и для среднесрочных трейдеров, обеспечивая чёткие точки входа с высокой вероятностью . Основные возможности и преимуществ
Каждый покупатель этого индикатора получает дополнительно Бесплатно: Авторскую утилиту "Bomber Utility", которая автоматически сопровождает каждю торговую операцию, устанавливает уровни Стоп Лосс и Тейк профит и закрывает сделки согласно правилам этой стратегии, Сет-файлы для настройки этого индикатора на различных активах, Сет-файлы для настройки Bomber Utility в режимы: "Минимум Риска", "Взвешенный Риск" и "Стратегия Выжидания", Пошаговый видео-мануал, который поможет вам быстро установить, на
UZFX {SSS} Scalping Smart Signals v4.0 MT5 — это высокопроизводительный торговый индикатор без перерисовки, разработанный для скальперов, дейтрейдеров и свинг-трейдеров, которым требуются точные сигналы в режиме реального времени на быстро меняющихся рынках. Разработанный компанией (UZFX-LABS), этот индикатор сочетает в себе анализ ценового действия, подтверждение тренда и интеллектуальную фильтрацию для генерации высоковероятных сигналов на покупку и продажу, предупреждающих сигналов и возможно
Gann Made Easy   - это профессиональная, но при этом очень простая в применении Форекс система, основанная на лучших принципах торговли по методам господина У.Д. Ганна. Индикатор дает точные BUY/SELL сигналы, включающие в себя уровни Stop Loss и Take Profit. ПОЖАЛУЙСТА, СВЯЖИТЕСЬ СО МНОЙ ПОСЛЕ ПОКУПКИ, ЧТОБЫ ПОЛУЧИТЬ ТОРГОВЫЕ ИНСТРУКЦИИ И ОТЛИЧНЫЕ ДОПОЛНИТЕЛЬНЫЕ ИНДИКАТОРЫ БЕСПЛАТНО! Вероятно вы уже не раз слышали о торговли по методам Ганна. Как правило теория Ганна отпугивает от себя не только
Этот продукт был обновлен для рынка 2026 года и оптимизирован для последних сборок MT5. УВЕДОМЛЕНИЕ ОБ ИЗМЕНЕНИИ ЦЕНЫ: Atomic Analyst сейчас доступен за $99 . Цена увеличится до $199 после следующих 30 покупок . СПЕЦИАЛЬНОЕ ПРЕДЛОЖЕНИЕ: После покупки Atomic Analyst отправьте мне личное сообщение, чтобы получить Smart Universal EA БЕСПЛАТНО и превратить сигналы Atomic Analyst в автоматические сделки. Atomic Analyst — это индикатор Price Action без перерисовки, без перерисовывания истории и без
M1 SNIPER   — это простая в использовании торговая система. Это стрелочный индикатор, разработанный для тайм фрейма M1. Индикатор можно использовать как отдельную систему для скальпинга на тайм фрейме M1, а также как часть вашей существующей торговой системы. Хотя эта торговая система была разработана специально для торговли на M1, ее можно использовать и с другими тайм фреймами. Первоначально я разработал этот метод для торговли XAUUSD и BTCUSD. Но я считаю этот метод полезным и для торговли на
Легенда возвращается! Entry Points Pro 10. Перезапуск легендарного индикатора, который 3 года держался в Топ-3 MQL5 Market. Сотни восторженных отзывов (589 на две версии), тысячи трейдеров торгуют с его помощью каждый день, 31 000+ скачиваний демо MT4+MT5. Я прочитал каждый ваш отзыв за пять лет — и вместо обещаний встроил в версию 10 ответы. От автора, который в рынке с 1999 года и ценит честность, свою репутацию и своих клиентов . Стартовая цена $99 действует только на первые 10 копий.   Сразу
Quantum TrendPulse
Bogdan Ion Puscasu
5 (25)
Представляем   Quantum TrendPulse   , совершенный торговый инструмент, который объединяет мощь   SuperTrend   ,   RSI   и   Stochastic   в один комплексный индикатор, чтобы максимизировать ваш торговый потенциал. Разработанный для трейдеров, которые ищут точность и эффективность, этот индикатор помогает вам уверенно определять рыночные тренды, сдвиги импульса и оптимальные точки входа и выхода. Основные характеристики: Интеграция SuperTrend:   легко следуйте преобладающим рыночным тенденциям и п
Power Candles V3 — самооптимизирующийся индикатор силы Power Candles V3 преобразует силу валюты и инструмента в готовый к использованию торговый план на каждом графике, к которому он прикреплен. Вместо того, чтобы просто раскрашивать свечи, он выполняет автоматическую оптимизацию в режиме реального времени в фоновом режиме и предоставляет вам оптимальные значения Stop Loss, Take Profit и порог сигнала для выбранного вами символа. Один клик — и все готово для реальной торговли: на графике появляю
GoldenX Entry — это индикатор для MT5 с адаптивным алгоритмом Smart Entry Trend, системой оценки сигналов, детектором рыночных режимов и фильтром волатильности. Каждый сигнал включает рассчитанный уровень входа, три уровня Take-Profit (TP1, TP2, TP3) и уровень Stop-Loss. Он построен на нескольких аналитических слоях, предназначенных для адаптации к различным рыночным условиям, объединяя многоуровневую аналитическую систему со встроенным оптимизатором и системой статистического отслеживания. Инди
Zoryk Gold
Reda El Koutbane
5 (2)
ограниченное количество копий по стартовой цене ZORYK — продвинутая сигнальная система для XAUUSD в MetaTrader 5 Вам знакомо это чувство. Вы анализируете золото, ждёте вход и наконец открываете сделку. Цена сразу начинает двигаться против вас. Вы закрываете позицию слишком рано, переносите Stop Loss или сомневаетесь несколько секунд. А затем рынок без вас достигает именно той цели, которую вы ожидали с самого начала. Проблема не всегда была в направлении. Настоящая проблема была в неопред
Trend Catcher   анализирует движения рыночных цен, используя комбинацию собственных и индивидуально разработанных адаптивных индикаторов анализа тренда. Он определяет истинное направление рынка, отфильтровывая краткосрочные шумы и фокусируясь на силе импульса, расширении волатильности и поведении ценовой структуры. Он также использует комбинацию сглаживающих и фильтрующих тренд индикаторов, таких как скользящие средние, RSI и фильтры волатильности. Мониторинг реальных операций, а также другие
Crystal Heikin Ashi Signals - Professional Trend & Signal Detection Indicator Advanced Heikin Ashi Visualization with Intelligent Signal System for Manual & Automated Trading Final Price: $149 ---------> Price goes up $10 after every 10 sales . Limited slots available — act fast . Overview Crystal Heikin Ashi Signals is a professional-grade MetaTrader 5 indicator that combines pure Heikin Ashi candle visualization with an advanced momentum-shift detection system. Designed for both manual traders
ARIPoint
Temirlan Kdyrkhan
1 (1)
ARIBot is a powerful trading companion designed to generate high-probability entry signals with dynamic TP/SL/DP levels based on volatility. Built-in performance tracking shows win/loss stats, PP1/PP2 hits, and success rates — all updated live. Key Features: Buy/Sell signals with adaptive volatility bands Real-time TP/SL/DP levels based on ATR Built-in MA Filter with optional ATR/StdDev volatility Performance stats panel (Success, Profit/Loss, PP1/PP2) Alerts via popup, sound, push, or email Cus
FX Power: Анализируйте силу валют для более эффективной торговли Обзор FX Power — это ваш незаменимый инструмент для понимания реальной силы валют и золота в любых рыночных условиях. Определяя сильные валюты для покупки и слабые для продажи, FX Power упрощает принятие торговых решений и выявляет высоковероятные возможности. Независимо от того, хотите ли вы следовать за трендами или предсказывать развороты с использованием экстремальных значений дельты, этот инструмент идеально адаптируется под
AXIOM MATRIX MT5 СТАРТОВАЯ ЦЕНА: $99 Axiom Matrix доступен по стартовой цене $99. Цена увеличится до $199 после первых 30 покупок. После покупки напишите мне в личные сообщения, чтобы получить инструкции и забрать свой эксклюзивный подарочный бонус. Axiom Matrix — это профессиональный мультисимвольный и мультитаймфреймный рыночный сканер и панель принятия решений для MetaTrader 5. Он сканирует ваш Market Watch, анализирует несколько таймфреймов, считывает несколько движков подтверждений, сравнив
Currency Strength Wizard   — очень мощный индикатор, предоставляющий вам комплексное решение для успешной торговли. Индикатор рассчитывает силу той или иной форекс-пары, используя данные всех валют на нескольких тайм фреймах. Эти данные представлены в виде простых в использовании индексов валют и линий силы валют, которые вы можете использовать, чтобы увидеть силу той или иной валюты. Все, что вам нужно, это прикрепить индикатор к графику, на котором вы хотите торговать, и индикатор покажет вам
Этот продукт был обновлен для рынка 2026 года и оптимизирован для последних сборок MT5. УВЕДОМЛЕНИЕ ОБ ИЗМЕНЕНИИ ЦЕНЫ: Smart Price Action Concepts сейчас доступен за $200 . Цена увеличится до $299 после следующих 30 покупок . СПЕЦИАЛЬНОЕ ПРЕДЛОЖЕНИЕ: После покупки отправьте мне личное сообщение, чтобы получить БЕСПЛАТНЫЙ бонус + подарок . Прежде всего, стоит подчеркнуть, что этот торговый инструмент является индикатором без перерисовки, без перерисовывания истории и без запаздывания, что делает
Reversion King Indicator
Eugen-alexandru Zibileanu
5 (5)
Новый король в городе — Индикатор + управление ордерами (TP1 + TP2 + TP3) + опциональный Telegram-сигнал-сендер ВКЛЮЧЁН (БЕСПЛАТНО) (ПОЛНОЦЕННАЯ ТОРГОВАЯ И СИГНАЛЬНАЯ СИСТЕМА) Gold Slayer EA Этот индикатор включает в себя продвинутую стратегию, торговую систему с настраиваемым управлением ордерами и систему mean reversion, которая сочетает расширения Envelope и поддерживается несколькими интеллектуальными фильтрами подтверждения, такими как RSI, для поиска высоковероятных точек разворота с сигн
Quant Direction — это инструмент трехмерного анализа рынка. Он обеспечивает полностью объективный, основанный на алгоритмах анализ рынка, одновременно вычисляя точные процентные отклонения по нескольким параметрам. Разработанный с использованием передовых инструментов моделирования на основе искусственного интеллекта и тщательно протестированный, алгоритм предназначен для интерпретации рынка с уникальной точностью. Он может анализировать любую валютную пару или финансовый инструмент на вашей пла
Станьте Breaker Trader и получайте прибыль от изменений структуры рынка по мере изменения цены. Индикатор выключателя блока ордеров определяет, когда тренд или движение цены приближаются к истощению и готовы развернуться. Он предупреждает вас об изменениях в структуре рынка, которые обычно происходят, когда произойдет разворот или серьезный откат. Индикатор использует собственный расчет, который определяет прорывы и ценовой импульс. Каждый раз, когда новый максимум формируется около возможной
Btmm state engine pro
Garry James Goodchild
5 (4)
BTMM State Engine Pro is a MetaTrader 5 indicator for traders who use the Beat The Market Maker approach: Asian session context, kill zone timing, level progression, peak formation detection, and a multi-pair scanner from a single chart. It combines cycle state logic with a built-in scanner dashboard so you do not need the same tool on many charts at once. What it does Draws the Asian session range; session times can follow broker server offset or be set in inputs. Tracks level progression (L
Smc Pro ToolKit
Talal N Z Aljarusha
5 (3)
SMC Pro ToolKit  is a professional chart-based Smart Money Concepts indicator for MetaTrader 5. It helps traders read market structure, identify key liquidity areas, organize trade context, and plan setups directly from the chart. This is not a simple buy/sell arrow indicator. It is a complete visual trading toolkit that combines Smart Money Concepts, multi-timeframe analysis, session context, setup planning, risk assistance, and professional dashboard tools in one clean workspace. Watch setup
Другие продукты этого автора
ATR Long TP Box
Elias Balian Zimmermann
ATR Long Box Anchor MT5 ATR Long Box Anchor MT5 is a visual risk-reward indicator for MetaTrader 5, specifically designed for planning long setups. The indicator creates an ATR-based long box directly on the chart, including entry, stop-loss zone, take-profit zone, and optional risk-reward information. The indicator works with a freely movable anchor point. This anchor defines the desired entry price and the candle whose ATR value is used for the calculation. This allows a long setup to be plann
FREE
ATR Short Box Anchor MT5 ATR Short Box Anchor MT5 is a visual risk-reward indicator for MetaTrader 5, specifically designed for planning short setups. The indicator creates an ATR-based short box directly on the chart, including entry, stop-loss zone, take-profit zone, and optional risk-reward information. The indicator works with a freely movable anchor point. This anchor defines the desired entry price and the candle whose ATR value is used for the calculation. This allows a short setup to be

FREE
Фильтр:
ZZZ8989jonow
49
ZZZ8989jonow 2026.05.21 12:15 
 

QuantSystem has a good spread of MTF price strength measures to determine an overall bias for market direction. However, for me it was way too heavy on available resources (cpu /data). This was particularly noticeable during US market opening, when price data updating was much slower than usual, while trying to process and feed all the hungry parameters in the indicator. As soon as I disabled it, my price data once again returned to it's usual high speed updating, with negligible lag. As a free indicator it is quite substantial and has many positive attributes, but definitely needs to lighten up a bit (if possible) to be user friendly to me. Also, has extensive information in Overview, but have not had any communication with owner.

Elias Balian Zimmermann
511
Ответ разработчика Elias Balian Zimmermann 2026.05.22 12:13
Thank you very much for your detailed and honest feedback. You are absolutely right that the indicator is currently quite feature-rich, especially when several timeframes and multiple components such as EMA, RSI, ADX, MACD and ATR are processed at the same time. During high-volume market sessions this can increase the calculation load, depending on the symbol, broker data feed and chart setup. I really appreciate this feedback, because performance and practical usability are very important to me. I am already working on a lighter and more optimized version with improved update handling, optional calculation modes and a more resource-friendly refresh logic. The goal is to keep the detailed multi-timeframe overview, while reducing CPU and data load as much as possible. Thank you again for testing the indicator and for pointing this out in such a constructive way. Feedback like this helps me improve the tool for real trading conditions.
You are also welcome to contact me privately.
Ответ на отзыв