Engine Smart DSignal ROI EA

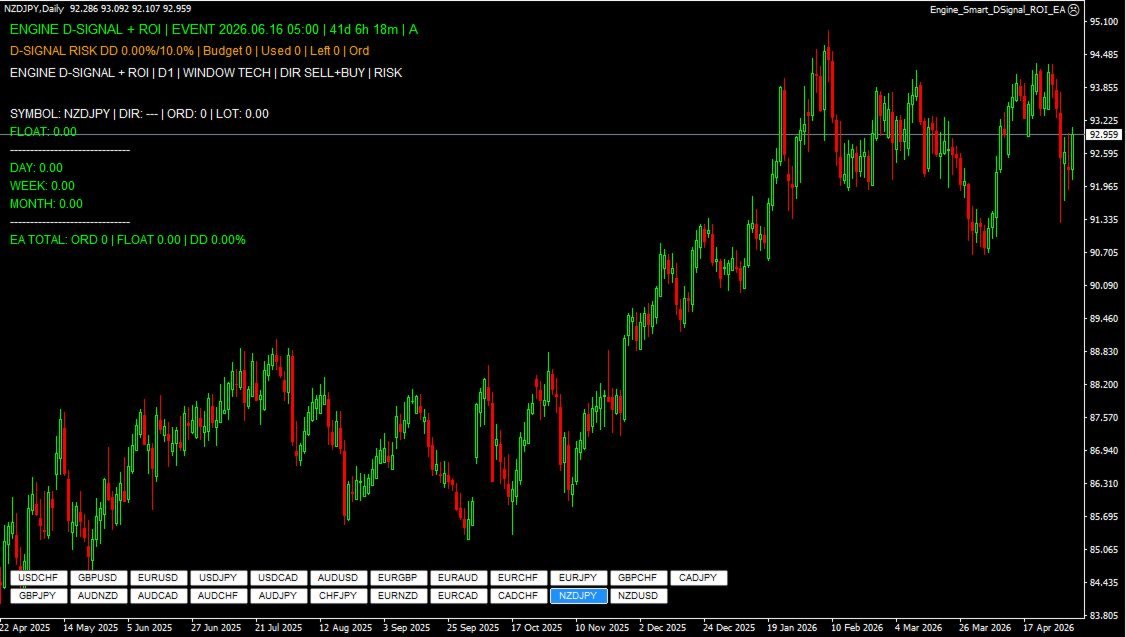
ENGINE SMART D-SIGNAL + ROI  EA

Advanced Daily Signal Trading System with ROI Event Priority Logic

OVERVIEW

ENGINE SMART D-SIGNAL + ROI is a professional Expert Advisor designed for multi-symbol trading using    ONLY Daily (D1)   signal-based system.


The EA combines:
- Smart D1 signal entries
- Controlled grid logic
- Advanced risk management
- ROI (Rate of Interest / BOJ-style event) priority exit system

It is designed to adapt to both normal market conditions and high-impact event-driven volatility.

CORE TRADING LOGIC

ENTRY LOGIC:
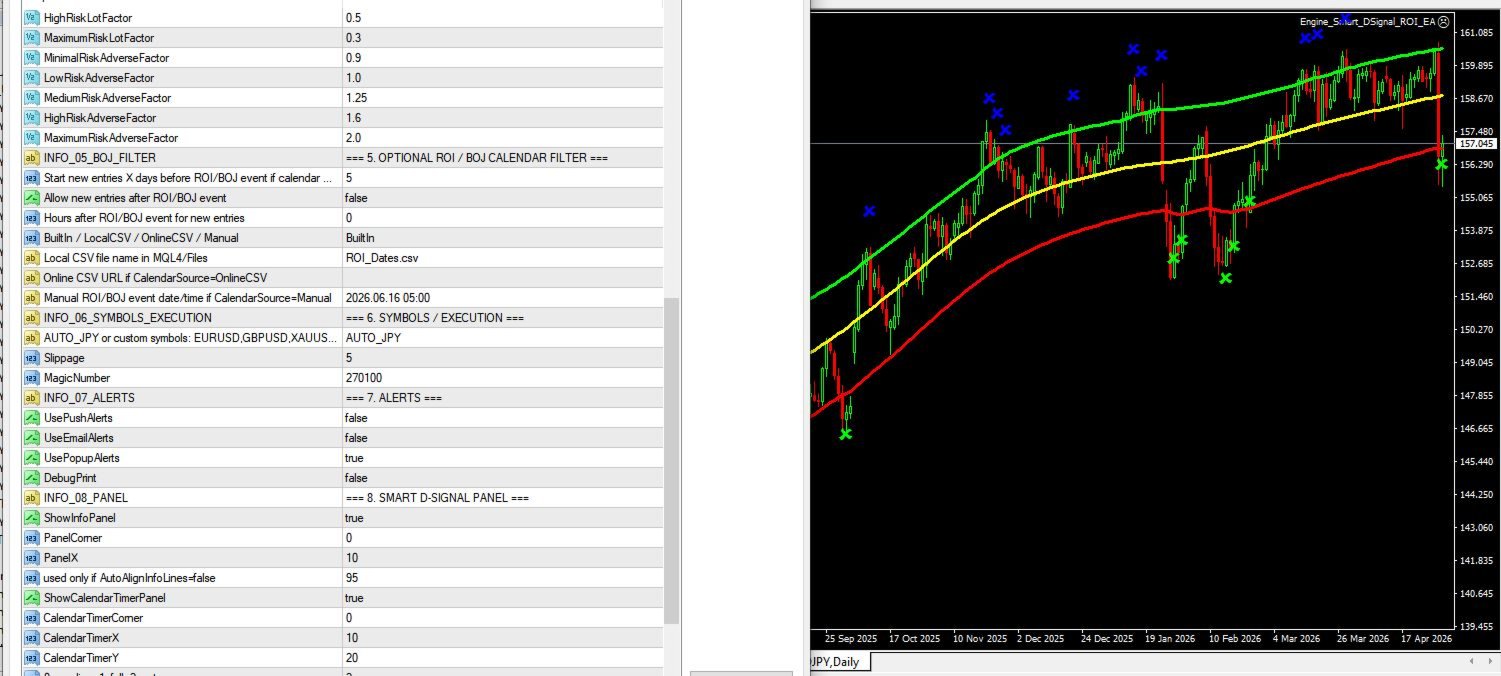
Trades are opened based on confirmed D1 signal conditions derived from dynamic price channel behavior.

SELL:
- Upper boundary interaction
- Confirmed bearish transition

BUY:
- Lower boundary interaction
- Confirmed bullish transition

Entries are never executed without directional confirmation.

ADDITIONAL ORDERS:
Additional positions are opened only when:
- A new valid signal appears
- Price is better than the previous order
- Minimum distance condition is satisfied

EXIT LOGIC (TARGET SYSTEM)

Target 1:
Intermediate zone.
Optional partial closing of best positions.

Target 2:
Opposite boundary.
Full position closure.

Reverse Exit:
If Target 2 is not reached and price reverses, remaining positions are closed.

ROI PRIORITY MODE

When ROI (event mode) is active:

- Partial closing at Target 1 is ignored
- Positions are held until Target 2
- Applies only to JPY symbols (default)

This allows capturing full impulse movements during high-impact events.

RISK MANAGEMENT

The EA includes:

- Maximum drawdown control
- RiskGuard (blocks risky entries)
- Adaptive lot calculation
- Safety reserve logic
- Multiple drawdown exit strategies

SETTINGS DESCRIPTION

GENERAL

TradingWindowMode – Technical or ROI window
DaysBeforeEvent – activation period before event
TradeAfterEvent – allow post-event entries
SignalSensitivity – signal precision level
UseAutoLot – automatic lot calculation
FirstOrderLot – base lot size

ORDER MANAGEMENT

MaxOrdersPerSymbol – max positions per symbol
DistanceBetweenOrdersPoints – spacing
LotMultiplier – scaling factor

TARGET EXIT SYSTEM

TargetExitMode – Standard / Partial
Target1ClosePercent – % to close at Target 1
CloseBestOrdersAtTarget1 – close profitable orders first

ROI SETTINGS

UseRoiPriorityExit – enable ROI full-hold mode
RoiOnlyForJPY – restrict to JPY symbols

RISK SETTINGS

MaxDrawdownPercent – max allowed DD
DrawdownAction – action on DD trigger
UseRiskGuard – risk blocking system
AutoLotSafetyReservePercent – reserved DD buffer

CALENDAR

CalendarSource – BuiltIn / CSV / Manual
LocalCalendarFile – CSV file name
ManualEventDateTime – manual event input

PANEL SETTINGS

ShowInfoPanel – enable panel
InfoLineGap – spacing between lines
Color settings for all lines

TESTER SETTINGS

IgnoreCalendarInTester – allow testing without events
IgnoreRiskFilterInTester – disable filters
DebugPrint – enable logs

UNIQUE ADVANTAGES

- Hybrid system (Technical + Event-driven)
- ROI adaptive exit logic
- Controlled grid (no uncontrolled martingale)
- Multi-symbol independent management
- Transparent panel with real-time data

IMPORTANT NOTICE

This EA is designed for professional use.

Always:
- Test on demo account
- Understand settings
- Use proper risk management


Marketplace Add-On Recommendation:

You can also purchase on MQL5 and integrate with this EA (and other systems)

  • our professional ProfRoboTrading Dashboard MultiSymbol E,A,

https://www.mql5.com/ru/market/product/159807?source=Site+Market+MT4+Search+Rating006%3aProfRoboTrading+Dashboard+MultiSymbol

as well as our proprietary indicators:

• TMA_Channel_PRO_Non_repaint

https://www.mql5.com/ru/market/product/164747?source=Site+Market+MT4+Search+Rating006%3aTMA_Channel_PRO_Non_repaint


作者的更多信息
This universal advisor is based on its own Algorithm, which is an incredibly effective tool due to the simultaneous operation of a trading strategy based on our  Indicator " Channel Sgnals ProfRoboTrading" and our proprietary signal filter system together with the Martingale method, which together work out a very interesting hedging system. Traders are also given the opportunity to set up their own risk management system with two filters to control deposit drawdowns . The advisor's algorithm is
TMA Centered Bands Indicator
Irina Cherkashina
5 (1)
The TMA Centered Bands Indicator for MT5 draws bands on the chart and shows the overall price trend. It displays three bands - the lower and upper boundaries of the channel and the median.   The bands are made up of moving averages, and each of them has an MA period. The name TMA comes from triangular moving averages, as the indicator draws triangular bands.   The price will fluctuate between these ranges whenever the trend changes direction, thus creating entry and exit points.   How to trade
FREE
Extreme Spike PRT
Irina Cherkashina
The Extreme Spike PRT Indicator   is an effective tool for identifying   sharp market fluctuations .   It performs its calculations using the ATR (Average True Range) indicator and displays candles with extreme volatility in two categories:   primary spikes   and   secondary spikes , within the Metatrader platform oscillator window. This tool assists traders in detecting   intense price movements   and conducting more precise   analyses   based on these fluctuations. Time Frame 15-minute - 1-ho
Bollinger Bands Stop Indicator holds significant importance for traders navigating the complex world of financial markets. Its relevance lies in several key aspects. Firstly, it aids in trend identification. By analyzing price movements relative to the Bollinger Bands, traders can discern whether the market is in an uptrend, downtrend, or ranging phase. Secondly, the indicator provides valuable insights into market volatility. Wider bands indicate higher volatility, while narrower bands suggest
FREE
The Channel Sgnals ProfRoboTrading Indicator for MT5 is an effective Forex trading tool designed to track market movements.   The MT5 signal point indicator effectively detects trend reversals after they have already occurred. This Indicator   is a fully automated technical tool that includes a number of parameters to track market trends.   It automatically examines the ever-changing price dynamics of the market, compares the information with earlier data and generates a trading signal. Because
FREE
Kalires Channel Indicator
Irina Cherkashina
3 (1)
The Kalires Channel Indicator is a technical indicator used to evaluate trend direction and potential trading opportunities. This is a hybrid indicator that combines Kauffman Adaptive Moving Average (KAMA), linear regression and smoothing. The Kalires Channel Indicator consists of two lines: one central and two outer bands. The central line is a smoothed KAMA modified according to the direction of the trend. The outer bars represent two linear regression lines drawn above and below the center l
FREE
Our modernized version of the popular channel TMA_TRUE  indicator for MT4, which provides information on the main points of trend reversal and momentum exhaustion by drawing a channel on the chart, also draws arrows of signals for buy and sell. As a result, traders can identify bullish and bearish price reversal zones and BUY and SELL accordingly. This indicator works well on all instruments and on all Timeframes. This indicator is the basis of our Channel Trigger EA, which you can buy in MQL
FREE
Regression_Channel_mod Indicator that expands our standard linear regression channel by adding support and resistance lines. Easy to integrate into other indicators. The linear regression channel consists of several parallel lines equidistant from the upper and lower part of the linear regression trend line. The distance between the channel boundaries and the regression line is equal to the deviation of the maximum closing price from the regression line.
The TrendChannelTracker Indicator is an innovative Forex trading tool. This indicator, which is based on the standard Stochastic Oscillator, provides traders with a unique and simplified method for observing market trends. In contrast to the traditional Stochastic Oscillator, which is shown at the bottom of the chart, the TrendChannelTracker Indicator is built into the price action itself. This removes the need for traders to continually switch their attention between the oscillator and the pri
FREE
The TrendOscillator Indicator is an upgraded version of the traditional Stochastic Oscillator.   It comprises two lines: %K and %D.   The %K line represents the current market position.   In contrast, the %D line is a moving average of the %K line used to generate signals and identify potential entry or exit points. The good thing is the indicator works on all timeframes like the traditional Stochastic.   However, to avoid any false signals, applying the indicator on longer timeframes is better
FREE
The TMA Centered Bands indicator for MT4 draws bands on the chart and reports the overall price trend, as well as gives arrows signals to buy and sell when the bar closes outside the channel. Unlike many TMAs, our version uses the calculation part of the algorithm without redrawing, and also adds the ability to select a symbol. The bands are made up of moving averages, and each of them has an MA period. The name TMA comes from triangular moving averages, as the indicator draws triangular bands
FREE
The BandsFill Indicator is a modified Bollinger Bands with a colored cloud.   It has two adjustable parameters: Period Deviation The cloud is colored as follows: If the price crosses the upper band, the cloud is blue. If the price crosses the lower band, the cloud is pink.   Thanks to this, the BandsFill Indicator provides traders with an easy opportunity to detect various features and patterns in price dynamics that are invisible to the naked eye. Based on this information, traders can predict
FREE
The Forex Gangster Indicator allows you to determine the current trend. If the Forex Gangster Indicator line has moved below the price and turned blue, then you should open deals for an increase. If the Forex Gangster Indicator line has appeared above the price and turned red, then you should open deals for a decrease: The indicator is suitable for any time frames, but it needs to be supplemented with filtering indicators, since by itself it is late and does not have time to give an accurate si
FREE
Moving Averages Divergence 3x3    Indicator     uses the crossover technique for signaling the market trend and the trade opportunities as well.     It applies 3 formats of the same indicator and allows them to plot the crossover signals which are interpreted as the trade signals along with the direction of the market trend. Moving Averages Divergence 3x3    Indicator   can be applied to trade all kinds of forex currency pairs within the financial markets.  Although, this indicator works well o
FREE
The Teamtrader Channel Stop indicator allows you to determine the current trend. If the Teamtrader Channel Stop indicator line has moved below the price and turned blue, then you should open deals for an increase. If the Teamtrader Channel Stop indicator line has appeared above the price and turned red, then you should open deals for a decrease: The indicator is suitable for any time frames, but it needs to be supplemented with filtering indicators, since by itself it is late and does not have
FREE
This indicator works by plotting fractals on the chart as arrows that can be used as buy or sell signals. It is a great tool for both new and experienced traders as it provides a clear visual representation of the market and helps traders identify fractals. Although it repaints, it can be used quite effectively in conjunction with other tools to filter trading strategies. We use this indicator in this way in our RoyalFractals II Expert Advisor, which you can purchase on the MQL5 Market: https:
FREE
This indicator works by plotting fractals on the chart as arrows that can be used as buy or sell signals. It is a great tool for both new and experienced traders as it provides a clear visual representation of the market and helps traders identify fractals. Although it repaints, it can be used quite effectively in conjunction with other tools to filter trading strategies. We use this indicator in this way in our Royal Fractals EA, which you can purchase on the MQL5 Market: https://www.mql5.com
FREE
The Red Dragons Support and Resistance Levels indicator automatically determines support and resistance levels using the proprietary algorithm based on historical and current data, so the levels are dynamic, which allows you to adjust trading targets based on the current price movement. For this reason, we use this indicator in our advisors, for example, Red Dragons, which you can purchase here: https://www.mql5.com/en/market/product/128713?source=Site +Market+MT4+New+Rating006 The panel also
FREE
Forex Gangster PRT
Irina Cherkashina
FOREX GANGSTER is a unique Expert Advisor created by a professional prop trader and financial asset manager with many years of experience. This is a solution for those who strive for stable profits without constant control over each transaction or monitoring the work of a trading advisor. Created for optimal conservative trading and investing through exchange instruments with long-term regular profits and minimal risks. The Expert Advisor algorithm is based on a deep understanding of market pat
The Wolf Wave Finder Indicator is a popular indicator, that is useful in identifying potential trading opportunities.   The indicator works by recognizing the Wolf Wave pattern, which is a well-known pattern used by professional traders to identify potential areas of support and resistance.   The indicator is easy to use and provides traders with an easy way to identify potential trades.   The Wolf Wave Finder Indicator is a great tool for traders who are looking for a reliable and accurate way
Fibo Parabolic PRT
Irina Cherkashina
This indicator is a fusion of the Parabolic SAR and Fibonacci indicators. Fibo is drawn on the last wave, at the peaks the indicator displays prices for convenience. Parabolic SAR helps to define the market trend and generates trends following trade signals.     On the other hand, Fibonacci plots the price retracement levels so that traders can determine a better and safer place to enter the market. Scalping with Parabolic SAR and Fibonacci Overview. For this strategy, in addition to our indica
This is an easy-to-set-up and easy-to-use Expert Advisor that will help you always have the necessary information about your trading account at hand, sending from MetaTrader 4 to you in Telegram: • Account drawdown • Number of open positions • Volume of open positions • Profit per day, week, month How to get an chat ID: - Chat with BotFather to create Bot and get API Token of Bot. If you had Bot, skip the step. - Chat with bot @userinfobot , then the bot will reply your ID. How to set
Symbol Manager PRT
Irina Cherkashina
The SYMBOL MANAGER symbol change indicator is an effective tool designed to enhance trading convenience and significantly simplify the trader's experience. This indicator allows users to switch seamlessly between currency pairs and timeframes within a single open window of the trading terminal. Importantly, when switching, the associated template, including indicators and current chart settings, is automatically duplicated, ensuring a consistent trading environment.
晨星 PRT 指標採用早盤持平突破原理。此指標顯示早晨持平水平並顯示可能的目標。 指標中增加了額外的斐波那契水平,以及有關設定中指定的目標水平與夜間持平水平相交的聲音警報。 晨星 PRT 指標在夜間結束時建造了一個夜間平坦通道,以及兩個向上和向下的斐波那契價格水準。這些水平可以被視為目標水平和逆轉水平。 晨星 PRT 指標適用於所有時間範圍,但在 M15 間隔上使用它最有效。 The Morning Star PRT indicator uses the morning flat breakout principle. The indicator displays morning flat levels and shows possible targets. An additional Fibonacci level has been added to the indicator, as well as sound alerts about the intersection of both target levels specified in the settings and
指標供給和需求區域 PRT – 是一種自訂工具,用於執行圖表的供給和需求區域標記。此指標在圖表上繪製線條和矩形,突出顯示阻力/支撐位和供需區域。為了方便起見,線條和圖形都塗上了不同的顏色,以便輕鬆區分彼此的訊號。它非常適合初學者和經驗豐富的交易者。 此指標用於倒賣、趨勢、反趨勢和其他交易系統。這是一種通用演算法,可以輕鬆成為任何策略的一部分。它在所有時間框架和工具上都表現良好,並且與振盪器完美結合。 Indicator Supply & Demand zones PRT– is a custom tool that is used to perform supply and demand zones marking of the chart. The indicator draws lines and rectangles on the chart that highlight resistance/support levels and supply/demand zones. For convenience, both lines and figures are painted i
Pattern Master PRT
Irina Cherkashina
對於希望識別圖表模式的交易者來說,該指標是一個強大的工具,將其納入交易策略的好處有很多。該工具有效識別並發出金融市場潛在趨勢和逆轉訊號,從而提高交易獲利能力。由於其先進的演算法,該指標可以準確分析市場數據,為交易者提供有價值的信息,幫助他們做出明智的決策。使用該指標可以對市場進行更全面的分析,因為它可以自動識別高精度的圖表模式。這些模式通常表示特定方向的潛在價格變動。因此,與其他可能無法識別這些模式或理解其含義的市場參與者相比,存取這些資訊使交易者俱有優勢。 此指標擁有廣泛的看漲和看跌模式識別功能(圖表上的縮寫名稱在括號中給出): - 新星(SS); - 晚星(E_Star); - 黃昏十字星 (E_Doji); - 烏雲蓋頂(DCC); - 看跌吞沒(S_E); - 看漲錘子(HMR); - 晨星(M_Star); - 早晨十字星(M_Doji); - 交叉線(P_L); - 看漲交叉 (L_E); 使用此工具時,交易心理學也發揮著重要作用,因為它可以幫助交易者在根據這些已識別的模式進行交易時保持紀律。如果交易者看到看漲模式,但由於擔心失去利潤,情緒導致他們
Elliot Waves Tracker
Irina Cherkashina
This universal expert advisor is based on our own Algorithm, which is based on effective and time-tested Elliot Wave Theory.  This   expert advisor   is ideal for working both on a flat and during sharp or protracted trend movements (thanks to the Martingale method, according to which averaging positions are opened in accordance with the multiplier and distance set in the settings for accepting a new signal). ATTENTION! CAREFULLY STUDY THE OPERATING PRINCIPLE AND AVAILABLE SETTINGS OF THE EXPER
This is the automatic price spike signal indicator for MT4. Plots advance alerts on potential breakouts/pullbacks. Suits forex, stocks & crypto trading strategies. This is a perfect indicator for reversal traders. A spike often indicates a turn-around moment. The best way to use that gauge is to apply it to your favourite trading system as a filter. 這是 MT4 的自動價格飆升訊號指示器。繪製有關潛在突破/回調的預先警報。適合外匯、股票和加密貨幣交易策略。 對於反轉交易者來說,這是一個完美的指標。尖峰通常表示轉變時刻。使用該指標的最佳方法是將其作為過濾器應用到您最喜歡的交易系統中
拋物線轉向指標和支撐/阻力位不僅是外匯交易中用於識別潛在趨勢反轉和進入點和退出點的技術分析指標,而且還是一種現成的自主交易策略。 此指標以 PSAR 指標為基礎,在圖表中添加了動態支撐位和阻力位,這可以幫助交易者識別市場可能逆轉的關鍵價格水準。使用該指標,交易者可以深入了解市場的強度和方向,以及交易的潛在進入和退出點。 拋物線轉向指標和支撐/阻力位指標是一種技術分析工具,可在圖表上繪製各種拋物線支撐和阻力 (PSAR) 水平,為交易者提供潛在的趨勢反轉訊號。該指標在 MT4 主圖表視窗中顯示為一系列水平對齊的線,使交易者可以輕鬆識別實際的 PSAR 水平。它還可用於追蹤停損並根據一致的邏輯繪製支撐位和阻力位,從而允許交易者使用他們最喜歡的指標針對水平來尋找交易。儘管眾所周知該指標會重新繪製,但它仍然提供良好的準確性,並且可以用作獨立的外匯指標和交易策略。 以下是在外匯交易中使用拋物線轉向指標和支撐/阻力位指標的簡單策略: • 確定趨勢方向:第一步是使用指標來確定整體趨勢方向。 • 如果 PSAR 點位於價格條下方,則表示上升趨勢,而如果它們位於價格條上方,則表示下降趨勢。 •
All Market Channels
Irina Cherkashina
The All Market Channels indicator from ProfRobotrading automatically builds and displays all formed trading channels on the screen. This indicator is very convenient for trading on all existing channel strategies and is applicable to all instruments and timeframes.  Look at the screenshot - it will tell you more :) More information is available on our website ProfRoboTrading. ProfRobotrading 的所有市場通道指標會自動建置並在螢幕上顯示所有已形成的交易通道。此指標對於所有現有通道策略的交易非常方便,並且適用於所有工具和時間範圍。 查看螢幕截圖 - 它會告訴您更多:) 更多資訊請造訪我們的網站
筛选:
无评论
回复评论