Supply and Demand zones PRT
- 指标
-
Irina Cherkashina
 I have been actively trading, including with the help of my own expert advisors, on financial markets since April 2012. In addition to trading with my own money, I work as a technical analyst in a mutual fund. In my free time, I like to go to live music concerts, travel, and hang out with friends.
 - 版本: 1.0
- 激活: 5
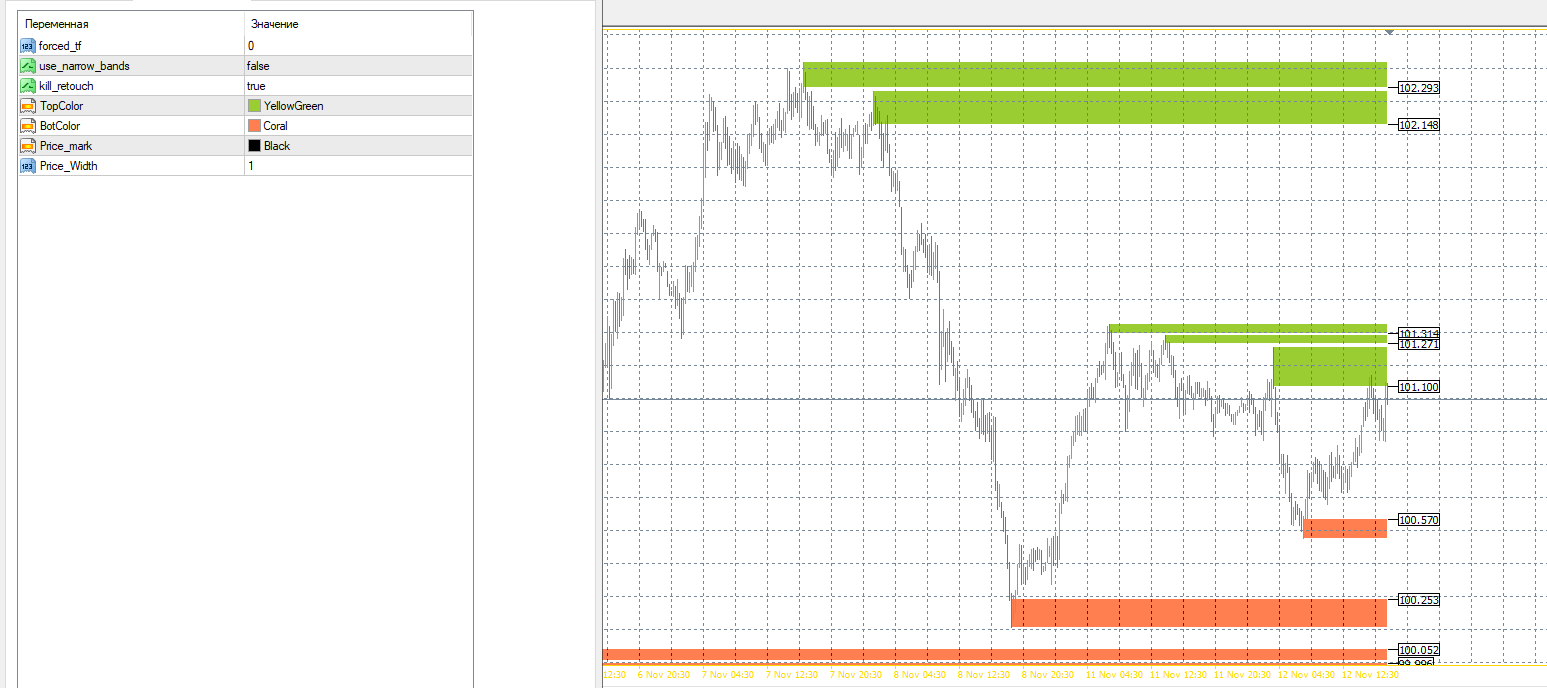
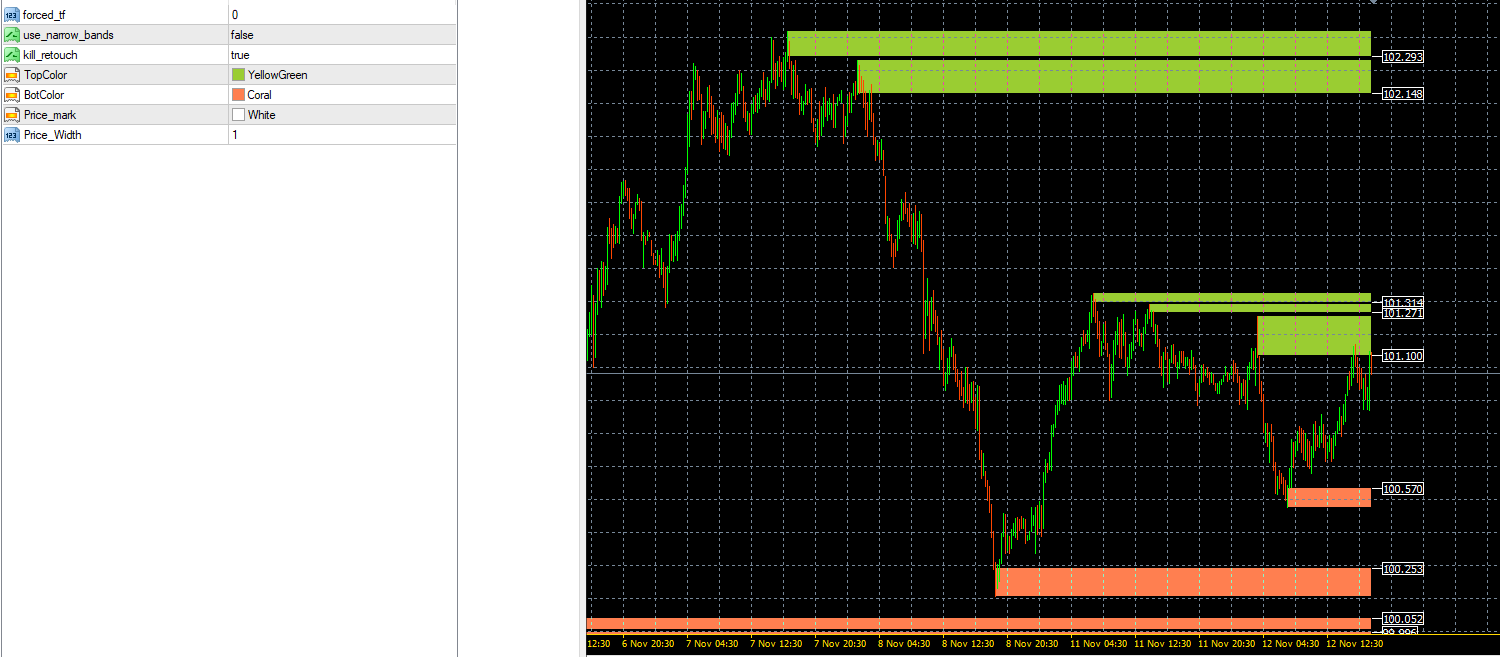
指標供給和需求區域 PRT – 是一種自訂工具,用於執行圖表的供給和需求區域標記。此指標在圖表上繪製線條和矩形,突出顯示阻力/支撐位和供需區域。為了方便起見,線條和圖形都塗上了不同的顏色,以便輕鬆區分彼此的訊號。它非常適合初學者和經驗豐富的交易者。
此指標用於倒賣、趨勢、反趨勢和其他交易系統。這是一種通用演算法,可以輕鬆成為任何策略的一部分。它在所有時間框架和工具上都表現良好,並且與振盪器完美結合。
Indicator Supply & Demand zones PRT– is a custom tool that is used to perform supply and demand zones marking of the chart. The indicator draws lines and rectangles on the chart that highlight resistance/support levels and supply/demand zones. For convenience, both lines and figures are painted in different colors so that the signals are easily distinguished from each other.The indicator draws only fresh levels, that is, those that have not yet been used and the price has not yet broken through them. It is perfect for both beginners and experienced traders.
The indicator is used in scalping, trend, counter-trend and other trading systems. This is a universal algorithm that can easily become part of any strategy. It shows well on all Time Frames and instruments, and combines well with oscillators.