Frontier Pivots

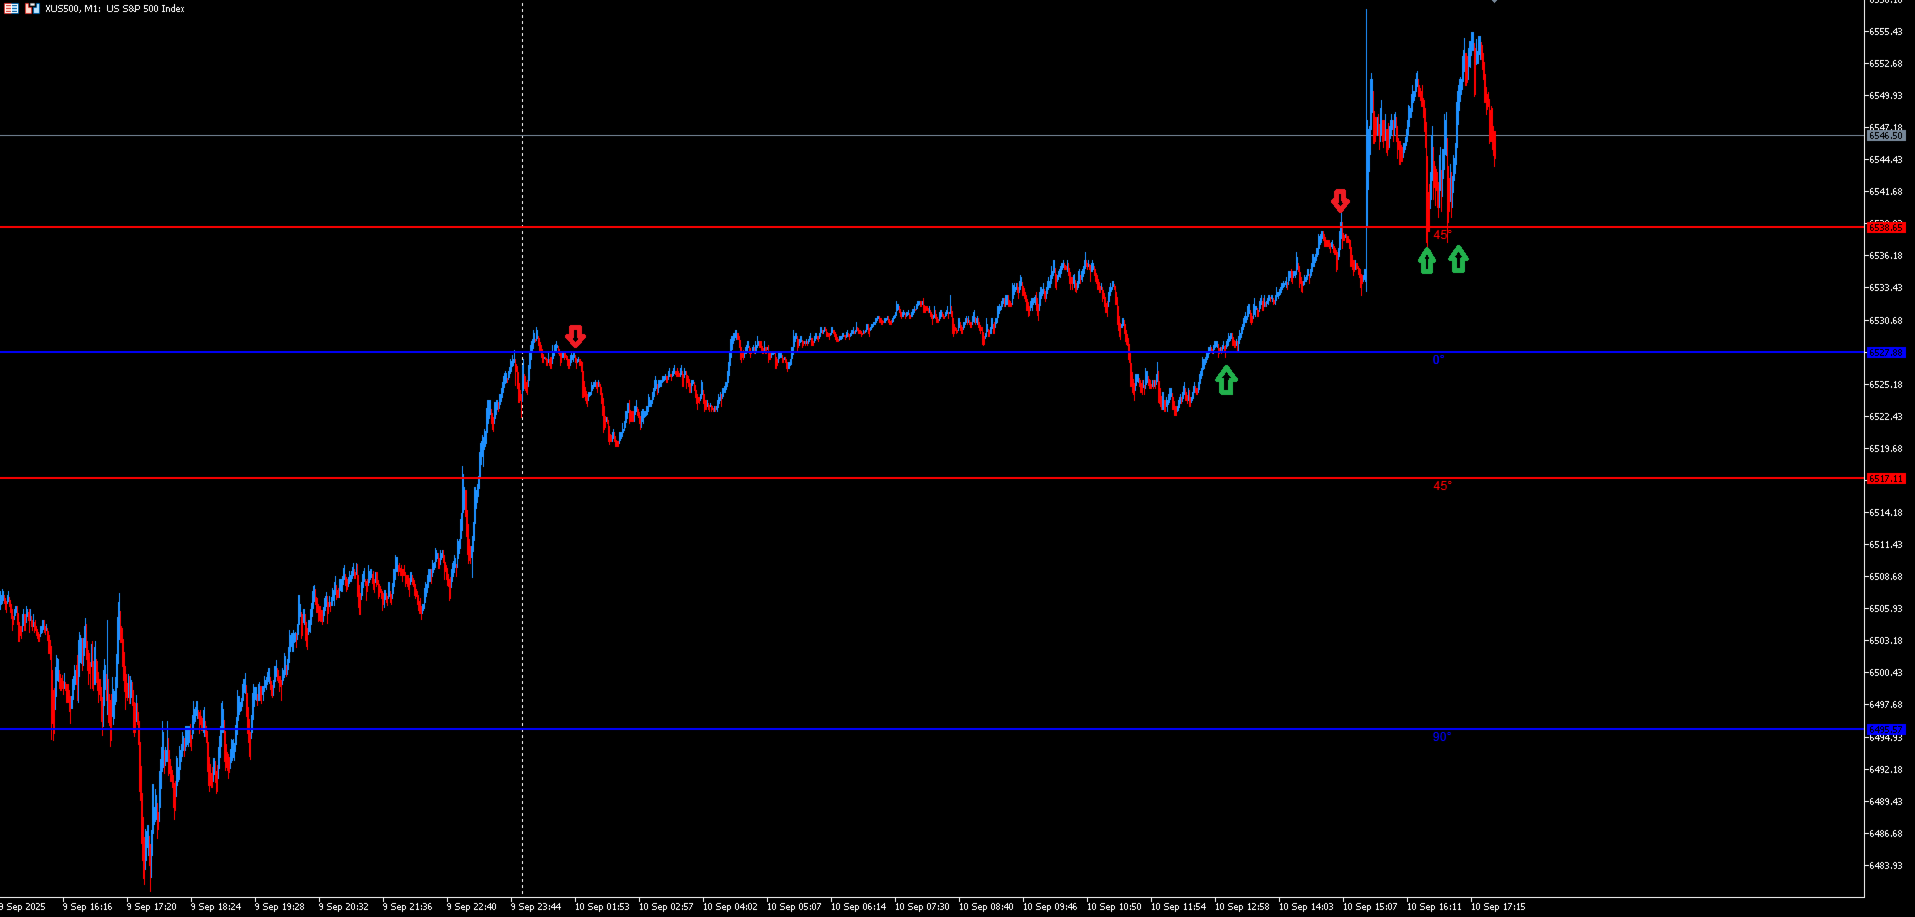
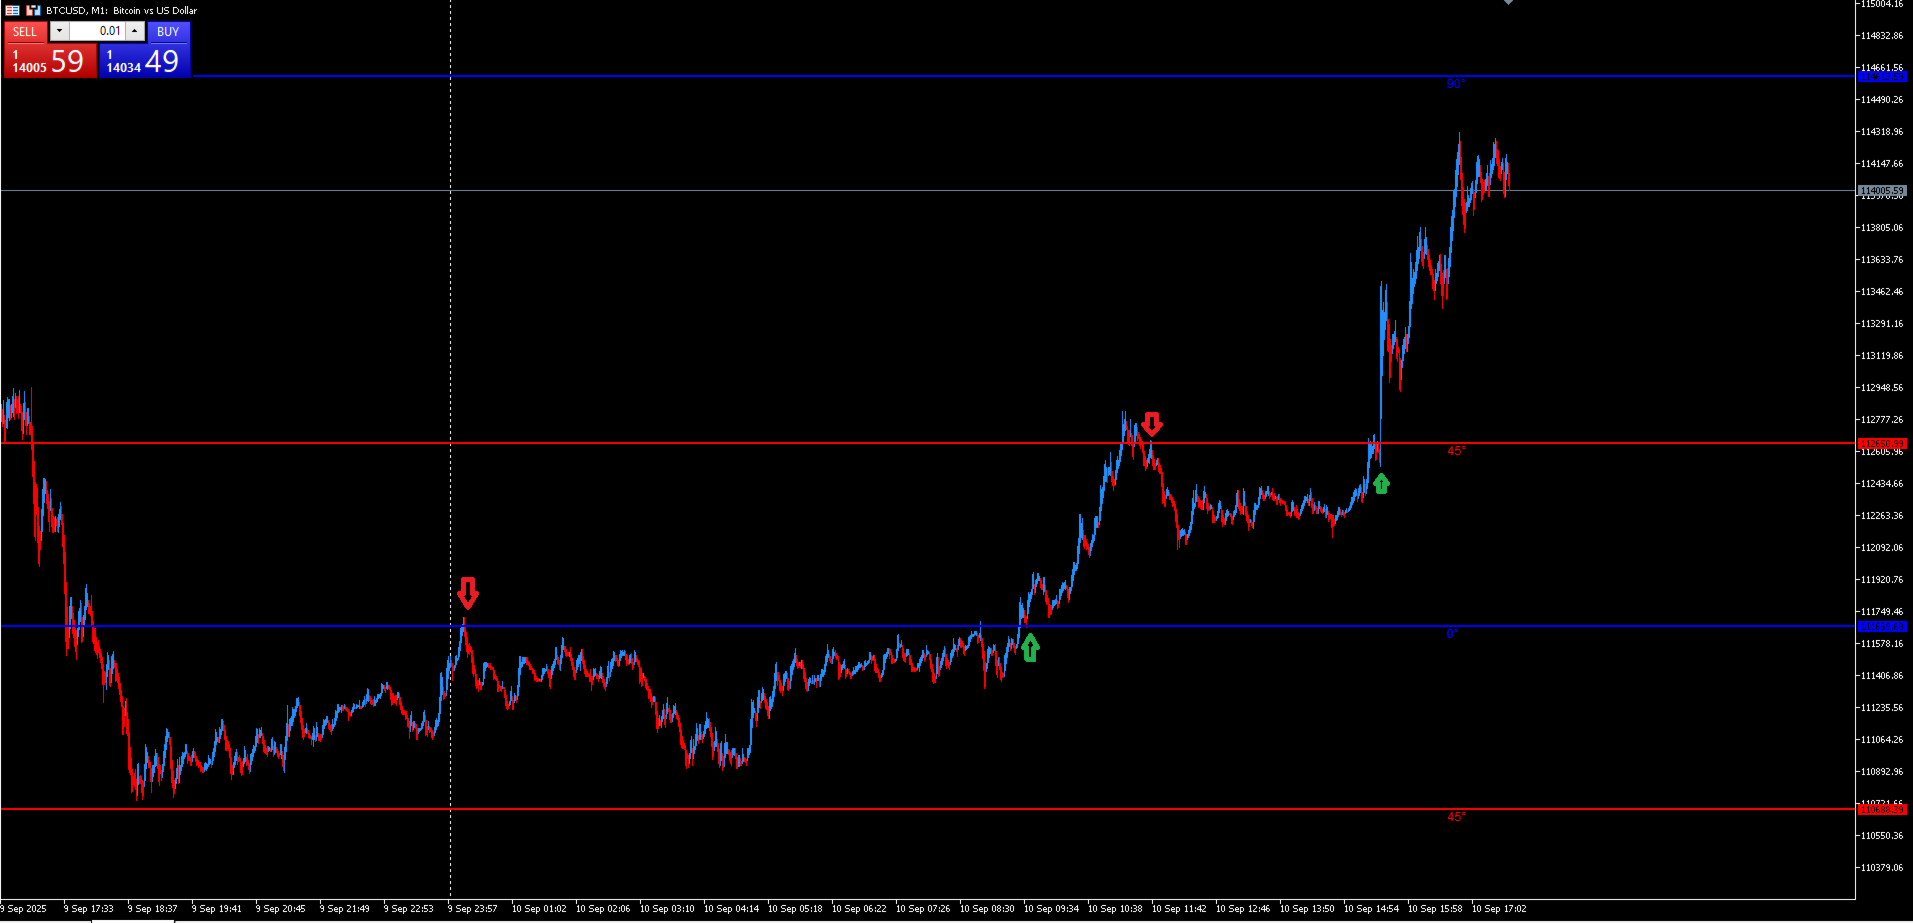
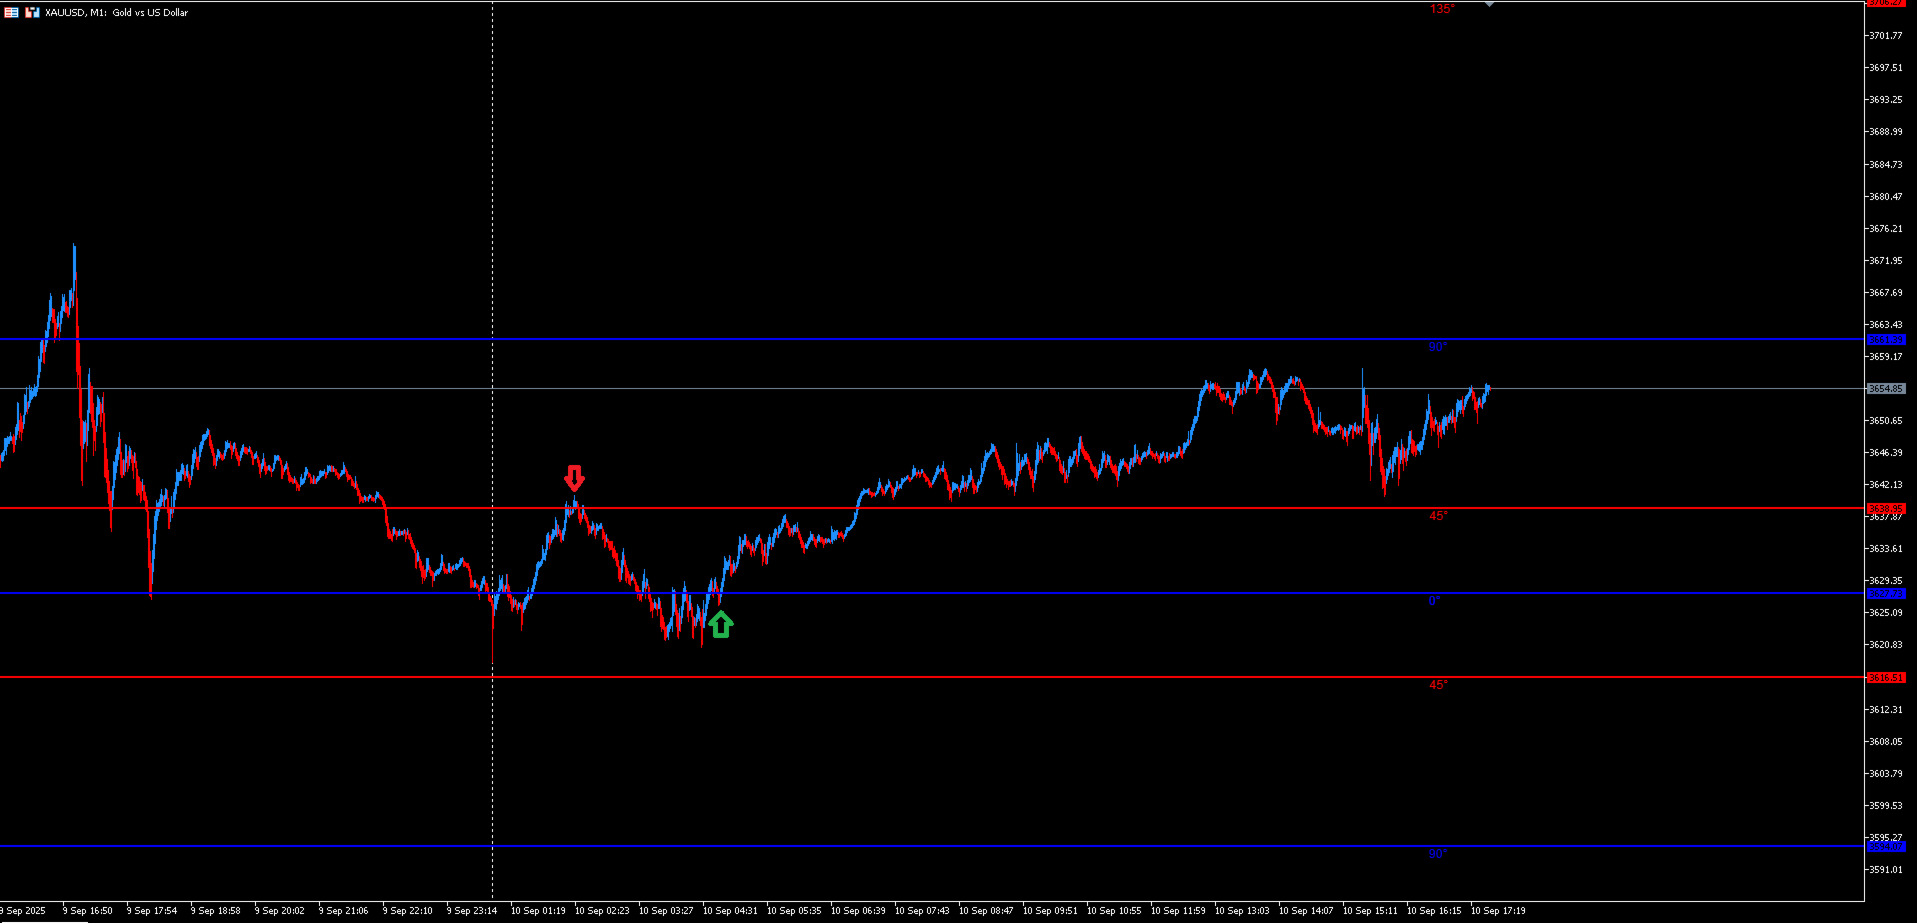
FRONTIER PIVOTS - Geometric Levels Indicator

This indicator plots support and resistance levels/ranges on the chart using mathematical calculations. It helps traders identify potential price reaction zones based on geometric patterns.

Main Features:

  • Automatically calculates and displays key price levels

  • Plots both support and resistance lines

  • Uses daily price data for level calculation

  • Clean visual presentation with different colors for different level types

  • No repainting - levels remain static once calculated

Input Parameters:

  • Trading Timeframe: Timeframe for level calculation (recommended: M1 or M5)

  • Level Colors: Customize colors for different angle types

  • Line Style: Adjust line thickness and style for better visibility

Advantages:

  • Provides visual reference points for potential support and resistance

  • Helps identify price zones where market may react

  • Works on any financial instrument

  • Easy to use with minimal configuration required

  • Lightweight and doesn't slow down the trading platform

How to Use:

  1. Apply the indicator to any chart

  2. Levels will automatically calculate and display

  3. Observe price behavior around the plotted levels

  4. Use in conjunction with other analysis techniques

Note: This tool should be used as part of a comprehensive trading plan and not as the sole basis for trading decisions. Therefore, by itself, it does not guarantee specific investment results or profitability. Trading involves a significant risk of loss, and the user assumes full responsibility for their operational decisions. It is recommended to thoroughly test the tool on a demo account before considering its use in real trading.


推荐产品
Manyal trading system, CovEchoTrend Robot, focuses on reliability and flexibility. By employing statistical analysis methods to study the relationships between the base indicator and market patterns, the system enables a deeper understanding of market processes. Intelligent pattern analysis: The application of statistical data processing helps identify key trend reversal points more accurately, signaling significant market shifts. Informed decision-making is based on the intersection of indicato
Linha de Variacao de Preco
Renato Fabio Santos Vasconcelos
ENGLISH VERSION PRICE VARIATION LINE – TAKE CONTROL OF THE MARKET! Turn the opening price into your strategic weapon Clearly see how many points or % the market moved Auto horizontal lines at the levels YOU define Mark entry, exit, target zones and explosive regions Clean, sharp, and professional layout Simple, powerful, and essential for any serious trader
Limitless MT5
Dmitriy Kashevich
Limitless MT5 is a universal indicator suitable for every beginner and experienced trader. works on all currency pairs, cryptocurrencies, raw stocks Limitless MT5 - already configured and does not require additional configuration And now the main thing Why Limitless MT5? 1 complete lack of redrawing 2 two years of testing by the best specialists in trading 3 the accuracy of correct signals exceeds 80% 4 performed well in trading during news releases Trading rules 1 buy signal - the ap
这是一个mt5版本的强大的多周期、多货币对、多指标监控指标工具,主要功能包括: 1.监控多种指标实时情况,可监控的指标包括RSI、MACD、MA和STO。 2.监控多种货币对, 可 自定义 添加或者删除货币对,指标自动更新。 3.监控各货币对多个周期。 4.点击后可直接切换到需要查看的图表和周期。 5.点击监控模式按钮可自由切换需要监控的指标类型:包括RSI模式,MACD模式,MA模式和STO模式。 1)RSI模式:RSI数值超过60显示红色,低于40显色蓝色;超过70和低于30显色超买超卖颜色。 2) MACD模式: DIF> DEA时,显示上涨趋势; DIF<   DEA时,显示下跌趋势。 3)   MA模式: MA小周期 >   MA大周期时,显示上涨趋势;  MA小周期<   MA大周期时, 显示下跌趋势。 4)STO模式: %D>K线时, 显示上涨趋势; %D<K线时,   显示下跌趋势。
CoioteChart
Alexandre Moraes De Souza Lima
O Indicador CoioteChart foi construído pra facilitar desde a leitura de contexto de mercado até a micro estrutura do candle, facilitando ajustes operacionais e tomadas e decisão com alta eficácia. Possui um controle para habilitar e desabilitar a visualização das pocs, vwap, zonas de máxima e mínima negociação, pode ser utilizado data sources de tempos gráficos para cálculos ou utilizado os ticks de agressão do time and trades, funciona com volume real e volume de ticks. As colorações são atrib
賺錢和研究的工具。 交易信號和策略的核心是基於作者的價格預測模式形成算法。適用於任何樂器!輔以基於 MA "九尾狐" 的控制系統,盡可能準確地更新和調整市場、儀器和工作期間的信號。 合格:所有市場中的所有工具(有例外)。 適用對象:對沖基金、基金和資產經理、投資經理、投機者、投資者和利益相關者。 ..................................................................................................................................................................................
My Trendline
Ashok Kumar Singha
My Trendline is an Indicator based on Upper and Lower Trendline which will Plot Automatically into the Chart. This Indicator will perfectly indicate you the Trend of the Market. It can be use in any Time Frame. The Indicator will automatically adjust according to the Current Time Frame. Steps to Setup the Indicator: Install the Custom Indicator; Set all the Inputs, Line Color, Width and Styles etc. (Can use the Default Setting also); Set visualization to All Timeframe; and DONE It can
Orderflow Scalp Pro
TitanScalper
5 (1)
Orderflow Scalp Pro v2.4   delivers institutional-grade trading intelligence through advanced volume analysis, dynamic VWAP calculations, real-time aggressive score monitoring, and precision arrow signals. This complete trading system transforms complex market data into clear, actionable signals for consistent profitability on 3-4 minute timeframes. Full Documentation: [Download PDF] Four Powerful Components in One System Volume Profile HeatMap with POC/VAH/VAL Transform your charts into inst
MarketMagnet
Kelly Adediran Raymond
Are you ready to take your trading journey to new heights? Look no further than MarketMagnet, this groundbreaking indicator designed to propel your trading success with excitement and accuracy. Powered by the convergence of Momentum and CCI (Commodity Channel Index), MarketMagnet equips traders with the ultimate tool to determine direction and entry prices for a wide range of recommended currency pairs and instruments. It is designed for traders seeking to scalp for a few pips on lower timeframe
Projection of Phi
Nestor Jose Mendez Boza
Projection of Phi   Is a technical indicator that calculates dynamic support and resistance levels. It uses angular geometric projections and mathematical ratios to identify market expansion ranges. Features: Dynamic Fibonacci Expansion: Extension level projection Geometric Calculation: Angular analysis and mathematical ratios Visualization: Graphical objects with informative labels Compatibility: M1 to H4 timeframes Applications: Identification of zones for trade management Analysis of volatil
QXS Market Scanner
Netlux Digital Kft.
QuantXMarketScanner is a multi assets indicator for MT5 - Mathematical model based on 7 custom moving averages indicators  - Adaptable on Currencies, Stocks and Crypto - Automatic setup, self optimized About QuantXsystem Products: –         Simple installation & integration into MT5   –         Unlimited License after purchase (for one user) –         Automatic pattern recognition to identify the best timing and price levels. –         Trading indicators are displayed directly and automaticall
IndiceXperience
Mateus Silva Marques Dos Santos
Indicador para mercado de Índice Futuro Brasileiro (WIN) __________________________________________________________________________________________________ O indicador trabalha com rompimento de canal indicando o sentido do movimento e os 3 possíveis TP e o SL baseado no ATR. Indicação de utilização em TimeFrame de 5M, mas pode ser utilizado em qualquer tempo gráfico de sua preferencia. __________________________________________________________________________________________________
Turn your chart into a professional trading dashboard that shows where price is flowing and when the next shock is coming —without loading a single extra window. This indicator combines a price-following MA ribbon with a live news radar directly on the chart, giving you both trend and event risk in one glance. Trend Ribbon – Read the market bias instantly A smooth, step-style moving average ribbon follows price action bar by bar. Color change shows the active trend: aqua for bullish flow , gold
LuxFibo Matrix
Marius Ovidiu Sunzuiana
LuxFibo Matrix Where Golden Geometry Meets Market Mastery LuxFibo Matrix is a cutting‑edge Fibonacci‑driven market intelligence system designed for traders who demand precision, elegance, and an edge. Built on the timeless golden ratio and enhanced with proprietary adaptive algorithms, LuxFibo Matrix goes beyond standard retracements — mapping complex Fibonacci price structures into a seamless matrix of opportunities. Its core technology fuses advanced volatility filters, multi‑timeframe patt
The Plasma Trend indicator is a simple technical indication that is used to determine the current trend direction in the market. The Plasma Trend indicator is a powerful tool for determining the direction of the trend in the Forex market. It is based on both standard technical indicators and proprietary mathematical calculations, which provides a more accurate and reliable trend determination. Its implementation in the form of lines of two colors simplifies the visual determination of a change
Volume Equilibrium 指标显示多头成交量与空头成交量相等的位置。它可以分别计算每日、每周、每月和每年的这些水平。 当市场价格位于该线之上时,说明多头成交量更大,市场处于多头区域。 当市场价格位于该线之下时,说明空头成交量更大,市场处于空头区域。 该指标使用 “Meravith” 指标算法来计算这些水平。成交量水平计算非常精确。指标自动工作,可用于任何时间周期。 每条线都有按钮,您可以选择显示哪些成交量平衡水平。还有一个按钮可以显示或隐藏整个指标。 为了获得更准确的结果,建议使用拥有大量客户的知名经纪商,因为经纪商只显示来自其自身客户的成交量。 Volume Equilibrium 指标显示多头成交量与空头成交量相等的位置。它可以分别计算每日、每周、每月和每年的这些水平。 当市场价格位于该线之上时,说明多头成交量更大,市场处于多头区域。 当市场价格位于该线之下时,说明空头成交量更大,市场处于空头区域。 该指标使用 “Meravith” 指标算法来计算这些水平。成交量水平计算非常精确。指标自动工作,可用于任何时间周期。 每条线都有按钮,您可以选择显示哪些成交量平衡水平。还有
CombinerPRO 是一款为 MetaTrader 5 设计的高级指标,专为交易二元期权、OTC 市场、合成资产、加密货币和外汇市场的交易者打造。它通过结合多个技术过滤器生成精准的 CALL 与 PUT 信号,并支持外部指标集成以增强策略协同。结合实时统计面板和回测能力, CombinerPRO 帮助交易者优化操作策略。 主要功能 ️ 多重过滤信号生成: 结合均线、RSI、ADX、ATR 与 K线大小过滤器,生成高精度的 CALL 与 PUT 信号。 ️ 支持外部指标: 可通过 iCustom 集成最多两个自定义指标,打造个性化交易策略。 ️ 实时统计面板: 显示胜率、失败次数以及多达六级马丁策略的有效性。 ️ 历史回测功能: 可回测用户指定数量的K线,评估策略的有效性。 ️ 交易间隔控制: 自定义每次交易之间的最小时间间隔,防止过度交易。 ️ 多市场兼容: 适用于 OTC、合成市场(如 Deriv)、加密货币及外汇交易。 ️ 可配置提醒功能: 支持弹窗、声音与通知提醒,确保信号不被错过。 设置选项 ️ 均线过滤器: 启用/禁用,设置周期、偏移、方法与应用价格。
-         What it does? Opens BUY (or SELL) orders automatically every X pips you decide. Closes each trade at your personal TP .  Works on any symbol: SP500, NAS100, GOLD, EURUSD, BTC... 100 % YOUR SETTINGS   What can you enter in the settings? - Trading direction: Buy or Sell - Entry level - Entry volume - Maximum number of buy orders - Maximum number of sell orders - Pips required for each new entry - Pips to take profit per trade - Stop Loss Level - Close all trades when SL level is hit Exam
Dyne
Fernando Souza Mendes
This isn't just an indicator; it's a top-tier market analysis tool that combines the power of various technical analysis techniques into one package. Perfect for traders seeking precision and clarity in their trading decisions. Key Features: HiLo Activator: Easily capture the essence of market trends. This component differentiates between bullish or bearish markets, helping you to be on the right side of the move. MACD (Moving Average Convergence Divergence): Quickly identify changes in market
Классификатор силы тренда. Показания на истории не меняет. Изменяется классификация только незакрытого бара. По идее подобен полной системе ASCTrend, сигнальный модуль которой, точнее его аппроксимация в несколько "урезанном" виде, есть в свободном доступе, а также в терминале как сигнальный индикатор SilverTrend . Точной копией системы ASCTrend не является. Работает на всех инструментах и всех временных диапазонах. Индикатор использует несколько некоррелируемых между собой алгоритмов для класси
Price Action Scanner Pro 是一款识别价格行为并给予提醒的指标 , 它比 Price Action Scanner 能提供更多的功能与配置 . 这款指标可以同时检测最多15个品种 , 不同时间周期的信号 . 你可以分别设置亚盘时间 , 欧盘时间 , 美盘时间 , 检测的时间周期 , 这样就能在交易频繁的时段使用小级别的信号来判断入场时机 , 在交易不频繁的时段使用较大级别的信号来判断入场时机 . 通过设置分隔符 , 来添加不同的品种名称 , 不同的时间周期 .  指标可以设定检测多种常见信号种类 , 有 Pinbar , 吞没形态 , 孕线形态 , 启明星 , 黄昏之星 , Fakey , 在单独的副图里面显示出对应的信息 , 并提示出信号的方向 . 你可以点击对应的 Open Chart 按钮 , 显示出这个品种的 chart , 便于更好的观察 . 你也可以设置每种信号的颜色 , 显示的大小 .  在显示方面 , 也做了升级 . 你可以根据屏幕分辨率的大小 , 选择显示两列 , 三列 , 还是四列内容 , 同时可以调整显示的字体大小 . 信号已经对趋势进行了
RAD Real Acummulation and Distribution
Jose Alejandro Jacome Jimenez
RAD CRITICAL LEVES RAD indicator tracks “Relevant Volume” in real time, identifying accumulation and distribution processes, projecting them in the chart as SUPPORT or RESISTANCE zones. Natural   support   and resistance levels are generated by Volume Accumulation and Distribution processes. As these processes evolve, levels at which the relevant volume in the market place is positioned, become difficult areas to cross upwards or downwards. By using this information, traders can identify very s
1.7*24小时全时在线,安全,可靠,低延时ping; 2.按券商要求智能跟单,详见英文简介   3.本系统仅提供跟单软件服务,不提供交易策略,不代单操作; 4.不限交易手数,客户自行设置A仓手机app端即可,不额外收费 5.客户可按月,季,年付费方式,不同方式,不同优惠,先付费后使用; 6.因券商MT5服务器异常,导致断网后跟单异常,客户需自行风控处理,本系统不提供风控处理 7.券商下单规则改变,会自动更新最新跟单系统 8.详细购买流程,请咨询  wehcat  :zfflyer; 9.再次强调,本系统,仅保障以技术层面实现跟单功能,不参与客户的下单,交易策略,以及风控措施。 10.本系统已稳定运行9个月,经历各种复杂行情考验,稳定,可靠
Ugenesys AI MT5
Odaine Ramon Mcmillan
uGenesys AI - 90% Accurate Daytrading Indicator Introducing the ultimate forex trading indicator system, uGenesys AI, powered by cutting-edge AI technology and advanced analytical techniques, including Time-Series Analysis and Genetic Algorithms. Our AI-powered trading system leverages the power of time-series analysis to identify trends and patterns in historical price data, allowing traders to make informed predictions about future market movements. By analyzing vast amounts of data, our syst
秒级Tick蜡烛图生成器 是一款专为高频交易和短线炒单设计的专业级MT5指标工具。它能够将原始Tick数据实时转换为高度可定制的秒级K线图,帮助交易者精准捕捉市场微观波动,优化入场和出场时机。该工具能为您提供清晰的图表展示,让您更直观地识别价格行为模式,提升交易决策效率。 核心功能亮点: 灵活的时间间隔设置:支持自定义秒级K线生成周期(如1秒、5秒、10秒等),适应不同交易策略需求,尤其适合超短线交易者。 真实的Tick数据还原:基于原始报价数据生成蜡烛图,确保数据准确性,避免因数据合成导致的信号失真。 实时买卖价显示:直接在图表上标注当前买价(Ask)和卖价(Bid),便于快速观察市场流动性及点差变化。 直观的视觉设计:采用清晰的蜡烛图配色(涨跌颜色区分)和专业的技术指标叠加,提升图表可读性。 适用场景: 高频交易(HFT):捕捉毫秒级价格变动,优化算法交易策略。 短线炒单(Scalping):快速进出场,利用微小波动获利。 为什么选择本产品? 传统分钟级或小时级图表无法满足超短线交易需求,而本工具填补了这一空白,让您能够像专业做市商一样,基于最精细的市场结构制定策略。无论是手动交易
Trigger Cash
Felipe Correa Carneiro
Nrha
Ratna Purwantari
This indicator uses Fibonacci to determine your trading levels precisely and measurably. It helps you to earn big profits. This indicator can also be used for various currency charts. You can also combine it with other indicators that you like so that the profits you get are also even greater. I hope you give me input so that this indicator can be better. We recommend using for the period M1 to M15. feel free to discuss with me. Thanks. 
QUANTUM OBSERVATION ENGINE Advanced Market Structure & Dominance Visualization Tool Quantum Observation Engine is a professional-grade, non-repainting market analysis indicator designed for traders who prefer clarity, structure, and decision control instead of direct buy/sell signals. This tool does NOT give forced trade entries. Instead, it reveals the internal state of the market in real time. WHAT THIS TOOL DOES Quantum Observation Engine con
FREE
TrendFusionXplorer consists of three powerful trend-analyzing indicators — TRP , PMax and OTT — developed by Kivanc Ozbilgic. Each indicator displays the trend's support and resistance levels based on its unique properties and methodology. TrendFusionXplorer assists in determining entry and exit points for markets and can also be used for setting trailing stop-loss (SL) and take-profit (TP) levels on open positions. Specifications 1. Trend Reversal Predictor (TRP): TRP follows Thomas R. DeMar
Introducing to your attention an innovative expert advisor created specifically for the most juicy and volatility    currency     basket: GBPUSD, XAUUSD and EURJPY. This system is designed using the main features of this market's movement, making it an ideal choice for dynamic trading on high-trending and medium-volatile pairs.   The signals are focused on minimizing trading risks, aiming to reduce losses to a minimum. Main features ESignals is designed to show open and close arrows at the beg
该产品的买家也购买
ARIPoint
Temirlan Kdyrkhan
ARIPoint is a powerful trading companion designed to generate high-probability entry signals with dynamic TP/SL/DP levels based on volatility. Built-in performance tracking shows win/loss stats, PP1/PP2 hits, and success rates all updated live. Key Features: Buy/Sell signals with adaptive volatility bands Real-time TP/SL/DP levels based on ATR Built-in MA Filter with optional ATR/StdDev volatility Performance stats panel (Success, Profit/Loss, PP1/PP2) Alerts via popup, sound, push, or email Cu
TrendMaestro5
Stefano Frisetti
note: this indicator is for METATRADER4, if you want the version for METATRADER5 this is the link:  https://www.mql5.com/it/market/product/108106 TRENDMAESTRO ver 2.5 TRENDMAESTRO recognizes a new TREND from the start, he never makes mistakes. The certainty of identifying a new TREND is priceless. DESCRIPTION TRENDMAESTRO identifies a new TREND in the bud, this indicator examines the volatility, volumes and momentum to identify the moment in which there is an explosion of one or more of these da
ARICoins
Temirlan Kdyrkhan
ARICoin is a powerful trading companion designed to generate high-probability entry signals with dynamic TP/SL/DP levels based on volatility. Built-in performance tracking shows win/loss stats, PP1/PP2 hits, and success rates all updated live. Key Features: Buy/Sell signals with adaptive volatility bands Real-time TP/SL/DP levels based on ATR Built-in MA Filter with optional ATR/StdDev volatility Performance stats panel (Success, Profit/Loss, PP1/PP2) Alerts via popup, sound, push, or email Cust
ARIScalping
Temirlan Kdyrkhan
ARIScalp is a powerful trading companion designed to generate high-probability entry signals with dynamic TP/SL/DP levels based on volatility. Built-in performance tracking shows win/loss stats, PP1/PP2 hits, and success rates all updated live. Key Features: Buy/Sell signals with adaptive volatility bands Real-time TP/SL/DP levels based on ATR Built-in MA Filter with optional ATR/StdDev volatility Performance stats panel (Success, Profit/Loss, PP1/PP2) Alerts via popup, sound, push, or email Cus
AriX
Temirlan Kdyrkhan
AriX Indicator for MT5 A powerful trend-following and signal-evaluation tool AriX is a custom MT5 indicator that combines Moving Averages and ATR-based risk/reward logic to generate clear buy/sell signals. It visualizes dynamic SL/TP levels, evaluates past trade outcomes, and displays win/loss statistics in a clean on-chart panel. Key features include: Buy/Sell signals based on MA crossovers ATR-based SL/TP1/TP2/TP3 levels with visual lines and labels Signal outcome tracking with real-time stat
IVISTscalp5
Vadym Zhukovskyi
5 (6)
我们向您介绍iVISTscalp5指标,它不仅独特,而且在交易操作中也非常有效。该指标基于时间数据,是多年金融市场经验和深入分析的结果。iVISTscalp5指标是手动交易的优秀工具。便利性、简单性和可视化 - 所有的复杂性都隐藏在内部。我们将iVISTscalp5指标的设置和使用简化到了最大程度。该指标适用于MT5终端中您所拥有的所有金融工具。 操作时间为UTC+3的早上4点到晚上8点。 iVISTscalp5指标菜单(见截图1): History - 计算行情的周数 dT_min - 选择时间间隔的时间(分钟) TFline - 绘制水平成交量(时间帧) BARSline - 绘制水平成交量(条数) TFtrend1 - 绘制日线通道(时间帧) BARStrend1 - 绘制日线通道(条数) TFtrend2 - 绘制周线通道(时间帧) BARStrend2 - 绘制周线通道(条数) ALERT_TIMER - 设置闹钟 ALERT - 开启/关闭闹钟 Save - 开启/关闭将时间记录到文本文件。 图表上的红色和蓝色旗帜表示时间(VIST智能剃须系统的信号)。卖出信号为红旗,买入
Rtc ML Ai Predictor
Muhammad Faisal Sagala
Rtc ML Ai | Predictor CORE MACHINE LEARNING ENGINE Adaptive ML Market Predictor – Multi-Bar Trend & Candle Forecast What This Indicator Does This indicator is a  real-time market prediction engine  designed to analyze price behavior and estimate  future market tendencies . Unlike conventional indicators, this system  does not rely on static parameters or historical curve-fitting , but adapts its internal state dynamically during live market operation. Instead of using static rules, the indic
Recommended TimeFrame >= H1. 100% Non Repainted at any moment.  Use it carefully, only with Trend Direction. Trading Usage: 2 Variants: as Range System or as BreakOut System (Both Only With Trend Direction)::: (Always use StopLoss for minimise Risk); [1] as Range System: (Recommended) in UP TREND:  - BUY in Blue Line , then if price goes down by 50 points (on H1) open Second BUY.   Close in any Profit you wish: TrailingStop(45 points) or Close when Price touches upper Gold Line. in DOWN TREND
Max Ribbon Mt5
Stefano Frisetti
WARNING: This indicator is distributed EXCLUSIVELY on MQL5.com MT4 version:   https://www.mql5.com/it/market/product/160363 MT5 version:   https://www.mql5.com/it/market/product/160410 ============================================================================================= MAX RIBBON ver 1.00 The indicator that shows you the TREND clearly and unambiguously! ============================================================================================= DESCRIPTION MAX RIBBON is an advanced tre
##   ONLY GOLD ##   Тiльки Золото ## **Mercaria Professional Trading Zones - Complete Guide** ## **Mercaria Professional Trading Zones - Повний посібник** ### **How Mercaria Zones Work / Як працюють зони Mercaria** **English:** Mercaria Zones is an advanced trading indicator that identifies high-probability support and resistance areas using ZigZag extremes combined with mathematical zone calculations. The indicator works on multiple timeframes simultaneously, providing a comprehensive view
Pantera Indicator
Temirlan Kdyrkhan
5 (1)
A tool for on-chart strategy backtesting and performance analysis. A utility for developing, debugging, and testing custom trading ideas and indicator functions. An indicator designed to quickly test trading concepts and visualize the effectiveness of different input parameters. An all-in-one sandbox for testing everything from simple crossovers to complex, multi-condition trading systems.
VTrende Pro
Andrii Diachenko
5 (1)
VTrende Pro - MTF indicator for trend trading with a display panel for MT5 *** Videos can be translated into any language using subtitles (video language - Russian) Although the signals of the VTrende Pro indicator can be used as signals of a full-fledged trading system, it is recommended to use them in conjunction with the Bill Williams TS. VTrende Pro is an extended version of the VTrende indicator. Difference between Pro version and VTrende: - Time zones - Signal V - signal 1-2 waves -    S
FXLAND Smart Reversal Indicator (MT5) FXLAND Smart Reversal Indicator is a professional technical analysis tool designed to help traders identify potential price reversal zones and key market turning points with clarity and precision. The best reversal indicator and price return by choosing only one ceiling or floor in each time frame A masterpiece of combining mathematics and Gann, fractal matrix, Fibonacci, movement angle and time. Completely intelligent Key Features Detects potenti
CGE Trading Suite
Carl Gustav Johan Ekstrom
5 (1)
CGE Trading Suite delivers the analytical edge typically reserved for professional trading desks. The platform integrates a full suite of analytical tools into one seamless workflow: dynamic grid mapping, liquidity behavior analysis, ECM, trend lines, MIDAS, trade cycles, and directional channel projections. Together, these provide a unified view of market structure and momentum. Directional clarity is further enhanced by the capital flow index, which measures currency basket strength to identif
WanaScalper
Isaac Wanasolo
1 (1)
A scalping indicator based on mathematical patterns, which on average gives signals with relatively small SL, and also occasionally helps to catch big moves in the markets (more information in the video) This indicator has three main types of notifications: The first type warns of a possible/upcoming signal on the next bar The second type indicates the presence of a ready signal to enter the market/open a position The third type is for SL and TP levels - you will be notified every time price re
Pan PrizMA CD Phase
Aleksey Panfilov
The Expert Advisor and the video are attached in the Discussion tab . The robot applies only one order and strictly follows the signals to evaluate the indicator efficiency. Pan PrizMA CD Phase is an option based on the Pan PrizMA indicator. Details (in Russian). Averaging by a quadric-quartic polynomial increases the smoothness of lines, adds momentum and rhythm. Extrapolation by the sinusoid function near a constant allows adjusting the delay or lead of signals. The value of the phase - wave s
FFx Universal Strength Meter PRO is more than a basic strength meter. Instead of limiting the calculation to price, it can be based on any of the 19 integrated strength modes + 9 timeframes. With the FFx USM, you are able to define any period for any combination of timeframes. For example, you can set the dashboard for the last 10 candles for M15-H1-H4… Full flexibility! Very easy to interpret... It gives a great idea about which currency is weak and which is strong, so you can find the best pai
The FFx Universal MTF alerter shows on a single chart all the timeframes (M1 to Monthly) with their own status for the chosen indicator. 9 indicators mode (MACD-RSI-Stochastic-MA-ADX-Ichimoku-Candles-CCI-PSAR). Each can be applied multiple times on the same chart with different settings. Very easy to interpret. Confirm your BUY entries when most of the timeframes are showing green color. And confirm your SELL entries when most of the timeframes are showing red color. 2 Alert Options : input to s
FFx Watcher Pro MT5
Eric Venturi-Bloxs
The FFx Watcher PRO is a dashboard displaying on a single chart the current direction of up to 15 standard indicators and up to 21 timeframes. It has 2 different modes: Watcher mode: Multi Indicators User is able to select up to 15 indicators to be displayed User is able to select up to 21 timeframes to be displayed Watcher mode: Multi Pairs User is able to select any number of pairs/symbols User is able to select up to 21 timeframes to be displayed This mode uses one of the standard indicators
FFx Patterns Alerter gives trade suggestions with Entry, Target 1, Target 2 and StopLoss .... for any of the selected patterns (PinBar, Engulfing, InsideBar, OutsideBar) Below are the different options available: Multiple instances can be applied on the same chart to monitor different patterns Entry suggestion - pips to be added over the break for the entry 3 different options to calculate the SL - by pips, by ATR multiplier or at the pattern High/Low 3 different options to calculate the 2 TPs -
FFx Basket Scanner MT5
Eric Venturi-Bloxs
MetaTrader 4 version available here : https://www.mql5.com/en/market/product/24881 FFx Basket Scanner is a global tool scanning all pairs and all timeframes over up to five indicators among the 16 available. You will clearly see which currencies to avoid trading and which ones to focus on. Once a currency goes into an extreme zone (e.g. 20/80%), you can trade the whole basket with great confidence. Another way to use it is to look at two currencies (weak vs strong) to find the best single pairs
MetaTrader 4 version available here: https://www.mql5.com/en/market/product/25793 FFx Pivot SR Suite PRO is a complete suite for support and resistance levels. Support and Resistance are the most used levels in all kinds of trading. Can be used to find reversal trend, to set targets and stop, etc. The indicator is fully flexible directly from the chart 4 periods to choose for the calculation: 4Hours, Daily, Weekly and Monthly 4 formulas to choose for the calculation: Classic, Camarilla, Fibonac
ClassicSBA
Umri Azkia Zulkarnaen
this indicator very simple and easy if you understand and agree with setup and rule basic teknical sba you can cek in link : please cek my youtube channel for detail chanel : an for detail info  contact me  basicly setup buy (long) for this indicator is Magenta- blue and green candle or magenta - green  and green candlestik and for setup sell (short) is Black - yellow - and red candle or black - red  and red candlestik
Pendiente de Precio
Cesar Juan Flores Navarro
Indicador en base a la pendiente de la linea de precio, dibuja una línea de color cuando sube a base de los precios que previamente has sido procesados o linealizados, y cuando baja la pendiente la linea linealizada toma otro color. En este caso se a considerado 6 lineas de diferentes procesos desde pendientes largas hacia las cortas, observándose que cuando coincidan las pendientes se produce un máximo o mínimo, lo que a simple vista nos permitirá hacer una COMPRA O VENTA.
Индикатор Coefficient Of Determination (COD) представляет собой значение коэффициента детерминации или квадрат коэффициента корреляции между зависимой переменной — ценой и объясняющей переменной — тиковым объемом. Что это дает нам на практике? COD отлично распознает кульминацию трендовых движений, что позволяет подбирать оптимальные точки и ловить развороты рынка. Как использовать индикатор: Наиболее популярная торговая стратегия строится совместно с трендовым индикатором Moving Average (MA), пе
Fibonacci Multiple 12
Cesar Juan Flores Navarro
Fibonacci Múltiple 12, utiliza la serie fibonacci plasmado en el indicador fibonacci, aumentadolo 12 veces según su secuencia. El indicador fibonacci normalmente muestra una vez, el presente indicador se mostrara 12 veces empezando el numero que le indique siguiendo la secuencia. Se puede utilizar para ver la tendencia en periodos cortos y largos, de minutos a meses, solo aumentado el numero MULTIPLICA.
Linea Horizontal Inteligente
Cesar Juan Flores Navarro
En base a cálculos matemáticos de determino una linea Horizontal que cruza a todas las señales de trading, mostrando los máximos y mínimos. La linea horizontal parte en dos las subidas y bajadas de las señales de trading, de tan manera que es fácil identificar los máximos y mínimos, y es inteligente por que es sensible a las subidas y bajadas, afín de no quedarse en un solo lado por siempre, trabaja excelentemente con otros indicadores suavizadores ya que les garantiza que en un intervalo de tie
Spike Detector
Tete Adate Adjete
this indicator is a Spike detector indicator, it is specially designed to trade Boom 1000, Boom 500, Crash 1000 and Crash 500 We recommend using it on Deriv Boom and Crash indices only Its setting is intuitive, familiar, easy to use it has notification functions; audible notifications and push notifications. this tool is simple to use, easy to handle This update is based on different strategies for spikes
Escalera Inteligente
Cesar Juan Flores Navarro
Indicador en MQL5, recibe la información del precio SUAVIZADO, lo procesa anulando los picos inteligentemente, y el resultado lo envía al desarrollo de la escalera que iniciara y subirá o bajara según el peldaño o INTERVALO ingresado Ingreso PERIODO = 50 (variar segun uso) Ingreso MULTIPLICA AL PERIODO = 1 (variar segun uso) Segun la configuración la escalera puede pegarse o separarse de los precios,, Se aplica toda la linea de tiempo, y a todas las divisas, etc.  
Fibonacci Suavizado
Cesar Juan Flores Navarro
Indicador en MQL5, que obtiene el promedio de 10 EMAS, que son alineadas según Fibonacci, obteniendo un promedio, que sera suavizado.  Se puede ingresar un numero desde 2 a N, que multiplica a los EMA-Fibonacci. Funciona en cualquier criptomoneda, etc. etc... pudiendo calcular el futuro segun la tendencia de las EMAS. Funciona excelentemente en tramos largos, determinando exactamente el mejor inicio/salida. El precio inicial por apertura sera por un periodo de tiempo, luego aumentará.
作者的更多信息
Projection of Phi
Nestor Jose Mendez Boza
Projection of Phi   Is a technical indicator that calculates dynamic support and resistance levels. It uses angular geometric projections and mathematical ratios to identify market expansion ranges. Features: Dynamic Fibonacci Expansion: Extension level projection Geometric Calculation: Angular analysis and mathematical ratios Visualization: Graphical objects with informative labels Compatibility: M1 to H4 timeframes Applications: Identification of zones for trade management Analysis of volatil
筛选:
无评论
回复评论