Gold Squeeze Momentum Indicator

# MT5 挤压动量指标

使用功能强大的**挤压动量指标**,释放爆发式市场机遇。该指标专为 MetaTrader 5 平台专业开发。

这款先进的波动率和动量指标可帮助交易者在重大市场行情发生前识别低波动时期。该指标结合了布林带和肯特纳通道的优势,揭示市场何时处于“挤压”状态,并准备突破。

内置的动量柱状图使趋势方向和动量变化一目了然,帮助交易者自信而精准地入场交易。

## 功能特性

* 高级挤压检测系统

* 专业 MT5 平台实现

* 突破爆发前检测波动挤压

* 动态颜色变化的动量直方图

* 挤压状态点,方便解读市场状况

* 整合:

* 布林带

* 肯特纳通道

* 线性回归动量

* 早期趋势转变检测

* 简洁流畅的独立窗口显示

* 完全自定义设置

* 轻量级优化,运行流畅

## 动量直方图颜色

* 亮绿色 → 上涨动量增强

* 深绿色 → 上涨动量减弱

* 亮红色 → 下跌动量增强

* 深红色 → 下跌动量减弱

## 挤压点颜色

* 白色 → 挤压开启(低波动/突破设置)

* 金色 → 挤压释放(潜在突破行情)

* 红色 → 无挤压状态

## 适用人群

* 突破交易者

* 超短线交易者

*波段交易者

* 动量交易者

* 信息通信技术及精明资金交易者

* 波动率交易者

* 外汇、黄金、加密货币、指数和股票

## 交易者喜爱它的原因

市场波动性经常从低波动性转变为高波动性。此指标可帮助交易者在波动性爆发前进行预测。

交易者无需在市场后期追涨杀跌,而是可以提前做好准备,在动量扩大之前就占据有利位置。

## 兼容平台

* MetaTrader 5 (MT5)

* 任何经纪商

* 任何时间周期

* 任何交易品种

使用这款专为现代交易者打造的强大波动率突破和动量分析工具,进行更智能的交易。


推荐产品
Institutional Smart Compass Pro (ISCP) The All-in-One Institutional Order Flow & Liquidity Indicator for MetaTrader 5 Stop guessing where the big players are. Start seeing it. Why Institutional Smart Compass Pro? Most retail traders lose not because they lack effort, but because they trade against the footprints of large institutions. They buy right where liquidity is about to be swept. They sell into fresh demand. They enter on a lone signal with no confirmation behind it. Institutional Smar
FlatOut Movings Robot:绝对掌控震荡盘整,自信领航趋势行情。 基于移动平均线的指标策略都有一个共同 text 里的噩梦:一旦市场切换阶段,您的本金就会开始缩水。传统的均线在震荡市(盘整期)中会产生数十次虚假交叉,而标准的过滤器又存在严重的滞后性。这导致您常常深夜顶着压力守在终端前,却偏偏在行情行将结束时才建仓入场。 本软件专为解决这一具体痛点而生。机器人能够持续扫描图表,像获取了订单簿的内部消息(内幕数据)一样读取市场结构。无论是在死气沉沉的横盘震荡中,还是在强劲的趋势脉冲行情下,它都能保持同样高效的交易表现。系统宛如一把手术刀,精准地将真实突破与进入交易通道的虚假洗盘剥离开来。 历经市场混沌时代的岁月检验 该软件的数学核心已通过了长达十年的无序价格风暴周期(各周期交替更迭)的严苛回测。该算法在设计之初就具备了抵御任何全球金融危机以及市场时代变革的能力。 脉冲猎手: 机器人在行情无回旋余地的临界点(即价格顺着阻力最小的方向飞速推进的节点)切入交易。入场点经过极度精准的计算,因此持仓头寸通常几乎不会承受有害的反向浮亏压力。 连胜主宰: 机器人字典里没有
[b]Titan Pro V7 Institutional Dashboard[/b] is an advanced quantitative HUD terminal engineered for MetaTrader 5, designed for institutional market analysis, quantitative prop-firm verification, and disciplined intraday execution. Unlike conventional single-formula indicators that suffer from lag and market regime shifts, Titan Pro V7 synthesizes a multi-strategy quantitative consensus model combining Trend Momentum, Volatility Breakout, Intraday VWAP, and Smart Money Concepts (SMC) into a sin
Quantum Frequency Indicator MT5 Universal Market Frequency Analyzer for MT5 Trade Forex, Crypto, Stocks & Indices With Advanced Frequency-Based Signals Overview The Quantum Frequency Indicator (QFI) MT5 Version is a next-generation analytical tool designed to detect the hidden frequency structures within financial markets. Based on 14 years of research into market vibrations, price cycles and energy flow patterns, QFI provides traders with highly refined Buy and Sell zones across all major
OTC Trend Radar Clean on-chart signals with an entry zone, stop-loss and profit targets, controlled from a compact panel. What you get - Buy and Sell arrows on the M1 and M5 charts - A "Buy Zone" / "Sell Zone" box for each signal - Automatic stop-loss and up to seven profit-target levels, each with its price; the lines follow price until the move ends - Follow-up arrows for additional opportunities in the direction of the trade - Direction tags above the panel showing the current M1 and M5 sta
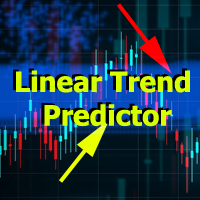
Linear Trend Predictor — 结合切入点和方向支撑线的趋势指标。按照突破高/低价通道的原理运作。该指标算法过滤市场噪音,考虑波动性和市场动态。 指示器功能  使用平滑方法,显示市场趋势和开立买入或卖出订单的切入点。  适合通过分析任何时间范围内的图表来确定短期和长期的市场走势。  输入参数可适应任何市场和时间范围,允许交易者独立定制指标。  设定的指示信号不会消失,也不会重新绘制——它是在蜡烛收盘时确定的。  几种类型的通知以箭头组合。  该指标既可以作为独立的交易系统使用,也可以作为其他交易系统的补充。  可供任何经验水平的交易者使用。 主要参数 Volatility Smoothing Level - 指标的主要参数,允许您配置指标以实现舒适的操作。 它的数字范围是 1 到 100,从而增加了您可以获得更长趋势运动的平滑度。 通过少量的数字,您可以获得短期走势并快速退出交易。 使用指标进行交易的时刻:  红线和箭头表示下降趋势和卖出开盘信号。止损应根据前一个上分形来设置。  黄线和箭头表示上升趋势和买入开盘信号。止损应根据前一个下分形来设置。
CISD Levels Pro automatically draws CISD Buy and Sell levels directly on your chart. It highlights pending levels while they are forming, then marks confirmed levels after the confirmation candle closes. Optional confirmation arrows help you spot the signal quickly. This tool is designed for traders who want clean, simple CISD level visualization without extra indicators or clutter. Key Features Draws Bullish (BUY) CISD levels and Bearish (SELL) CISD levels Shows Pending levels (dashed) and
The Plasma Trend indicator is a simple technical indication that is used to determine the current trend direction in the market. The Plasma Trend indicator is a powerful tool for determining the direction of the trend in the Forex market. It is based on both standard technical indicators and proprietary mathematical calculations, which provides a more accurate and reliable trend determination. Its implementation in the form of lines of two colors simplifies the visual determination of a change
ACB Breakout Arrows Scanner MT5
KEENBASE SOFTWARE SOLUTIONS
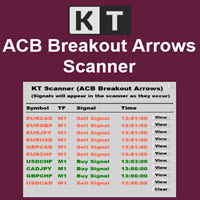
这是我们的指标 ACB Breakout Arrows 的多品种、多时间周期扫描器。默认情况下,它可同时在 28 个货币对和 9 个时间周期 上扫描买入/卖出信号,为交易者节省大量查图时间,提高操作效率。  功能特点 可在一个图表中扫描多达 252* 个品种与时间周期的组合,极大地提升监控能力。 点击任一信号即可打开相应图表,并自动加载预设模板,便于快速跟进。 面板可自由拖动并放置于图表上的任意位置。 支持实时提醒功能,包括弹窗提示、声音报警、推送通知和电子邮件提醒,确保不错过任何重要信号。  输入参数 为 ACB Breakout Arrows 设置信号灵敏度,可根据策略需求微调。 Symbols:填写你希望系统扫描的货币对或交易品种。  刷新历史:如发现图表数据缺失或异常,可通过此选项自动下载并更新历史数据。  选择所需扫描的时间周期,可单选或多选。 提醒设置:自定义提醒类型与条件,提升响应效率。 面板颜色与字体大小均可自由调整,支持个性化视觉体验。 
Manyal trading system, CovEchoTrend Robot, focuses on reliability and flexibility. By employing statistical analysis methods to study the relationships between the base indicator and market patterns, the system enables a deeper understanding of market processes. Intelligent pattern analysis: The application of statistical data processing helps identify key trend reversal points more accurately, signaling significant market shifts. Informed decision-making is based on the intersection of indicato
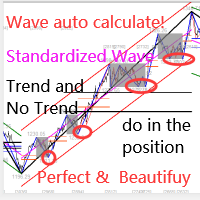
本指标是实践实战交易完善的波浪自动分析的指标 !  案例... 注: 波浪分级用西方叫法不习惯,因受到缠论(缠中说禅)命名方式习惯的影响,我是将基础波浪命名为 笔 ,将二级波段命名为 段 ,同时具有趋势方向的段命名为 主趋段 (以后笔记中都是这种命名方式,先告知大家),但是算法上和缠论关系不大切勿混淆.反映的是本人分析盘面总结的 千变万化纷繁复杂的运行规律 . 对波段进行了标准化定义,不再是不同人不同的浪  ,    对人为干扰的画法进行了排除,在严格分析进场起到了关键的作用 . 使用这个指标,等于将交易界面提升美感,抛弃最原始的K线交易带你进入新的交易层次.如果不是为了交易,在宣传上也将使客户观感提升层次. 指标内容: 1.   基础波浪 (笔) : 首先我们找出了价格波动过程中的基础波动拐点,当然他的有序性低,为下一步的计算提供基础. 2.   二级波段( 段 ) :在基础波浪的基础上,通过算法分析得到层级更明显的二级波段,二级波段为波浪提供了分析基础 3.   波浪( 浪 ): 有着更清晰的趋势,更清晰直观的方向.分析一个波浪是否延续,需要看二级波段的形态,分析二级的构成
RelativeVolume
Richard Barile
Relative Volume (RVOL) Indicator See When Volume Really Matters Not all volume is equal. The Relative Volume (RVOL) Indicator helps you quickly identify when the market is experiencing unusually high trading activity compared with its recent average. Instead of simply showing how much volume is trading, RVOL puts current volume into context—making it easier to spot moments when buyers or sellers may be becoming more active. Key Features Identify High-Volume Bullish Moves Quickly spot candles
Smart Reversal Prophets
Loys Steve Dzene Tagne
Avez-vous toujours rêvé de pouvoir entrer sur le marché juste après la clôture d'une bougie… et de voir le marché évoluer immédiatement dans votre sens ? Avez-vous toujours souhaité détecter les retournements de tendance plus tôt, éviter les faux signaux et, surtout, saisir les tendances longues avant la majorité des traders ? Aujourd'hui, je vais vous présenter mon nouvel indicateur : Prophète du retournement intelligent. Contrairement aux indicateurs traditionnels qui réagissent avec un certa
️ **This document and indicator do not constitute investment advice. Past performance is no guarantee of future results.** 1. Product Introduction **ATR Fibonacci Trend Envelopes** combines three proven concepts into a single tool: * **Volatility-sensitive trend engine** — Dynamic bands that expand and contract with the ATR around a selectable moving average baseline (SMA/EMA/WMA/HMA/RMA). If the price breaks above the upper band on a candle close, a **BULL** regime begins; if it breaks bel
FXLAND Smart Reversal Indicator (MT5) FXLAND Smart Reversal Indicator is a professional technical analysis tool designed to help traders identify potential price reversal zones and key market turning points with clarity and precision. The best reversal indicator and price return by choosing only one ceiling or floor in each time frame A masterpiece of combining mathematics and Gann, fractal matrix, Fibonacci, movement angle and time. Completely intelligent Key Features Detects potenti
LazyTrader 市场智能分析指标 多市场趋势与关键价位分析 洞察全局,把握市场脉络。 通过 LazyTrader 市场智能分析指标(LazyTrader Market Intelligence) ,以更加系统化的方式分析市场。本指标将趋势方向、技术指标状态、关键价格水平、市场结构以及经济日历信息整合到一个直观、清晰的仪表板中。 对于希望全面了解市场状况的交易者,本指标能够集中呈现多层次的市场信息,减少在不同分析工具之间频繁切换的需要。 核心功能 1. 多时间框架趋势智能分析 通过趋势仪表板,从六个时间框架观察市场方向: D1 — 日线趋势 H4 — 4 小时趋势 H1 — 1 小时趋势 M15 — 15 分钟趋势 M5 — 5 分钟趋势 M3 — 3 分钟趋势 对比高时间框架与短时间框架的市场方向,观察看涨、看跌及中性市场状态。 2. 灵活的时间框架支持:M1 至 MN1 您可以根据交易需求,在 MetaTrader 5 支持的图表时间框架上使用本指标,涵盖从 1 分钟到 1 个月的时间周期。 分钟时间框架 M1 — 1 分钟 M2 — 2 分钟 M3 — 3 分钟 M4 — 4
Apex Heat Zone
Alier Nunez Fonseca
Xtrade Trend Detector
Dago Elkana Samuel Dadie
Xtrade Trend Detector is an indicator capable of finding the best opportunities to take a position in any stock market. Indeed, it is a great tool for scalpers but also for Daytraders. You could therefore use it to identify areas to trade, it fits easily on a chart. I use it to detect trends on Big timeframes and take positions on Small timeframes. Don't hesitate to give me a feedback if you test it.
RubdFx Perfect Reversal , The reversal indicator is used to determine areas of support and resistance by Drawing an arrow with a level of supply and demand ( ReversalZones ). - You will catch more swings by reducing the period, and less swings if you increase period - Mobile, computer and email alerts available . it is not pushed by price which means the arrow will stay in one place,suitable for scalping and long term trading  Also Compatible with all forex paris , BUY RULES;  open a buy positio
The indicator scans for TD Combo signals in multiple timeframes for the all markets filtered and shows the results on Dashboard. Key Features Dashboard can be used for all markets It can scan for signals on MN1, W1, D1, H4, H1, M30, M15 ,M5, M1 timeframes Parameters UseMarketWatch: Set true to copy all symbols available in market watch MarketWatchCount : Set the number of symbols that you want to copy from the market watch list. CustomSymbols: Enter the custom symbols that you want to be availa
Btmm state engine pro
Garry James Goodchild
5 (4)
BTMM State Engine Pro by G-Labs — Beat The Market Maker indicator for MetaTrader 5. Asian session range, London and New York kill zones, level progression (L1/L2/L3), peak formation detection (PFH/PFL), entry signals, and a multi-pair scanner from one chart for BTMM and Trend Trading traders Stop scanning charts one pair at a time. The State Engine tracks the BTMM daily cycle automatically — Asian box, room boundaries, level blocks, peak formations, and filtered entries — while the scanner das
DuhokTrend
Ismael Nayif Ismael Ismael
How to Add a Product Description (MetaTrader Market) To add the product description effectively in MetaTrader's Market, follow these steps: 1. Log into the MetaTrader Market: Go to your MQL5 account . Navigate to the "Seller's Dashboard" or "Products" section. Select your product, DuhokTrend . 2. Writing the Description: To enhance the product's rating, write a detailed and structured description : Template for Product Description: DuhokTrend - Advanced Indicator for Trend Analysis Overview:
First time on MetaTrader, introducing IQ Star Lines, an original Vedic Astrology Based Intraday Trading Indicator. We don't offer free or bonus indicators in exchange of reviews from you. You won't need any free products with this indicator to make it work. ;) Enjoy! Welcome to the new and updated  IQ Star Lines , the ultimate fusion of ancient planetary cycles and modern quantitative trading, published for the first time on Metatrader. This is an indicator built by the developer, who has spent
MTF Parabolic SAR Maximize your trading efficiency with the Multi-Timeframe Parabolic SAR Trend and Momentum Dashboard. Designed for serious traders who value clarity over clutter, this tool aggregates price action across six timeframes into a single, sleek visual interface.  By combining that reliable classic Parabolic SAR logic with advanced momentum scoring and risk assessment, this indicator transforms raw data into actionable trade signals.  The Strategic Edge: Why This Indicator? Most tra
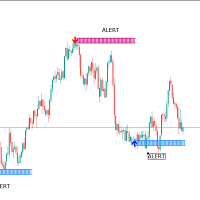
. . is designed for traders who want a clean and practical way to identify bullish and bearish trend changes directly on the MT5 chart. The indicator uses a dual high/low smoothing engine to detect market direction and show a clear active trend line. When the market confirms a bullish or bearish flip
Aurum mid quant pro
N'da Lemissa Kouame
AURUM MID-QUANT PRO v5.60 Quantitative Excellence for Gold (XAU/USD) & Volatility Trading Gain a professional edge over institutional markets with AURUM MID-QUANT PRO , an advanced Price Action Pattern Detection and Breakout Engine designed exclusively for MetaTrader 5 . Built specifically to capture the unique volatility of Gold (XAU/USD) and other major financial instruments, this powerful indicator combines high-precision algorithmic pattern recognition with real-time dynamic accumulation z
TrendMorph
Evgeniy Zhdan
TrendMorph —— 带入场箭头的自适应趋势指标 简介 TrendMorph 用彩色线条显示趋势方向,用 Buy/Sell 箭头标记反转点,并为每个信号给出置信度评分以及止损/目标价位。指标可以根据当前市场状态自动调整线条的灵敏度,因此同一组参数在平静和波动剧烈的行情中都能使用。图表上显示信息面板,所有关键数值也可通过缓冲区供 EA 调用。 MT4-version:  https://www.mql5.com/en/market/product/202707 工作方式 趋势线跟随价格:蓝色表示上升趋势,红色表示下降趋势。 当趋势转向且信号通过各项过滤(RSI、成交量、价位质量、信号间隔)后,出现箭头。箭头在K线收盘后绘制,之后不会移动或消失。 启用自动调节后,线条灵敏度(Band Width 和 Smoothing Period)会适应市场。 每个信号都带有置信度(0–100)以及以 ATR 表示的 Stop 和 Target 价位。 使用方法 箭头是K线收盘后的入场信号。趋势线显示方向,可作为持仓管理的参考。 查看面板中的 Market 行:TREND 表示趋势行情,RAN
FREE
Yawabeh SD Pro –  Professional Supply and Demand Indicator Trade Smarter with Volume-Confirmed Supply/Demand Zones Our institutional-grade algorithm identifies high-probability reversal zones before price reacts, giving you the edge in Forex, Crypto, and Stocks. Key Features Multi-Timeframe Confirmation – View trend strength across multiple timeframes simultaneously – Align your trades with higher timeframe momentum Smart Alert System – Real-time notifications for: – Strong demand/supply zone
Man Trend
Ivan Simonika
Man Trend uses at its core the process of identifying the rate of change in price growth and allows you to find entry and exit points from the market. The indicator was created on the basis of the original indicators for searching for extreme points, the indicator is well suited for determining a reversal or a large sharp jerk to one of the sides, thanks to it you will know when this happens, it will notify you with the appearance of a blue dot to buy red to sell. This is a fundamental techni
TradePilot MT5 Market Panel
Bartosz Andrzej Danowski
A professional MT5 trading panel designed for decision support, risk management, and trade planning — not automated execution. Helps traders plan entries, manage positions, and control risk with clarity and consistency. Overview Real-time trading decision panel that analyzes trend, momentum, and market quality directly on the chart. It provides ATR-based TP/SL levels and clear buy/sell conditions to support faster and more consistent trading decisions. This is a decision support tool only —
该产品的买家也购买
Boba Analysis Suite
Trade Ready Solutions LLC
5 (2)
Boba Analysis Suite Boba Analysis Suite 是一款适用于 MetaTrader 5 的分析指标。它将市场结构、关键价格区域和整体市场背景整合到同一图表视图中。 该指标源于交易及交易教学的实践经验,旨在帮助用户建立有条理的分析流程:评估市场方向、识别重要价位,并结合多个时间周期进行分析。 结合市场背景进行分析 单个信号的意义取决于市场背景。Boba Analysis Suite 帮助用户将当前图表状况与更大范围的市场结构相结合,并根据预先制定的规则评估交易思路。 分析功能包括: **趋势与市场结构:**评估市场方向及相关结构背景。 **关键价格区域与价位:**在图表上直观标示值得进一步分析的重要区域。 **多时间周期:**整合不同时间周期的信息,评估整体市场背景。 **可视化分析流程:**直接在图表上查看分析信息。 自主做出交易决策 Boba Analysis Suite 适合希望系统分析图表并结合多个时间周期信息的交易者。 该指标用于辅助分析,不会开仓或平仓,也不能替代交易策略或风险管理。每一笔交易的决策均由用户自行做出。 使用与许可 平台:Meta
ARICoins
Temirlan Kdyrkhan
ARICoin is a powerful trading companion designed to generate high-probability entry signals with dynamic TP/SL/DP levels based on volatility. Built-in performance tracking shows win/loss stats, PP1/PP2 hits, and success rates all updated live. Key Features: Buy/Sell signals with adaptive volatility bands Real-time TP/SL/DP levels based on ATR Built-in MA Filter with optional ATR/StdDev volatility Performance stats panel (Success, Profit/Loss, PP1/PP2) Alerts via popup, sound, push, or email Cust
ScalpPoint
Temirlan Kdyrkhan
ScalpPoint is a powerful trading companion designed to generate high-probability entry signals with dynamic TP/SL/DP levels based on volatility. Built-in performance tracking shows win/loss stats, PP1/PP2 hits, and success rates — all updated live. Key Features: Buy/Sell signals with adaptive volatility bands Real-time TP/SL/DP levels based on ATR Built-in MA Filter with optional ATR/StdDev volatility Performance stats panel (Success, Profit/Loss, PP1/PP2) Alerts via popup, sound, push, or emai
AriFocus
Temirlan Kdyrkhan
AriFocus - Non-Repainting Buy/Sell Signals AriFocus - one clear signal. AriFocus marks buy and sell signals directly on the chart and suggests a stop-loss level for each one. Every signal is confirmed on bar close and never repaints. - Buy/sell arrows, confirmed on bar close - Suggested stop-loss level for every signal - Trend band and candle coloring to show direction at a glance - 10 ready-made presets, or your own settings (14 calculation methods) - Pop-up, push and email alerts with entr
ARIPoint
Temirlan Kdyrkhan
1 (4)
ARIPoint is a powerful trading companion designed to generate high-probability entry signals with dynamic TP/SL/DP levels based on volatility. Built-in performance tracking shows win/loss stats, PP1/PP2 hits, and success rates all updated live. Key Features: Buy/Sell signals with adaptive volatility bands Real-time TP/SL/DP levels based on ATR Built-in MA Filter with optional ATR/StdDev volatility Performance stats panel (Success, Profit/Loss, PP1/PP2) Alerts via popup, sound, push, or email Cu
SMC Sniper Pro MT5
Jordan Steven R Machell
SMC Sniper Pro MT5 SMC Sniper Pro by QuantFlow Labs is a chart indicator for liquidity-based intraday analysis. It combines session ranges, tracked liquidity sweeps and three selectable entry models in one configurable workspace. It displays setup context and entry references; it does not open, manage or close trades. Three selectable entry models Model 1 - Inverse Fair Value Gap breakout: after an eligible liquidity sweep, the indicator waits for a confirmed close through the relevant fair valu
VTrende Pro
Andrii Diachenko
5 (1)
VTrende Pro - MTF indicator for trend trading with a display panel for MT5 *** Videos can be translated into any language using subtitles (video language - Russian) Although the signals of the VTrende Pro indicator can be used as signals of a full-fledged trading system, it is recommended to use them in conjunction with the Bill Williams TS. VTrende Pro is an extended version of the VTrende indicator. Difference between Pro version and VTrende: - Time zones - Signal V - signal 1-2 waves -    S
QNC Scalper
Yordiana Enggelina Seko
Here is a professional and engaging description for the Indikator QNC Scalper tool in English, tailored for traders and platforms: Indikator QNC Scalper Unlock precision trading in fast-paced markets with the Indikator QNC Scalper —an advanced technical analysis tool engineered specifically for scalpers and day traders. Whether you are trading forex, crypto, or indices, this indicator cuts through market noise to deliver clear, high-probability entry and exit signals. Key Features Real-Time M
TrendMaestro5
Stefano Frisetti
note: this indicator is for METATRADER4, if you want the version for METATRADER5 this is the link:  https://www.mql5.com/it/market/product/108106 TRENDMAESTRO ver 2.5 TRENDMAESTRO recognizes a new TREND from the start, he never makes mistakes. The certainty of identifying a new TREND is priceless. DESCRIPTION TRENDMAESTRO identifies a new TREND in the bud, this indicator examines the volatility, volumes and momentum to identify the moment in which there is an explosion of one or more of these da
FX-AIEA 供给需求区智能识别指标(Supply and Demand Indicators MT5)——技术原理与参数讨论 版本:2.51 | 适用平台:MetaTrader 5 引言 供给需求区是机构订单流的重要表现形式,相比传统支撑阻力位能更直接地反映买卖力量的失衡。本指标尝试通过算法自动识别高概率供需区域,以减少手动绘制的耗时与主观性。其核心逻辑基于自适应 ZigZag 算法,提取波峰波谷并生成区域标识 。 核心技术特点 全自动绘制机制 :基于改良版 ZigZag 动态提取有效极值,标记潜在供给区与需求区。指标遵循 MQL5 原生   prev_calculated   机制,在新 K 线生成时自动重绘,支持跨周期强制计算( Forced_TimeFrame   参数)。 区域边界模式 :支持宽带(覆盖K线影线极值)与窄带(仅覆盖实体)两种模式,用户可通过   use_narrow_bands   参数切换,以适应不同交易风格。 滤噪算法 :启用   kill_retouch   后,自动剔除被后续行情反复轻触但未有效突破的弱势区域,以提升信号有效性。 视觉与性能 :支持自
The indicator is designed to close positions on the market in time. For example: to take profits ahead of schedule if the price has not reached TakeProfit, and the market is turning around. The indicator analyzes the momentum, not the trend. He does not give any information about the trend. The indicator is well suited for finding divergence. The Ershov 38 Parrots indicator dynamically adjusts to the market and detects price movement impulses of medium and high amplitude. It almost does not rea
AriX
Temirlan Kdyrkhan
1 (4)
AriX Indicator for MT5 A powerful trend-following and signal-evaluation tool AriX is a custom MT5 indicator that combines Moving Averages and ATR-based risk/reward logic to generate clear buy/sell signals. It visualizes dynamic SL/TP levels, evaluates past trade outcomes, and displays win/loss statistics in a clean on-chart panel. Key features include: Buy/Sell signals based on MA crossovers ATR-based SL/TP1/TP2/TP3 levels with visual lines and labels Signal outcome tracking with real-time stat
Meravith Scanner
Ivan Stefanov
5 (3)
MERAVITH SCANNER 是一款适用于 MetaTrader 5 的专业金融市场指标,将多种分析工具整合为一个统一的系统。它基于专有的成交量加权平均价格(VWAP)方法自动完成所有计算,完全消除主观判断。 该指标适用于所有资产类别(外汇、股票、指数、大宗商品、加密货币)以及从 M1 到 Monthly 的所有时间周期。其核心原理是价格跟随成交量。MERAVITH 识别机构资金成交量的集中区域,并从该集中区域中推导出数学上精确的价格水平。它不预测,不推测。它只计算。 使用 MERAVITH SCANNER,您可以在 2–3 分钟内扫描全部 28 个主要外汇货币对的所有时间周期。您也可以扫描任何您选择的市场——例如,大约 100 只股票约需 10 分钟。 该指标计算耗尽水平、平衡线、偏差、统计水平以及目标投射。 图表元素 Origin Point 标记所有计算的起始位置。指标会自动将其放置在最佳位置。红色标签(TOP)表示市场高点并带有看跌倾向。绿色标签(BOTTOM)表示市场低点并带有看涨倾向。 Sentiment Line 是一条动态曲线,反映基于成交量加权计算得出的市场情绪。
一句话理解 这是一个 二合一的智能指示器 ——把 RSI 和 MACD 两位“专家”的意见打包成一个简单的结论:出现箭头,就行动;没有箭头,就等待。 而且箭头 不会重绘 ,收盘后是什么样,永远就是什么样。 它解决了什么问题 很多交易者同时看 RSI(判断动量和超买超卖)和 MACD(判断趋势方向),但两者经常给出矛盾信号。 这个指示器的做法是: 只有两人同时同意 ,才发出信号。这就过滤掉了大量假信号和模糊时段。 你实际看到的东西 独立的指示器窗口(不遮住 K 线图) 清晰的 买入箭头 和 卖出箭头 放大版的 MACD 柱状图(更容易看清动量变化) RSI 和 MACD 的线依然在,但你的注意力只需放在箭头上 谁适合用 新手 :不用学两个指标如何配合,跟着箭头做即可 老手 :节省时间,快速过滤噪音,且不重绘的特性让回测结果可信 所有讨厌信号闪烁的人 为什么它不重绘 因为它的判断逻辑基于 完整收盘后的价格数据 。信号只有在满足条件的那一刻才会固定下来,之后不会因为后续 K 线的变化而修改之前的箭头。 这意味着你可以放心做回测,也能在实盘中信任你看到的每一个信号。 底层特点(不复杂地说) 它
Volume Arrow Signal Product Description Volume Arrow Signal is a smart trading indicator designed to help traders identify potential buy and sell opportunities using price action, volume behavior, and directional arrow signals. The indicator places clear arrows directly on the chart, making it easy to spot possible market reversals, trend continuations, and entry opportunities without spending hours analyzing charts manually. Whether you are trading Gold (XAUUSD) , Forex pairs, Indices, or Crypt
MasterTrend
Temirlan Kdyrkhan
MasterTrend Indicator for MT5 A powerful trend-following and signal-evaluation tool MasterTrend   is a custom MT5 indicator that combines Moving Averages and ATR-based risk/reward logic to generate clear buy/sell signals. It visualizes dynamic SL/TP levels, evaluates past trade outcomes, and displays win/loss statistics in a clean on-chart panel. Key features include: Buy/Sell signals based on MA crossovers ATR-based SL/TP1/TP2/TP3 levels with visual lines and labels Signal outcome tracking wit
SMC Sweep Fvg MT5
Daniil Sleptsov
5 (1)
SMC Sweep Fvg MT5 — 像聪明钱一样看市场,就在你的图表上 你一定有过这种感觉:价格扫掉你的止损,随后反转,并正好走到你预期的方向。方向你是对的,错的只是入场。 这个指标就是为了让这类情况少发生。它接手分析中最繁重的部分——图表标注,把真正重要的留给你:决策。 你会在图表上看到什么 市场结构 — 真实的结构高点与低点,带有 HH / HL / LH / LL 标记和水平线。趋势一目了然,无需猜测。 失衡区(FVG) — 价格推进过快、之后常会回补的区域。未回补与已回补的区域用不同颜色显示。 流动性行为 — 指标跟踪市场在反转前扫过关键水平的时刻。 现成的交易布局 — 入场箭头、止损位与盈利目标。全部画好,无需心算。 趋势过滤 — 更高周期的趋势线,帮你站在主趋势一侧。 指标关注流动性扫荡、失衡形成与结构状态——并只突出这些因素同时对齐的情形。 统计面板——回应每一个疑虑 你不必只听别人说。图表上的内置面板会按所选历史显示: 分析周期(K线数量); 检测到的情形总数; 多少到达目标、多少触及止损; 仍在运行中的数量; 以点数计的净结果。 切换品种——面板重
KenKem Master Volume Profiler - Brief Introduction A Display-only volume-profile cockpit for XAUUSD, BTCUSD and other liquid symbols. Draws profile structure, multi-timeframe flow, EMA trend and study-only setup markers. Places no orders. Not a signal service.  It maps where the market has actually traded and reads recent order flow, so you can see structure and lean at a glance.  What it shows: Master and local volume profiles (POC and value-area high/low) - the price shelves that matter. A liv
Pan PrizMA CD Phase
Aleksey Panfilov
The Expert Advisor and the video are attached in the Discussion tab . The robot applies only one order and strictly follows the signals to evaluate the indicator efficiency. Pan PrizMA CD Phase is an option based on the Pan PrizMA indicator. Details (in Russian). Averaging by a quadric-quartic polynomial increases the smoothness of lines, adds momentum and rhythm. Extrapolation by the sinusoid function near a constant allows adjusting the delay or lead of signals. The value of the phase - wave s
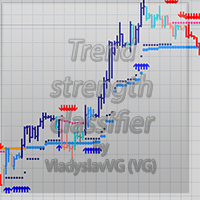
Классификатор силы тренда. Показания на истории не меняет. Изменяется классификация только незакрытого бара. По идее подобен полной системе ASCTrend, сигнальный модуль которой, точнее его аппроксимация в несколько "урезанном" виде, есть в свободном доступе, а также в терминале как сигнальный индикатор SilverTrend . Точной копией системы ASCTrend не является. Работает на всех инструментах и всех временных диапазонах. Индикатор использует несколько некоррелируемых между собой алгоритмов для класси
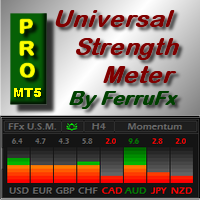
FFx Universal Strength Meter PRO is more than a basic strength meter. Instead of limiting the calculation to price, it can be based on any of the 19 integrated strength modes + 9 timeframes. With the FFx USM, you are able to define any period for any combination of timeframes. For example, you can set the dashboard for the last 10 candles for M15-H1-H4… Full flexibility! Very easy to interpret... It gives a great idea about which currency is weak and which is strong, so you can find the best pai
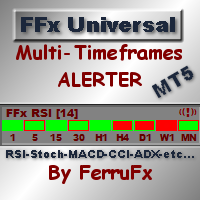
The FFx Universal MTF alerter shows on a single chart all the timeframes (M1 to Monthly) with their own status for the chosen indicator. 9 indicators mode (MACD-RSI-Stochastic-MA-ADX-Ichimoku-Candles-CCI-PSAR). Each can be applied multiple times on the same chart with different settings. Very easy to interpret. Confirm your BUY entries when most of the timeframes are showing green color. And confirm your SELL entries when most of the timeframes are showing red color. 2 Alert Options : input to s
FFx Watcher Pro MT5
Eric Venturi-Bloxs
The FFx Watcher PRO is a dashboard displaying on a single chart the current direction of up to 15 standard indicators and up to 21 timeframes. It has 2 different modes: Watcher mode: Multi Indicators User is able to select up to 15 indicators to be displayed User is able to select up to 21 timeframes to be displayed Watcher mode: Multi Pairs User is able to select any number of pairs/symbols User is able to select up to 21 timeframes to be displayed This mode uses one of the standard indicators
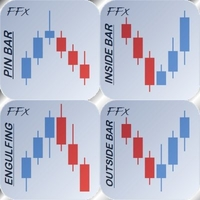
FFx Patterns Alerter gives trade suggestions with Entry, Target 1, Target 2 and StopLoss .... for any of the selected patterns (PinBar, Engulfing, InsideBar, OutsideBar) Below are the different options available: Multiple instances can be applied on the same chart to monitor different patterns Entry suggestion - pips to be added over the break for the entry 3 different options to calculate the SL - by pips, by ATR multiplier or at the pattern High/Low 3 different options to calculate the 2 TPs -
FFx Basket Scanner MT5
Eric Venturi-Bloxs
MetaTrader 4 version available here : https://www.mql5.com/en/market/product/24881 FFx Basket Scanner is a global tool scanning all pairs and all timeframes over up to five indicators among the 16 available. You will clearly see which currencies to avoid trading and which ones to focus on. Once a currency goes into an extreme zone (e.g. 20/80%), you can trade the whole basket with great confidence. Another way to use it is to look at two currencies (weak vs strong) to find the best single pairs
MetaTrader 4 version available here: https://www.mql5.com/en/market/product/25793 FFx Pivot SR Suite PRO is a complete suite for support and resistance levels. Support and Resistance are the most used levels in all kinds of trading. Can be used to find reversal trend, to set targets and stop, etc. The indicator is fully flexible directly from the chart 4 periods to choose for the calculation: 4Hours, Daily, Weekly and Monthly 4 formulas to choose for the calculation: Classic, Camarilla, Fibonac
ClassicSBA
Umri Azkia Zulkarnaen
this indicator very simple and easy if you understand and agree with setup and rule basic teknical sba you can cek in link : please cek my youtube channel for detail chanel : an for detail info  contact me  basicly setup buy (long) for this indicator is Magenta- blue and green candle or magenta - green  and green candlestik and for setup sell (short) is Black - yellow - and red candle or black - red  and red candlestik
WanaScalper
Isaac Wanasolo
1 (1)
A scalping indicator based on mathematical patterns, which on average gives signals with relatively small SL, and also occasionally helps to catch big moves in the markets (more information in the video) This indicator has three main types of notifications: The first type warns of a possible/upcoming signal on the next bar The second type indicates the presence of a ready signal to enter the market/open a position The third type is for SL and TP levels - you will be notified every time price re
Индикатор Coefficient Of Determination (COD) представляет собой значение коэффициента детерминации или квадрат коэффициента корреляции между зависимой переменной — ценой и объясняющей переменной — тиковым объемом. Что это дает нам на практике? COD отлично распознает кульминацию трендовых движений, что позволяет подбирать оптимальные точки и ловить развороты рынка. Как использовать индикатор: Наиболее популярная торговая стратегия строится совместно с трендовым индикатором Moving Average (MA), пе
Recommended TimeFrame >= H1. 100% Non Repainted at any moment.  Use it carefully, only with Trend Direction. Trading Usage: 2 Variants: as Range System or as BreakOut System (Both Only With Trend Direction)::: (Always use StopLoss for minimise Risk); [1] as Range System: (Recommended) in UP TREND:  - BUY in Blue Line , then if price goes down by 50 points (on H1) open Second BUY.   Close in any Profit you wish: TrailingStop(45 points) or Close when Price touches upper Gold Line. in DOWN TREND
作者的更多信息
概述 这款 MT5 指标创建了一个专业的交易仪表盘,可同时分析三个时间框架(M15、H1、H4)的四个关键技术指标,通过汇聚分析识别高胜率的交易机会。 1. EMA(指数移动平均线)趋势分析 2. RSI(相对强弱指数)动量分析 3. ATR(平均真实波动范围)波动率分析 4. CDL(K 线形态分析) 移动友好设计 核心理念: 汇聚交易 当来自不同时间框架的多个技术指标汇聚并指向相同的方向时,就会发生汇聚交易。与单一指标或单一时间框架分析相比,这显著提高了交易概率。 强势看涨汇聚示例: M15:EMA↑、RSI↑、高波动、看涨蜡烛图 = 看涨倾向 H1:EMA↑、RSI↑、正常波动、中性蜡烛图 = 看涨倾向 H4:EMA↑、RSI↑、低波动、看跌蜡烛图 = 中性倾向 结果:2/3 个时间帧看涨 = 高概率做多 技术指标分析 1. EMA(指数移动平均线)趋势分析 目的:确定主要趋势方向 方法:双 EMA 系统,并带有价格位置确认 信号生成: 看涨 (↑):价格 > 快速 EMA 且快速 EMA > 慢速 EMA 看跌 (↓):价格 < 快速 EMA 且快速 EMA < 慢
多重背离 MTF 指标 (MT5) 在强势反转发生前识别 多重背离 MTF 是一款先进的背离检测工具,专为需要多时间框架确认和实时警报的专业交易者而设计。 与仅支持单一震荡指标的标准背离指标不同,该工具会同时扫描 RSI、MACD 和随机指标,然后使用最多 6 个更高的时间框架确认信号。结果如何?为剥头皮交易、日内交易和波段交易提供更强大、更清晰、更可靠的背离设置。 主要特点 多时间框架确认 最多支持 6 个更高的时间框架(M5/M15/M30/H1/H4/D1)。 过滤噪音,仅交易与大趋势一致的背离信号。 常规背离和隐藏背离 常规背离 → 预测趋势反转。 隐藏背离 → 预测趋势的延续。 所有信息均以清晰的箭头直接标记在您的图表上。 多指标威力 检测以下指标的背离: • RSI(动量强度) • MACD(趋势与动量) • 随机指标(超买/超卖) 智能警报系统 实时 MT5 弹窗警报 内置冷却过滤器,有效过滤垃圾邮件 警报信息包含时间周期确认信息,提升您的交易信心 清晰的视觉效果 黄绿色 ↑ → 看涨背离 红色 ↓ → 看跌背离 蓝色 ↑ → 隐藏看涨
黄金多时间多背离 EA (7 个月内从 200 美元涨至 1000 美元) 黄金多时间多背离 EA 是一款专业级的 MT5 交易系统,旨在精准捕捉高概率反转和趋势延续。 它专门针对黄金 (XAUUSD) 进行了优化,但也能无缝衔接外汇、指数和加密货币。 策略概述 这款 EA 将价格行为与多个时间范围内的 RSI 和 MACD 背离相结合,以检测早期的市场转折点。当两个指标都确认背离时,EA 会自动进行交易,并采用严谨的风险管理方法。 主要特点 多时间框架背离引擎——同时扫描 5 分钟、15 分钟、30 分钟、1 小时、4 小时和 1 日的背离。 双指标确认 – 仅当 RSI 和 MACD 背离一致时才入场。 针对黄金 (XAUUSD) 优化 – 旨在捕捉黄金的波动性和盈利走势。 智能资金管理 – 可选择固定手数或按账户余额动态设定风险。 自动止损和止盈 – 每笔交易均受止损和止盈保护。 点差和余额保护 – 避免在不利条件下交易。 免提交易 – 一次连接,即可全天候扫描并执行。 为什么选择这款 EA? 专为追求精准度和自动化的黄金交易者打
每周和每日 OHLC 水平线 — 再也不会错过关键价格区域 无需再猜测市场走势。此指标会自动在您的图表上绘制机构交易员、银行和精明投资者每天关注的最重要价格水平线,无需任何手动操作。 您将获得 每次打开图表,您都会立即看到: 4 个每周水平线 — 上周的开盘价、收盘价、最高价和最低价 4 个每日水平线 — 前一天的开盘价、收盘价、最高价和最低价 清晰的颜色编码 — 每周水平线为蓝色,每日水平线为白色,让您始终清楚自己正在查看的内容 清晰的价格标签 — 每个水平线都标有准确的价格,直接显示在图表上 这些水平线为何重要 上周和前一天的 OHLC 水平线是专业交易中最受关注的价格区域之一。银行和机构会在这些水平线附近下单。价格经常: 在前一周/前一天的高点和低点附近反转 在前一交易日的开盘价和收盘价附近盘整 突破并重新测试这些区域后继续上涨 无论您交易外汇、黄金、指数还是加密货币,这些价位都适用于所有市场。 专为专业交易者打造 适用于任何时间周期——H1、H4、M15 及以下 始终精准——仅从完全闭合的K线中提取,绝不重绘 每根新K线自动更新—
# MT5 多时间框架蜡烛图收盘计时器 使用**多时间框架蜡烛图收盘计时器**,掌握市场先机。这款简洁强大的 MetaTrader 5 指标专为依赖蜡烛图时机和精准入场的交易者而设计。 该指标可同时显示多个时间框架的实时倒计时,帮助您精准追踪每根蜡烛图的收盘时间,无需切换图表。 ## 功能 * 实时蜡烛图收盘倒计时 * 支持多种时间周期: * M5 * M15 * M30 * H1 * H4 * H6 * H12 * 日线 * 周线 * 月线 * 简洁轻便的图表显示 * 颜色编码的警告系统: * 正常倒计时 * 警告模式 * 关键最后几秒 * 蜡烛图收盘前推送通知和弹出提醒 * 完全可自定义: * 颜色 * 字体 * 面板位置 * 提醒时间 * 优化低 CPU 占用率 * 适用于任何交易品种和经纪商 ## 完美适用于 * 超短线交易者 * 日内交易者 * 智能资金概念交易者 * 信息通信技术交易者 * 突破交易者 * 多时间周期分析师 * 新闻交易者 ## 为什么使用它? 蜡烛图收盘时刻对于基于确认的交易策略至
Volatility Meter all time
Gazi Mahmudur Rahman
波动率指标 MT5 — 高级实时市场波动率仪表盘 将原始 ATR 数据转化为适用于 MetaTrader 5 的强大可视化波动率智能系统。 波动率指标 MT5 是一款专业级波动率分析指标,专为希望在入场交易前快速识别平静、活跃、高风险和爆发性市场状况的交易者而设计。 该工具采用先进的 ATR 比较逻辑、历史波动率分析和智能警报系统,使交易者能够直接在图表上实时查看市场强度。 主要功能 实时波动率仪表盘 简洁现代的图表面板显示: 当前 ATR 波动率 长期基准 ATR 波动率比率比较 历史最高 ATR 实时市场状况 所有数据均实时自动更新。 智能波动率检测 该指标将短期ATR与长期ATR均值进行比较,以检测: 低波动率 正常市场状况 活跃市场 高波动率 极端市场波动 完美适用于: 短线交易者 日内交易者 波段交易者 新闻交易者 波动率突破策略 历史市场分析 与基础ATR指标不同,波动率计会扫描历史市场数据,以确定: 历史ATR最高值 平均波动率水平 相对市场强度 罕见波动率峰值 这有助于交易者了解当前市场走势是正常还是历史
适用于 MT5 的 4 倍标准差通道 使用适用于 MetaTrader 5 的 4 倍标准差通道指标,将您的图表转化为专业的机构交易空间。 这款高级指标将动态回归通道、多级波动区域、可自定义移动平均线以及强大的高时间框架支撑/阻力位整合到一个简洁且高度可定制的工具中。 对于希望精准识别趋势方向、波动扩张、溢价/折价区域以及高概率反转区域的交易者而言,这款指标堪称完美之选。 主要功能 高级标准差通道 自动绘制智能线性回归趋势通道 价格上下最多 4 个偏差级别 检测波动扩张和过度扩张的市场状况 可选通道左右延伸,用于未来预测 实时趋势斜率分析 多级波动区域 +1 / -1 偏差 +2 / -2 偏差 +3 / -3 偏差 +4 / -4 偏差 快速识别: 趋势延续区域 均值回归机会 耗尽区域 机构价格极值 内置移动平均线套件 支持多种移动平均线类型: SMA EMA WMA SMMA / RMA HMA DEMA TEMA 包含多达 6 条完全可自定义的移动平均线,可调节以下参数: 长度 类型 颜色 可见性 适用于: 趋势过滤
筛选:
无评论
回复评论