Scalper RS
- 指标
- 版本: 1.0
- 激活: 10

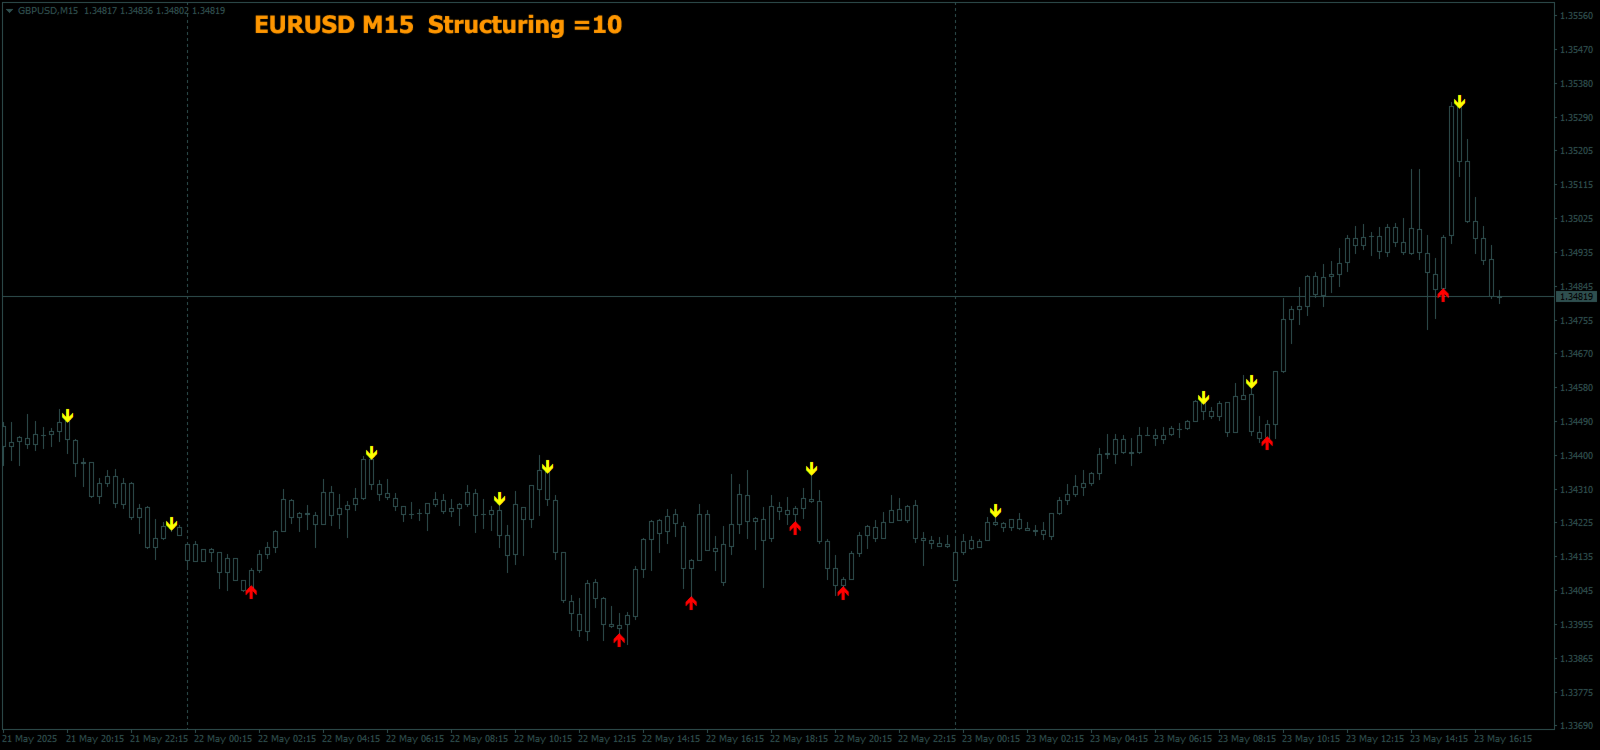
Scalper RS - 是一种交易和分析指标,旨在识别价格图上最可能的反转点。
执行价格构建的指标算法允许您确定各种交易工具和时间范围内的价格反转组合。
使用变量参数“Structuring”,您可以为所需的交易图表和时间范围选择最佳设置。
最初,该指标是为了接收时间范围 M1 - M5 - M15 上的信号而创建的,但通过选择必要的参数,它可以配置为识别时间范围 H1 - H4 - D1 上的长期趋势。
执行价格构建的指标算法允许您确定各种交易工具和时间范围内的价格反转组合。
使用变量参数“Structuring”,您可以为所需的交易图表和时间范围选择最佳设置。
最初,该指标是为了接收时间范围 M1 - M5 - M15 上的信号而创建的,但通过选择必要的参数,它可以配置为识别时间范围 H1 - H4 - D1 上的长期趋势。
- 适合剥头皮交易和短期交易。
- 信号箭头可以不重绘或可以重绘(可切换参数)工作。
- 所有信号均出现在蜡烛收盘时。
- 有几种类型的通知。
- 指标信号可用于顺势而为,也可逆势而为。
- 该指标可以作为单独的系统使用,也可以作为现有趋势交易系统的补充。