Scalper RS
- 지표
- 버전: 1.0
- 활성화: 10

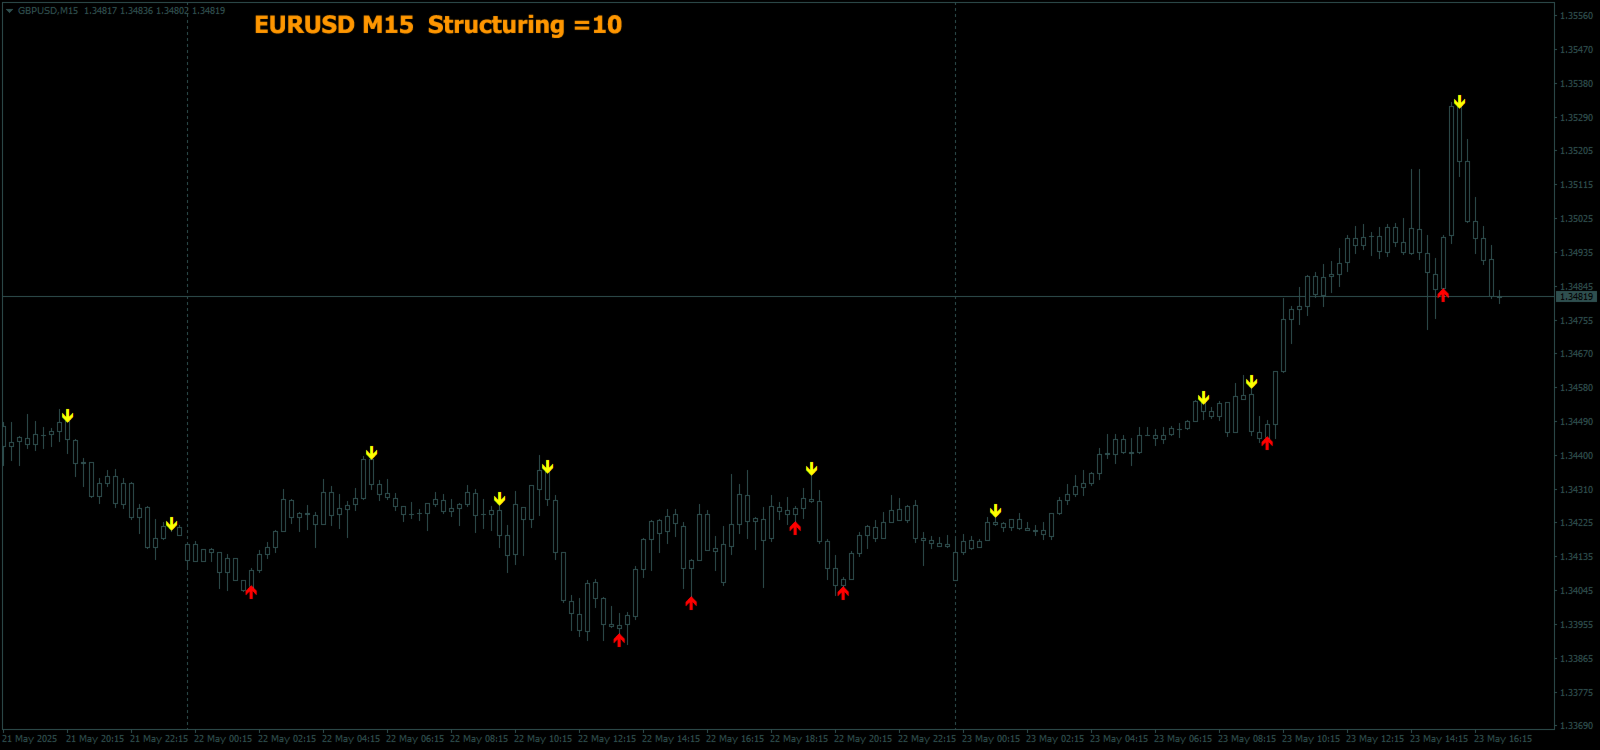
Scalper RS - 은 가격 차트에서 가장 가능성 있는 반전 지점을 식별하도록 설계된 거래 및 분석 지표입니다.
가격 구조를 구성하는 지표 알고리즘을 사용하면 다양한 거래 수단과 시간 프레임에 대한 가격 반전 조합을 결정할 수 있습니다.
가변 매개변수 "Structuring"를 사용하면 원하는 거래 차트와 시간 범위에 맞는 최적의 설정을 선택할 수 있습니다.
처음에는 이 지표가 M1~M5~M15 시간대에서 신호를 수신하도록 만들어졌지만, 필요한 매개변수를 선택하면 H1~H4~D1 시간대에서 장기 추세를 식별하도록 구성할 수 있습니다.
가격 구조를 구성하는 지표 알고리즘을 사용하면 다양한 거래 수단과 시간 프레임에 대한 가격 반전 조합을 결정할 수 있습니다.
가변 매개변수 "Structuring"를 사용하면 원하는 거래 차트와 시간 범위에 맞는 최적의 설정을 선택할 수 있습니다.
처음에는 이 지표가 M1~M5~M15 시간대에서 신호를 수신하도록 만들어졌지만, 필요한 매개변수를 선택하면 H1~H4~D1 시간대에서 장기 추세를 식별하도록 구성할 수 있습니다.
- 스캘핑과 단기 거래에 적합합니다.
- 신호 화살표는 다시 그리지 않고도 작동할 수도 있고, 다시 그릴 수 있는 가능성(전환 가능한 매개변수)이 있습니다.
- 모든 신호는 캔들 마감 시점에 나타납니다.
- 알림에는 여러 유형이 있습니다.
- 지표 신호는 추세 방향으로 사용할 수도 있고 추세 반대 방향으로 사용할 수도 있습니다.
- 이 지표는 별도의 시스템으로 사용하거나 기존 추세 거래 시스템에 추가하여 사용할 수 있습니다.