Scalper RS
- インディケータ
- バージョン: 1.0
- アクティベーション: 10

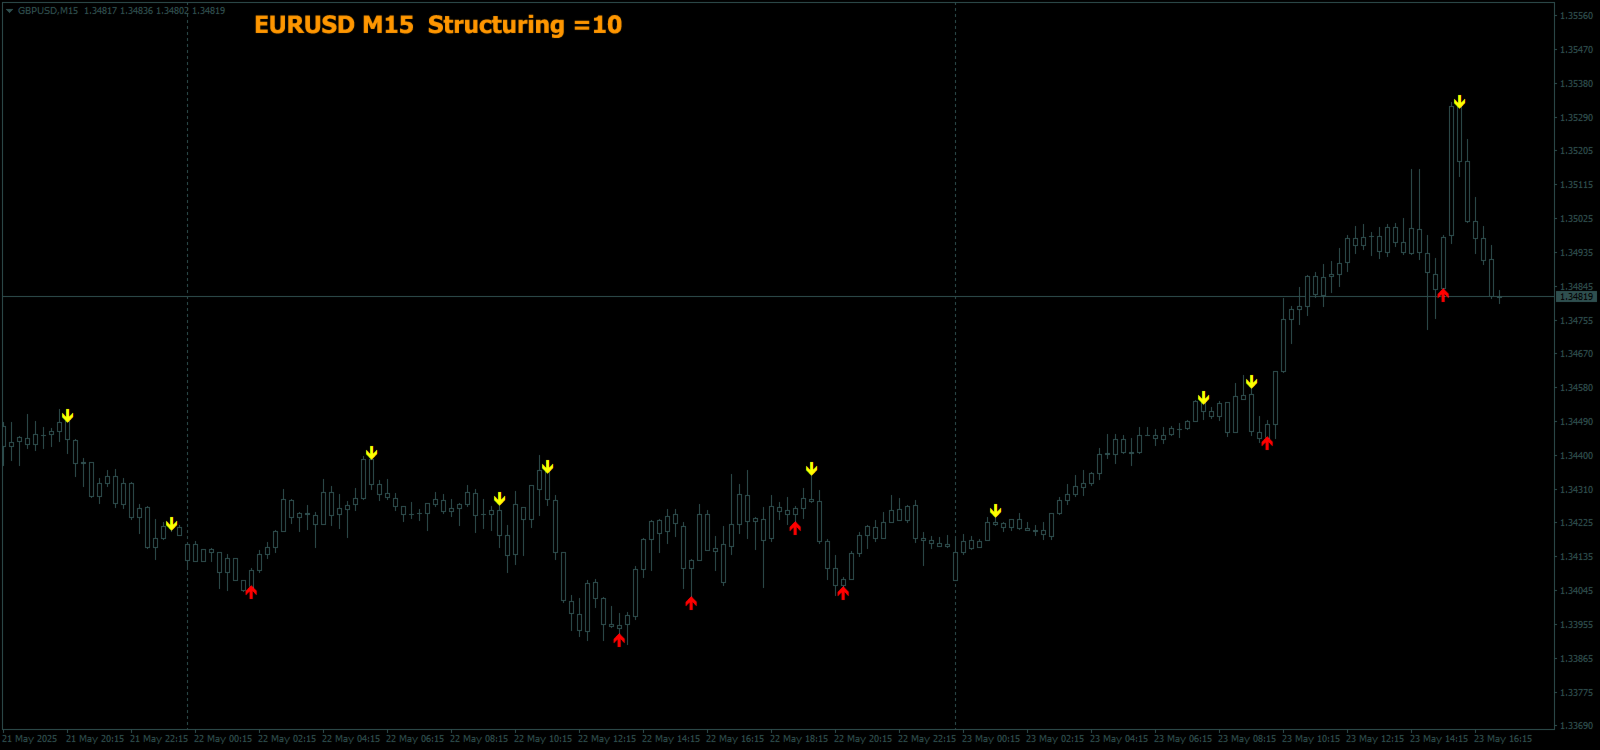
Scalper RS - は、価格チャート上で最も可能性の高い反転ポイントを識別するように設計された取引および分析インジケーターです。
価格構造化を実行するインジケーター アルゴリズムにより、さまざまな取引商品と時間枠での価格反転の組み合わせを決定できます。
可変パラメータ「Structuring」を使用すると、希望する取引チャートと時間枠に最適な設定を選択できます。
当初、このインジケーターは M1 - M5 - M15 の時間枠でシグナルを受信するために作成されましたが、必要なパラメータを選択することで、H1 - H4 - D1 の時間枠で長期トレンドを識別するように構成できます。
価格構造化を実行するインジケーター アルゴリズムにより、さまざまな取引商品と時間枠での価格反転の組み合わせを決定できます。
可変パラメータ「Structuring」を使用すると、希望する取引チャートと時間枠に最適な設定を選択できます。
当初、このインジケーターは M1 - M5 - M15 の時間枠でシグナルを受信するために作成されましたが、必要なパラメータを選択することで、H1 - H4 - D1 の時間枠で長期トレンドを識別するように構成できます。
- スキャルピングや短期取引に適しています。
- 信号矢印は、再描画なしでも、再描画ありでも動作できます (切り替え可能なパラメータ)。
- すべてのシグナルはローソク足の終値に表示されます。
- 通知にはいくつかの種類があります。
- インジケーターシグナルはトレンドの方向にも、それに逆らう方向にも使用できます。
- このインジケーターは、独立したシステムとして使用することも、既存のトレンド取引システムへの追加として使用することもできます。