NAM Divergences
- 指标
- 版本: 1.5
- 更新: 16 五月 2021
- 激活: 10
MT4多時限發散和超買/超賣檢測指標。
特徵
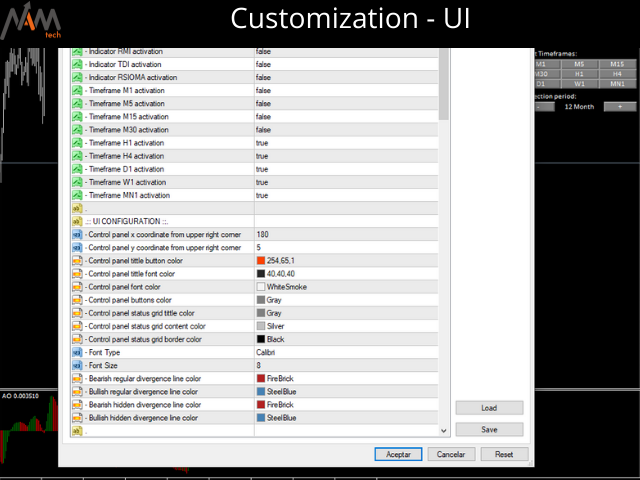
-在圖表控制面板上完全可自定義,提供完整的交互。
-隨時隨地隱藏和顯示控制面板。
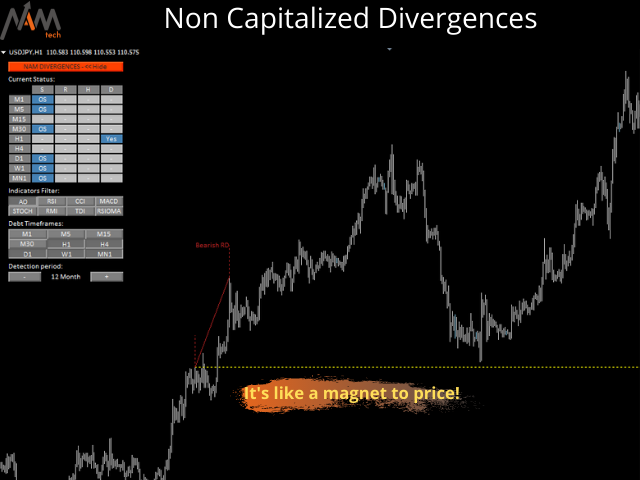
-有關非大寫差異的實時信息。
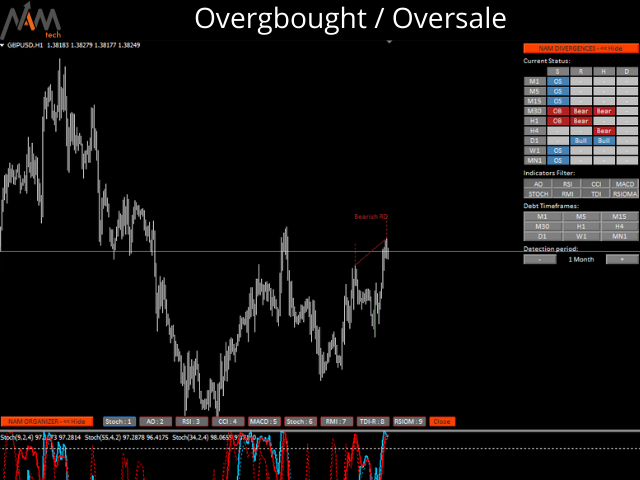
-有關超買/超賣情況的實時信息。
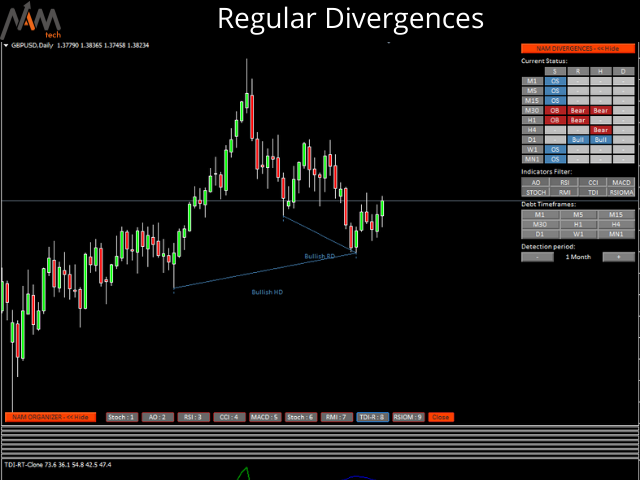
-有關規則差異的實時信息。
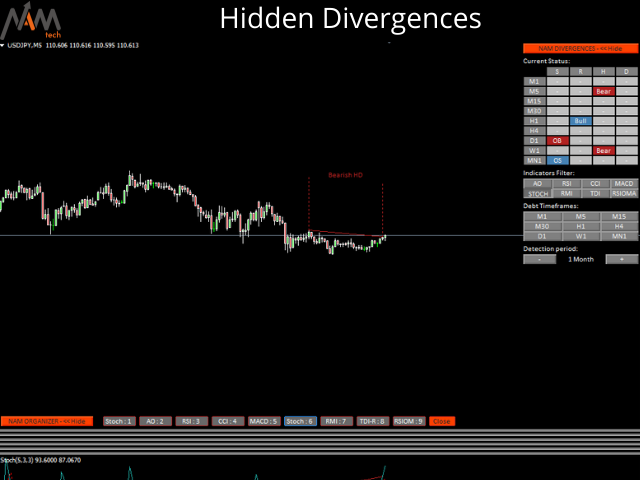
-有關隱藏分歧的實時信息。
-可用於發散檢測的振盪器:AO,RSI,CCI,MACD,STOCH,RMI,TDI,RSIOMA。
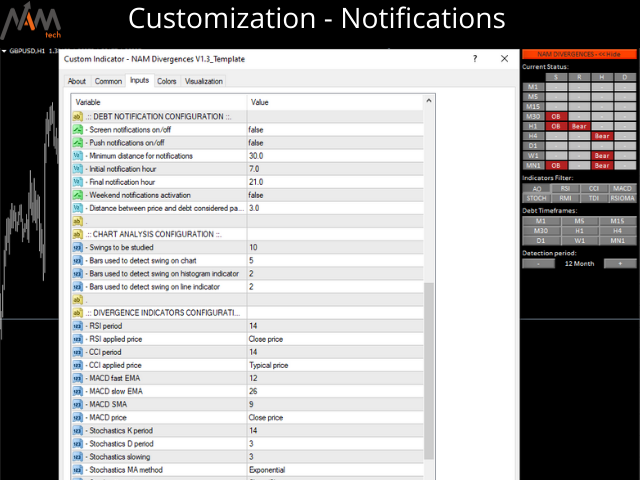
-通知服務(屏幕警報|推送通知)。
概括
使用差異交易有助於發現趨勢減弱或勢頭逆轉。有時,您甚至可以將其用作趨勢持續的信號。我們的工具在一個非常舒適和直觀的控制面板中同時提供所有時間範圍的差異檢測,並具有顯示和隱藏的可能性,以使您的圖表盡可能保持清潔。
您會在選擇的歷史時期實時看到超買和超賣情況,定期背離,隱藏背離和無資本背離。
對於沒有大寫字母的差異,我們會在屏幕上顯示MT4通知,並將通知推送到您的手機!

Muy completo y preciso... una pieza de relojería