RelicusRoad Pro

4.65
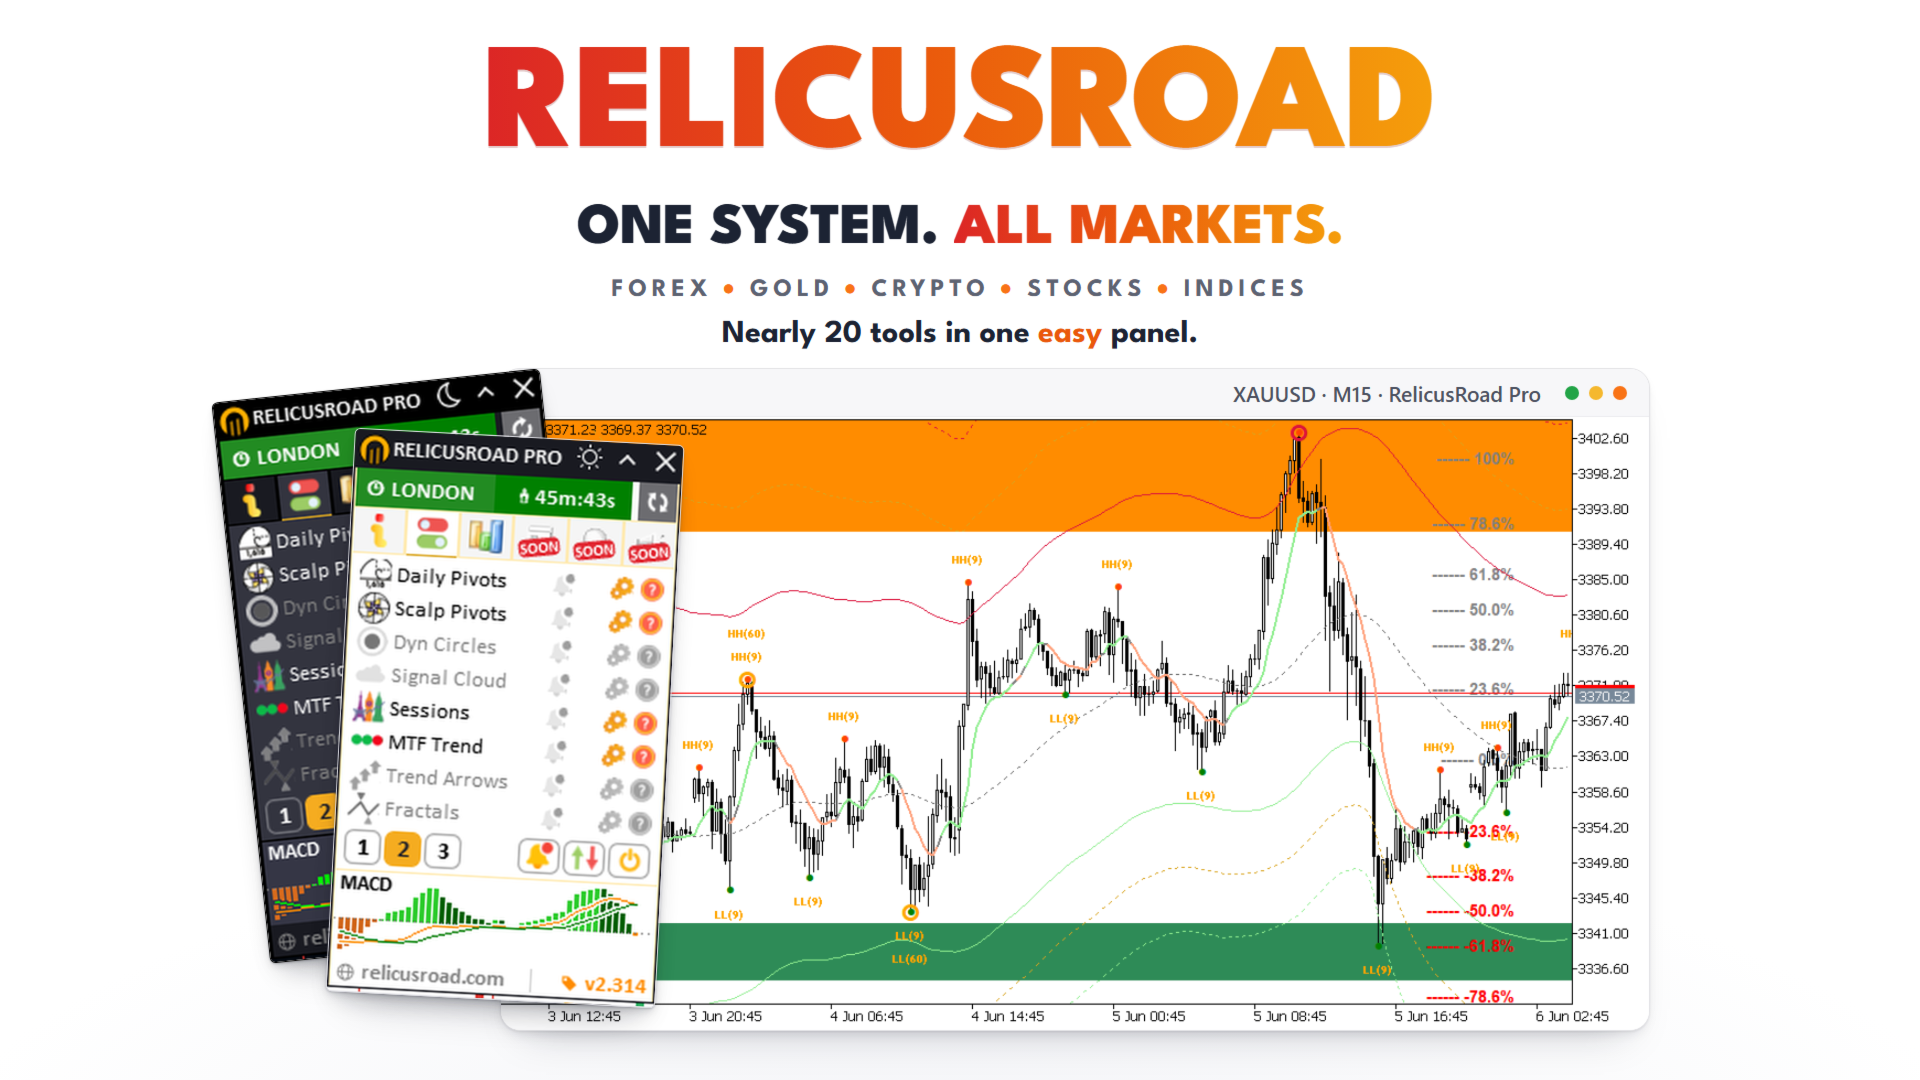
RelicusRoad Pro: 量化市场操作系统

终身访问限时 70% 折扣 - 加入 2,000+ 交易员社区

为什么大多数交易者即使拥有“完美”指标也会失败?

因为他们在真空中交易单一概念。没有背景的信号是赌博。要持续获胜,您需要共振 (CONFLUENCE)

RelicusRoad Pro 不是一个简单的箭头指标。它是一个完整的量化市场生态系统。它描绘价格运行的“公允价值之路”,区分市场噪音和真实的结构性突破。

停止猜测。开始用机构级“路”逻辑进行交易。

核心引擎:“Road” (路) 算法

系统的核心是 Road Algo,一个实时适应市场条件的动态波动率通道。它投射出安全线 (平衡) 和价格可能反转的扩展水平

  • Simple Road: 典型市场的标准结构映射。
  • Smooth Road: 针对震荡盘整的降噪计算。
  • Breakout Road: 专为识别波动率扩张和爆发性走势而调整。

1. 算法动量与确认

我们的“剥头皮箭头”不只是简单的交叉。它们利用高阶多项式逻辑过滤噪音,确保信号与主周期一致。我们检测动量、价格行为和 Road 结构汇聚的精确入场点。

2. 量化分析套件

访问通常保留给对冲基金的高级数学模型。包括统计离群值检测递归状态估计和基于幂律的分形分析

包含:用户手册 + 7 种行之有效的策略 + 视频培训 + 专属社区

工程功能列表 (19 合 1)

  • 验证订单流: 自动绘制机构订单块、公允价值缺口 (FVG) 和 SMC 流动性。
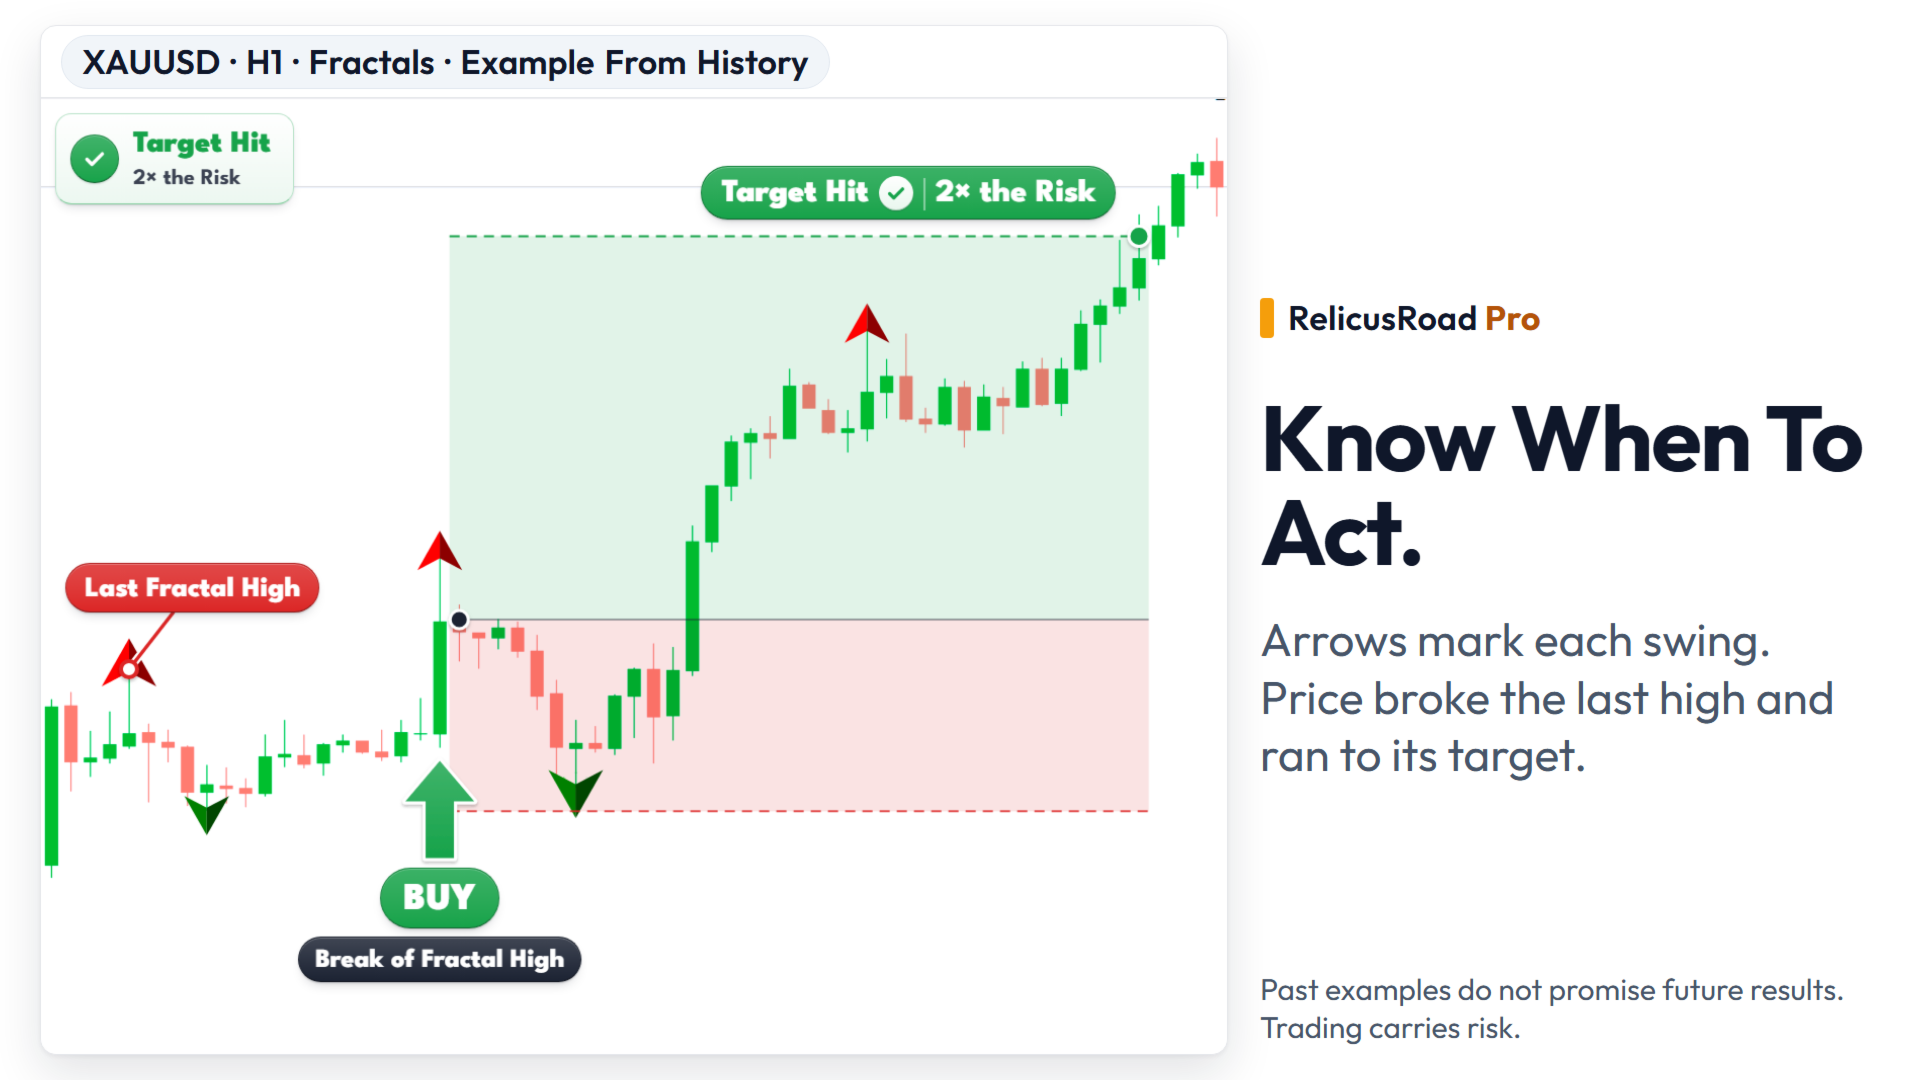
  • 智能支撑与阻力: 基于分形的区域分级 (已验证、翻转区、未测试)。
  • 分析扫描仪: 7 模式多策略扫描仪 (MACD, 反转, 趋势, SAR, 动量等)。
  • 趋势云: 视觉双 EMA 偏差过滤器,充当动态支撑/阻力。
  • 领先指标: 每日高/低预测和基于斐波那契的枢轴水平。
  • 模式识别: 自动扫描 10+ 种烛台模式 (吞没, 锤子线等),并带有成功率过滤。
  • 动态摆动: 识别结构性高点/低点,以进行精确的止损放置。
  • 会话地图: 可视化亚洲、伦敦和纽约会话以情境化波动率。

专业风险管理面板

保护您的资金。即时查看点差、手数、风险

“最好的投资。光是社区就值回票价。”验证用户

通用平台

一个许可证。在 MetaTrader 4 (MT4)MetaTrader 5 (MT5) 无缝运行。

点击‘购买’,即刻获得量化清晰度
评分 162
Erwin Fonke
646
Erwin Fonke 2025.09.05 06:45 
 

i am using this indicator in combination with a EA trading assistent. It,s absolute amazing. Almost passed my FTMO challange now. Great work man! Keep it up!

Juan Feliciano
1730
Juan Feliciano 2025.05.07 21:26 
 

great indicator. super clean and accurate entries. just want to know how to join discord pls

Manuel Gonzalez
170
Manuel Gonzalez 2025.02.16 14:46 
 

Good morning everyone. Please to the administrator and owner of the indicator. A few years ago I bought this wonderful indicator and wanted to make it work. There was a gentleman within discord who helped me a lot but due to my inexperience I did not understand the instructions well. Now I have acquired more experience and please would like to recover the accesses to: User Manual + Strategies + Training Videos + Private Group with VIP Access + Mobile Version Available (Separately) Please help me recover these accesses. Thank you very much...

推荐产品
Trend PA
Mikhail Nazarenko
5 (3)
The Trend PA indicator uses   Price Action   and its own filtering algorithm to determine the trend. This approach helps to accurately determine entry points and the current trend on any timeframe. The indicator uses its own algorithm for analyzing price changes and Price Action. Which gives you the advantage of recognizing, without delay, a new nascent trend with fewer false positives. Trend filtering conditions can be selected in the settings individually for your trading style. The indicator
限时优惠 “限时发布价格” “2.0版本后将涨价” Currencies Gold Momentum Flow Dashboard — 即刻洞察市场强弱 一款强大的多合一交易面板,实时显示外汇与黄金在多个时间周期(M5–D1)的动量。 多时间周期ROC分析 内置交易信号(趋势一致与动量变化) 货币强弱指标 热力图快速识别趋势 实时提醒 + 一键切换交易品种 无需来回切换图表 — 一个界面掌握整个市场。 像真正看懂市场一样交易 大多数交易者是“盲目的”。 他们不断切换图表… 追逐信号… 入场太晚…离场困惑。 这一切,到此为止。 看到别人看不到的机会 这不仅仅是一个指标。 这是一个“市场透视系统”,帮助你看到: 哪些交易对正在爆发 哪些货币正在主导市场 哪些高概率机会正在形成 为精准交易者打造 提前捕捉动量变化 确认多周期趋势一致 避免震荡行情 专注高质量机会 内置优势 智能信号系统 货币强弱分析 热力图分析 实时提醒 一键执行 彻底改变你的交易方式 交易什么 何时交易 哪个方向概率最高 ️ 大多
Binary Options Assistant (BOA) ICE Signals Indicator provides signals based on gkNextLevel Binary Options Strategy.  Indicators: 2 Bollinger Bands & Stochastic Stop missing trades, stop jumping from chart to chart looking for trade set-ups and get all the signals on 1 chart! U se any of the BOA Signals Indicator with the  Binary Options Assistant (BOA) Multi Currency Dashboard .   All BOA Signal Indicator settings are adjustable to give you more strategy combinations. The signals can be seen
FREE
PipFinite Exit EDGE
Karlo Wilson Vendiola
4.83 (115)
Did You Have A Profitable Trade But Suddenly Reversed? In a solid strategy, exiting a trade is equally important as entering. Exit EDGE helps maximize your current trade profit and avoid turning winning trades to losers. Never Miss An Exit Signal Again Monitor all pairs and timeframes in just 1 chart www.mql5.com/en/blogs/post/726558 How To Trade You can close your open trades as soon as you receive a signal Close your Buy orders if you receive an Exit Buy Signal. Close your Sell orders if
斐波那契折返和扩展画线工具 适用于MT4平台的斐波那契折返和扩展画线工具,适合于使用黄金分割交易的交易者 优点:没有多余的线,没有过长的线,易于观察发现交易的机会 试用版: https://www.mql5.com/zh/market/product/35884 主要功能: 1.可以直接画出多组斐波那契折返,可以看出重要折返点之间的关系; 2.可以画出斐波那契扩展,比率有三种0.618,1,1.618 3.画出的斐波那契折返和扩展均可左右移动,有数值显示,方便观察 4.可通过数字键切换周期 使用指南和功能键: 1.按 [ 或R画折返,按需要画折返,最多云持8组折返; 2.按 ] 或E画扩展; 3.按 \ 删除当前周期下的所有扩展和折返,其余周期的不受影响 4.如何左右移动折返和扩展 (1)点击第一组折返的F5字符,可以左右移动折返; (2)点击COP的字符 ,可以左右移动扩展; 5. (1)点击第一组折返的F5字符,按del 可以删除这组折返; (2)点击COP的字符, 按del 可以删除这组扩展; 6.修改折返和扩展(随着市场的运行,焦点或者反弹点需要修改)
EARLY REMINDER: The Starting price is 65 price will rise soon up to 365$ and then 750$ after first 10 copies of sales. Grab this offer now! Introduction Hello, traders! Welcome to the demonstration of the Forex Beast Indicator , a comprehensive tool designed to assist aspiring traders in navigating the complexities of the forex market. This indicator incorporates seven essential components to provide a well-rounded trading experience: Moving Averages Colored Zones Support and Resistance Levels
Forex Gump
Andrey Kozak
2.4 (5)
Forex Gump is a fully finished semi-automatic trading system. In the form of arrows, signals are displayed on the screen for opening and closing deals. All you need is to follow the instructions of the indicator. When the indicator shows a blue arrow, you need to open a buy order. When the indicator shows a red arrow, you need to open a sell order. Close orders when the indicator draws a yellow cross. In order to get the most effective result, we recommend using the timeframes H1, H4, D1. There
Price Magnets
Ivan Simonika
Price Magnet — Price Density and Attraction Levels Indicator Price Magnet is a professional analytical tool designed to identify key support and resistance levels based on statistical Price Density. The indicator analyzes a specified historical period and detects price levels where the market spent the most time. These zones act as “magnets,” attracting price action or forming a structural base for potential reversals. Unlike traditional Volume Profile tools, Price Magnet focuses on price-time d
Good Signal
Yaroslav Varankin
The indicator is designed for binary options and short-term transactions on Forex To enter a trade when a signal appears blue up arrow buy red down arrow sell signal For Forex enter on a signal exit on the opposite signal or take profit For binary options Enter on 1 candle, if the deal goes negative, set a catch on the next candle Works on all timeframes If you apply a filter like Rsi, you will get a good reliable strategy.. The algorithm is at the stage of improvement and will be further develo
VR Cub
Vladimir Pastushak
VR Cub 这是获得高质量切入点的指标。该指标的开发是为了促进数学计算并简化对仓位入场点的搜索。多年来,该指标所针对的交易策略已被证明其有效性。交易策略的简单性是其巨大的优势,即使是新手交易者也能成功进行交易。 VR Cub 计算开仓点以及获利和止损目标水平,这显着提高了效率和易用性。查看使用以下策略进行交易的屏幕截图,了解简单的交易规则。 设置、设置文件、演示版本、说明、问题解决,可以从以下位置获取 [博客] 您可以在以下位置阅读或撰写评论 [关联] 版本为 [MetaTrader 5] 计算入场点的规则 开仓 要计算入场点,您需要将 VR Cub 工具从最后一个高点拉伸到最后一个低点。 如果第一个点在时间上早于第二个点,交易者等待柱线收于中线上方。 如果第一个点在时间上晚于第二个点,交易者等待柱线收于中线下方。 根据上述条件,严格在 柱线收盘 后建仓。 换句话说,如果我们在小时图上进行交易,那么从最高点到最低点的时间距离必须超过24小时,最高点和最低点之间的点数必须大于或等于平均价格变动每天。 维持和改变市场地位 可以有多个未平仓头寸;每个头寸都可以单独修改。 VR Cub
该指标建立了趋势线的扇形(在单击某个蜡烛之后),类似于经典的江恩角。该指标的特点是它不仅在固定比例上构建角度,而且还使用一定数量柱线的平均价格(可选)。 有两种方法可以计算指标中角度的平均价格(可选): 1) 计算从高到低的平均价格变动(对于一定数量的柱); 2) 计算从开盘到收盘的平均价格变动; 选项: 1.Method——构造角的方法; 2. FixedScale - 固定比例(如果在Method中选择了Fixed_Scale); 3. SecondaryAngles - 控制绘制次角的权限; 4. RayRight - 为趋势线设置射线; 5. DrawBackground - 画线作为背景; 6. AnglesQuantity——角度数; 7. Bars_To_Process - 周期,柱的数量,在此基础上确定平均价格,角度的“速度”。如果为零或更低,则根据所有历史数据计算; 8. RisingMainAnglesClr、RisingSecondaryAnglesClr、FallingMainAnglesClr、FallingSecondaryAngl
Royal Dutch Skunk
Sayan Vandenhout
ROYAL DUTCH SKUNK USES THE TREND WAVE INDICATOR AND IT CAN IDENTIFY THE BEGINNING AND THE END OF A NEW WAVE TREND MOVEMENT. AS AN OSCILLATOR, THE INDICATOR IDENTIFIES THE OVERBOUGHT AND OVERSOLD ZONES. IT WORKS GREAT TO CATCH THE SHORT TERM PRICE REVERSALS AND USES A MARTINGALE STRATEGY TO CLOSE ALL TRADES IN PROFIT. USE DEFAULT SETTINGS ON H1 OR HIGHER TIME FRAME ON ANY PAIR FOR MORE ACCURATE TRADES WHY THIS EA : Smart entries calculated by 6 great strategies The EA can be run on even a $20000
Quantum Balance
Adolfina Denysenko
Quantum Balance is a modern arrow indicator that identifies key price reversal points in the market with high accuracy. It is based on a combination of WPR (Williams %R) and RSI (Relative Strength Index), which allows you to identify overbought/oversold moments and enter trades at points of maximum potential. The indicator analyzes price dynamics and market conditions, generating signals only when several confirming factors coincide. This reduces the number of false signals and increases tradin
Introducing the "Magic Trades" for MetaTrader 4 – your ultimate tool for precision trading in dynamic markets. This innovative indicator revolutionizes the way you perceive market trends by harnessing the power of advanced analysis to detect subtle changes in character, paving the way for optimal trading opportunities. The Magic Trades Indicator is designed to empower traders with insightful entry points and well-defined risk management levels. Through its sophisticated algorithm, this indicato
Binary Fx System
Yaroslav Varankin
This tool was developed and designed for binary options trading It has been noticed that it can also be used in stock markets and forex. There are 2 options for trading binary options using this indicator Option 1 We open a deal on the next candle after a signal for one cut of the current period Buy or Sell depending on the signal The blue up arrow is Buy The red down arrow is Sell / We enter only on the first signal on the next candle and ignore the rest / Option 2 We enter on a signal for the
The Serpent Rider Binary Options
Ellan Dirgantara Tholkhah
Embark on the pinnacle of Binary Options evolution. Our indicator isn't just adaptive—it's relentless. Picture a ninja riding a serpent, shadowing its every move; that's how this tool trails the market trend, unwavering till the end. Built upon the foundational prowess of the Ichimoku indicator and honed with an array of fine-tuned oscillators, it epitomizes accuracy and precision. Dive deep without getting lost in the Ichimoku's intricacies—our indicator simplifies the process for you. Perhaps
“动态剥头皮震荡指标”是一款高级自定义加密货币外汇指标,适用于 MT4 平台,高效交易! ............................................................................................................ - 新一代震荡指标 - 参见图片了解如何使用。 - 动态剥头皮震荡指标具有自适应超卖/超买区域。 - 震荡指标是一款辅助工具,可从动态超卖/超买区域找到准确的入场点。 - 超卖值:低于绿线,超买值:高于橙线。 - 该指标也非常适合与价格行为模式结合使用。 - 它比标准震荡指标更精准。 - 提供 PC 和移动端警报。 ................................................... 点击这里查看高质量的交易机器人和指标! 本产品为原创,仅在 MQL5 网站上提供。
我们为您提供一个指标"蜡烛收盘台",它将成为您在贸易领域不可或缺的助手。 这就是为什么知道蜡烛何时关闭会有所帮助的原因: 如果你喜欢使用蜡烛花纹进行交易,你就会知道蜡烛何时关闭。 此指标将允许您检查是否形成了已知模式以及是否存在交易的可能性。 该指标将帮助您做好市场开放和市场关闭的准备。 可以设置一个计时器来创建计划新闻的预览,这样就可以检查市场对此的反应。 您可以设置指示灯,以便在蜡烛关闭前几秒钟发送警报/警告。 通知/警报/警报可以发送到: 屏幕警报 电子邮件 移动应用 MT4烛台计时器指示器为什么有用 那么烛台计时器什么时候有用呢?如果你长期交易,你可能不需要蜡烛计时器指示器,因为你的参赛不会受到一分钟或一小时的太大影响。但是,如果你在短时间内是黄牛或交易员,那么你知道时机非常重要。 外汇市场24小时开放,只在周末关门,有些策略可能会受到您入仓时出现错误时机的严重影响。 MT4蜡烛计时器指示器可以显示当前蜡烛中的剩余时间,以便为下一次蜡烛打开做好准备。 可以从这一指标中受益的一些情况例子有: 预定消息传出 地理市场开闭 预定发生的事件,通常是金融、经济或政治事件
PipFinite Reversal PRO
Karlo Wilson Vendiola
4.84 (177)
The Controversial 5-Step System That Professional Traders Use To Unlock Trading Success! Reversal Pro effectively combines price action, ideal location and reliable statistics in one smart algorithm. Understanding the market in this unique perspective allows you to recognize reversals professionally. Discover The Secret Of Professional Traders Get instant access www.mql5.com/en/blogs/post/716077 Copy & Paste what professional traders are doing right now! How To Trade Step 1: Trade Setup Sta
This is an arrow indicator without a future function,developed based on the most advanced profit trading algorithms.It has the most innovative and advanced dual trend analysis module, as well as the latest and highly effective market trend prediction algorithm.Trends are your friends, and following larger trends can earn the maximum profit in foreign exchange. This indicator helps traders identify current trends and track them. Someone once made a profit of 10 times in a week by relying on it.No
The Binary Profit Maker,  This indicator works on MT4 and is very easy to use. When you receive a signal from it, you wait for that candle with the signal to close and you enter your trade at the beginning of the next new candle . A Up Purple arrow means Buy and a Down Purple arrow means Sell. All arrows comes with Alert  like for easy identification of trade signal. Are you okay with that? How To Enter Trade? 1 minute candle 1 minute expire
TT Arrows
Tomislav Turcin
TT Arrows is a trend based indicator that very succesfully predicts the start of the new trend.  The indicator is working with all trading instruments and in M5, M15, H1 and H4 timeframes. Up arrow signals a good time to enter a bullish trade while down arrow signals a good time to enter a bearish trade. The trade should be taken when the candle that has the arrow is closed. Following this strategy you will have have a high percentage of winning trades. Enjoy!
Naomi Binary Options
Yaroslav Varankin
The indicator is designed for trading binary options on small timeframes up to 15 m Easy to use does not need additional settings and can be used without additional filters Recommendations for trading When a signal appears (blue arrows pointing up), you need to consider the buy direction When a signal appears (the red line indicates the bottom), you need to consider the direction to sell To conclude a deal is on the candle where the signal for one candle came, if the signal turned out to be unpr
Signal From Level
Yaroslav Varankin
Binary Options Support Resistance Indicator This indicator is designed for binary options trading and effectively shows retracements from support and resistance levels. Signals appear on the current candle. A red arrow pointing downwards indicates a potential selling opportunity, while a blue arrow pointing upwards suggests buying opportunities. All that needs adjustment is the color of the signal arrows. It is recommended to use it on the M1-M5 timeframes as signals are frequent on these timef
Gold Bricks FX Gold
Sayan Vandenhout
Gold Bricks FX USES THE TREND WAVE INDICATOR AND IT CAN IDENTIFY THE BEGINNING AND THE END OF A NEW WAVE TREND MOVEMENT. AS AN OSCILLATOR, THE INDICATOR IDENTIFIES THE OVERBOUGHT AND OVERSOLD ZONES. IT WORKS GREAT TO CATCH THE SHORT TERM PRICE REVERSALS AND USES A MARTINGALE STRATEGY TO CLOSE ALL TRADES IN PROFIT. USE DEFAULT SETTINGS ON H1 OR HIGHER TIME FRAME ON ANY PAIR FOR MORE ACCURATE TRADES WHY THIS EA : Smart entries calculated by 4 great strategies The EA can be run on even a $300
Quantum Falcon Signal Free is a smart visual trading indicator for MetaTrader 4 designed for Forex and Gold traders. The indicator combines: • Trend analysis • RSI momentum confirmation • MACD momentum filtering • ATR volatility filtering • Higher timeframe confirmation • Smart exit signal detection Main Features: • Smart Buy and Sell signals • Exit Buy / Exit Sell alerts • Real-time dashboard on chart • Professional candle arrows • Multi-timeframe trend confirmation • ATR market volatility filt
FREE
Mast
Sergei Zakhariia
The MT4 trend arrow indicator is a powerful tool for technical analysis that will help traders determine the direction of the trend in financial markets. This indicator is based on the use of several mathematical algorithms and methods of price analysis, which allows you to give accurate and transparent signals to enter the market. The working timeframe is H1.  The description of the indicator includes up and down arrows that indicate the future direction of price movement. In addition, the i
Two Candles to Glory
Ellan Dirgantara Tholkhah
This is a Binary Options signal indicator. Extremely powerful for the 1 min chart. The signals are based on my personal tweak (based on real trial and error & backtested) of the RSI, ADX and Ichimoku and my observation on how price moves. It turns out, 2 candles expiry is the most consistent with this set up. How to use: 1. Wait for arrow signal to show. 2. Place a 2 candle expiry right after the close of the signal candle. So if you are trading a 1 min chart, place an expiry for 2 mins... if yo
Smart Gread Ultimate Edition (SGUL) indicator - based on smart order grid strategy. Maximum customization and flexibility of strategies are the main features of this indicator. In the right corner there is a table with the number and volume of orders. List of adjustable parameters: K: 2.0 - Factor of the next order increase (if the price moves in the other direction). TP: 50 - The number of points at which the order is closed with a profit (minimum profit per 1 lot). Step: 80 - The numb
这是一个预测蜡烛收盘价的指标。 该指标主要用于 D1 图表。 该指标适用于传统外汇交易和二元期权交易。 该指标可以用作独立的交易系统,也可以作为您现有交易系统的补充。 该指标分析当前蜡烛,计算蜡烛本身内部的某些强度因素,以及前一根蜡烛的参数。 因此,该指标预测市场走势的进一步方向和当前蜡烛的收盘价。 由于这种方法,该指标既适用于短期盘中交易,也适用于中长期交易。 该指标允许您设置指标在分析市场情况期间将产生的潜在信号的数量。 在指标设置中有一个特殊的参数。 此外,该指标可以通过图表上的消息、电子邮件以及推送通知的形式通知新信号。感谢您的关注!交易愉快! 购买后一定要写信给我! 我会给你我的交易指标的建议! 还可以获得奖金!
该产品的买家也购买
OrderFlow Absorption – 專業級MT4買賣差與吸收訊號指標 釋放真正訂單流分析的力量,OrderFlow Absorption 是MetaTrader 4上最強大的買賣差(Delta)直方圖與吸收訊號指標。專為想看清每一個價格波動背後真相的交易者設計,這個工具揭示了隱藏的買賣壓力與推動市場的吸收事件。 功能特色 買賣差直方圖視覺化:   以清晰的色彩直方圖即時顯示買方與賣方壓力。 吸收訊號偵測:   先進邏輯自動辨識多空吸收事件,及早預警潛在反轉。 圖表標記:   吸收訊號直接標示於主圖表,方便視覺辨識。 彈出式警報:   新吸收訊號出現時即時通知。 自訂門檻:   過濾弱訊號,專注高勝率機會。 資源管理:   高效運算,適用於大型圖表也能流暢運行。 全品種兼容:   適用於任何商品與週期,包括外匯、指數、商品等。 簡易整合:   參數簡單,快速上手與調整。 OrderFlow Absorption 的邏輯說明 OrderFlow Absorption 採用專利演算法,能在沒有完整Tick數據的情況下,估算每根K棒的買賣壓力(Delta)。它分析成交量、價格行為、K
Super Signal – Skyblade Edition 專業級無重繪 / 無延遲趨勢信號系統,擁有卓越勝率 | 適用於 MT4 / MT5 在較低的時間週期上效果最佳,例如 1 分鐘、5 分鐘與 15 分鐘圖表。 核心特色: Super Signal – Skyblade Edition 是一套專為趨勢交易設計的智能信號系統。 其採用多重濾波邏輯,僅篩選出具有明確方向性、動能強勁且波動結構健康的走勢進場點。 本系統 不預測高點或低點 ,只有在同時滿足以下三項條件時才會觸發交易信號: 趨勢方向明確 動能持續增強 波動率結構穩定 此外,系統還結合市場流動性分析,以進一步提升信號的準確性與觸發時機。 信號特性: 所有箭頭信號皆為 100% 無重繪,無延遲 信號一旦出現即固定於圖表,不會閃爍或消失 提供圖表箭頭、資訊面板、彈出通知、聲音提示及推播訊息 支援 EA 呼叫(Buffer 輸出),可整合至自動化交易或信號跟單系統 提供預設參數模板,免調整即可使用,適合新手快速上手 總結: Super Signal – Skyblade Edition 是一款邏輯清晰、穩定高效的專業趨勢型
Miraculous 指标 – 100% 不重绘的外汇和二元期权工具,基于江恩九方图 这个视频介绍的 Miraculous 指标 是一款专为外汇和二元期权交易者开发的高精度、强大交易工具。该指标的独特之处在于它建立在传奇的 江恩九方图 和 江恩振动法则 之上,使其成为现代交易中可用的最精确预测工具之一。 Miraculous 指标 完全不重绘 ,这意味着它的信号在 K 线收盘后不会改变或消失——你看到的就是你得到的。这为交易者提供了可靠且一致的基础,让他们能够自信地进出场交易。 主要特点: 基于江恩九方图和江恩理论构建 100% 不重绘的信号系统 适用于所有时间周期(M1、M5、H1、H4、日线、周线) 适用于外汇和二元期权交易 清晰的买卖信号,准确率高 可用于剥头皮、日内交易或波段交易 兼容大多数 MT4 平台 这款工具旨在帮助初学者和专业交易者做出更好、更明智的决策。无论您是交易货币、指数还是二元期权,Miraculous 指标都将为您在市场中提供所需的优势。
Gold Channel XAUUSD
Paulo Rocha
5 (4)
Gold Channel is a volatility-based indicator, developed with a specific timing algorithm for the XAUUSD pair, which consists of finding possible corrections in the market. This indicator shows two outer lines, an inner line (retracement line) and an arrow sign, where the theory of the channel is to help identify overbought and oversold conditions in the market. The market price will generally fall between the boundaries of the channel. If prices touch or move outside the channel it is a tradi
CVD背離偵測 - 先進成交量能差分析   我們解決的問題 大多數交易者僅依賴價格走勢,錯過了揭示真實市場情緒的關鍵成交量流向信息。傳統指標滯後於價格變動,導致進場過晚和風險管理不佳。 CVD背離偵測 通過分析價格與成交量差動量之間的關係來解決這個問題,在重大市場變動之前為您提供早期預警信號。   CVD背離分析的優勢   早期市場逆轉偵測   - 在價格圖表出現之前發現動量轉變   智能資金追蹤   - 觀察機構何時累積或分配   減少虛假信號   - 成交量確認價格走勢,提供更高概率設置   多時間框架優勢   - 適用於所有時間框架,從剝頭皮到波段交易   通用應用   - 兼容外匯、股票、商品和加密貨幣   4個市場階段 - 真實交易故事 設想EUR/USD接近重要支撐位...   階段1:初始下跌(CVD在零線上方下跌) 價格從阻力位開始下跌 CVD信號下跌但保持在零線上方 解讀:   賣壓增強,但買方仍然存在   階段2:加速賣出(CVD跌破零線以下) 價格繼續向支撐位下跌 CVD信號跌破零線 解讀:   賣方佔主導,動量
Binary Booster
Yaroslav Varankin
5 (1)
Binary Options Trading Indicator: A Reliable Tool for Your Trades This indicator is specifically designed for binary options trading and has proven its high quality, reliability, and adequate accuracy, depending on the dynamics of the chart. Key Points: Signal Interpretation: When a blue cross signal appears, it indicates a potential entry into a trade, though it is considered a weak signal on its own. However, if the blue cross is accompanied by an arrow, it is considered a more reliable buy s
Enigmera
Ivan Stefanov
5 (9)
ENIGMERA: 市场的核心 重要提示:MQL5.com 演示版本在策略测试器中运行,可能无法完全反映 Enigmera 的功能。请查看描述、截图和视频了解详细信息。如有任何问题,请随时联系我! 该指标的代码已完全重写。版本 3.0 增加了新功能并修复了自指标发布以来积累的错误。 简介 这个指标和交易系统是金融市场的一种独特方法。ENIGMERA 使用分形周期来精确计算支撑和阻力水平。它展示了真实的积累阶段,并提供了方向和目标。无论是在趋势中还是在修正中,这个系统都能工作。 它是如何工作的 指标的大部分功能通过图表左侧的按钮控制,使得能够快速响应不同的市场情况。 按钮 ON/OFF – 显示或隐藏整个指标。 Channel – 激活支撑通道,显示可接受的偏差范围。 Dev1 (第一偏差) – 指示价格在支撑偏差内的波动,信号表示市场正在整合或积累力量。 Dev2 (第二偏差) – 显示价格在偏差之间的波动,表示趋势形成和方向。 Dev3 (第三偏差) – 表示趋势的显著加速和高波动性。 45deg (45度) – 显示市场的节奏和相对于 45 度线的运动稳定性。 Tgt1/2
TrendMaestro
Stefano Frisetti
4 (4)
Attention: beware of SCAMS, TRENDMAESTRO is only ditributed throught MQL5.com market place. note: this indicator is for METATRADER4, if you want the version for METATRADER5 this is the link:  https://www.mql5.com/it/market/product/108106 TRENDMAESTRO ver 2.5 TRENDMAESTRO recognizes a new TREND from the start, he never makes mistakes. The certainty of identifying a new TREND is priceless. DESCRIPTION TRENDMAESTRO identifies a new TREND in the bud, this indicator examines the volatility, volumes a
There is always a need to measure if the market is "quiet" or it is volatile. One of the possible way is to use standard deviations, but the issue is simple : We do not have some levels that could help us find out if the market is in a state of lower or higher volatility. This indicator is attempting to do that : •           values above level 0 are indicating state of higher volatility (=GREEN buffer) •           values below level 0 are indicating state of lower volatility (=RED buffer)
Breakout Arrows Mt4
Michael Oko Oboh
5 (1)
Trend Breakout Arrows Indicator The Trend Breakout Arrows Indicator is a momentum-based signal tool designed to identify potential bullish and bearish breakout opportunities. It displays clear arrow signals directly on the price chart, helping traders quickly recognize possible trend changes and continuation setups. Up Arrow (Buy Signal) A magenta up arrow appears below a candle when bullish momentum begins to strengthen. This signal indicates that buying pressure may be overtaking selling press
Dynamic Scalper System
Vitalyi Belyh
5 (2)
“ Dynamic Scalper System ”指标专为在趋势波内进行剥头皮交易而设计。 已在主要货币对和黄金上进行测试,并可与其他交易工具兼容。 提供顺势短线建仓信号,并提供额外的价格变动支持。 指标原理: 大箭头决定趋势方向。 在趋势波内,我们采用一种生成小箭头形式的剥头皮交易信号的算法。 红色箭头代表看涨方向,蓝色箭头代表看跌方向。 敏感的价格变动线会沿着趋势方向绘制,并与小箭头信号协同作用。 信号运作方式如下:当线在适当时刻出现时,将形成入场信号;在出现线时,持仓;线完成后,平仓。 建议的操作时间范围为M1 - H4。 箭头在当前K线上方形成,如果下一根K线已开仓,则不会重新绘制上一根K线上方的箭头。 输入参数 Trend Wave Period - 趋势方向(大箭头)的周期,改变趋势波的时间间隔。值 1 表示趋势方向的最长持续时间,参数值越大,持续时间越短。 Scalper Arrows Period - 信号箭头(小箭头)的计算周期,改变入场信号的生成频率。值 3 表示最频繁的生成频率,参数值越大,箭头频率越低,准确度越高。 这些参数可以根据不同的时间范
Meravith
Ivan Stefanov
5 (3)
做市商工具。 Meravith 将: 分析所有时间周期并显示当前正在运行的趋势。 标注流动性区域(成交量均衡区),即多头与空头成交量相等的位置。 在您的图表上直接显示来自不同时间周期的所有流动性水平。 生成并展示基于文本的市场分析供您参考。 根据当前趋势计算目标位、支撑位和止损位。 计算交易的风险回报比。 根据您的账户余额计算仓位大小,并估算潜在利润。 在市场出现重大变化时,Meravith 还会发出警告。 指标的主要线条: 多头/空头成交量衰竭线 —— 作为目标位使用。 趋势线 —— 指示市场趋势方向。根据市场是多头还是空头而改变颜色,并作为趋势支撑。其颜色主要反映市场情绪。 成交量均衡线(Eq)—— Eq(Volume Equilibrium)是系统的核心。它表示买卖双方成交量的平衡点,即市场流动性所在位置。向上突破 Eq 表示多头倾向,向下突破 Eq 表示空头倾向。突破后,应等待回调——当价格回到相反趋势的偏离线或衰竭线附近时。 使用方法:只需将其添加到图表中。 Meravith 可以分析一切——趋势和回调。 趋势线与某条成交量衰竭线之间的距离越大,说明该方向的成交量越高。 趋
Linear Trend Predictor — 结合切入点和方向支撑线的趋势指标。按照突破高/低价通道的原理运作。该指标算法过滤市场噪音,考虑波动性和市场动态。 指示器功能  使用平滑方法,显示市场趋势和开立买入或卖出订单的切入点。  适合通过分析任何时间范围内的图表来确定短期和长期的市场走势。  输入参数可适应任何市场和时间范围,允许交易者独立定制指标。  设定的指示信号不会消失,也不会重新绘制——它是在蜡烛收盘时确定的。  几种类型的通知以箭头组合。  该指标既可以作为独立的交易系统使用,也可以作为其他交易系统的补充。  可供任何经验水平的交易者使用。 主要参数 Volatility Smoothing Level - 指标的主要参数,允许您配置指标以实现舒适的操作。 它的数字范围是 1 到 100,从而增加了您可以获得更长趋势运动的平滑度。 通过少量的数字,您可以获得短期走势并快速退出交易。 使用指标进行交易的时刻:  红线和箭头表示下降趋势和卖出开盘信号。止损应根据前一个上分形来设置。  黄线和箭头表示上升趋势和买入开盘信号。止损应根据前一个下分形来设置。
ATC AlgoZone Indicator
Ameur Boudenne
5 (2)
Algo Trading Indicaor  With this indicator , you’ll have zones and trends that hight probability the price will reverse from it. so will gives you all the help that you need  MT5 Version                    https://www.mql5.com/en/market/product/170028 MT4 Version                    https://www.mql5.com/en/market/product/88034 Why should you join us !?  1-This indicator is logical since it’s working in previous days movement , to predict the future movements. 2-Algo trading indicator will hel
TRADING STRATEGY GUIDE DELIVERY The full Trading Strategy Guide will be sent directly to you after purchase. Just message me on MQL5 and ask for it — you'll receive it instantly, along with priority support and setup help. Powered Market Scanner for Smart Trading Decisions keypad support resistance logic 1  is a next-generation MT4 trading system built for serious traders who demand precision, reliability, and clarity. It combines advanced smart filters with real-time price structure logic to
MagicTrigger MT4
Mostafa Ghanbari
MagicTrigger — 多周期 HD/RD 背离确认指标 MagicTrigger 是一款多周期背离引擎,它在较高周期(HD)上寻找结构性背离,并等待同一价格区域内较低周期(RD)出现相匹配的背离来加以确认。只有当较高周期的摆动结构与较低周期的确认相互吻合时,指标才会标记信号,并同时给出建议的入场触发点、止损位以及两个目标位。 工作原理 指标会自动扫描当前图表周期之上和之下的一系列周期。在较高周期上,它寻找价格摆动点与平滑震荡线之间的背离形态(即"HD"背离)。随后检查在 HD 结构所定义的时间与价格区域内,较低周期是否也出现相同方向的背离(即"RD"背离)。只有当达到所需的最小数量的较低周期确认了较高周期的结构时,才会生成信号,从而减少孤立的单一周期背离信号。 主要功能 基于当前图表周期自动构建多周期扫描链,相同逻辑可自适应任何加载的周期。 可调节的历史扫描深度(History Scan Depth),用于控制图表加载时分析的K线数量。 HD Divergence Range 与 RD Divergence Range 参数用于控制每次背离所使用摆动点之间的最大距离——范围越窄
GoldRush Trend Arrow Signal
Kirk Lee Holloway
5 (2)
GoldRush 趨勢箭頭信號 GoldRush 趨勢箭頭信號 指標為 XAU/USD 中的高速、短期短線交易者提供精確、實時的趨勢分析。 專為1分鐘時間框架設計,此工具顯示方向箭頭以明確顯示入場點,使短線交易者能在波動市場中自信操作。 該指標包含主要和次要警示箭頭。主要信號為白色和黑色方向箭頭,用於指示趨勢方向的轉變;次要信號為藍色和紅色箭頭,用於確認主要箭頭指示的方向並提示潛在交易入場點。 注意:當趨勢方向發生變化後僅出現一個主要警報箭頭時,請注意可能會出現多個次要藍/紅箭頭。次要信號將在滿足信號標準的任何蠟燭圖後出現,因此在長期趨勢移動中,螢幕上將顯示大量次要箭頭(如附帶的截圖所示)。您可在設置中開啟或關閉任一箭頭類型。 以下是我使用此指標進行交易的方式: - 對於買入入場,我會耐心等待白箭頭在蠟燭收盤時出現,並在下一根可用蠟燭收盤時出現藍箭頭時進行買入交易。 - 對於賣出入場,我會耐心等待黑箭頭在蠟燭收盤時出現,並在下一根可用蠟燭收盤時出現紅箭頭時進行賣出交易。 - 獲利了結/止損設置由使用者自行負責,但我個人使用最低R:R為1:2,並發現這在倫敦/紐約開盤等
First time on MetaTrader, introducing IQ Star Lines - an original Vedic Astrology based indicator. "Millionaires don't use astrology, billionaires do" . - J.P. Morgan, Legendary American financier and banker. We don't offer free or bonus indicators in exchange of reviews from you. You won't need any free products with this indicator to make it work. ;) Enjoy! Welcome to  the new and updated  IQ Star Lines , the ultimate fusion of ancient planetary harmonic cycles and modern quantitative trading.
WanaScalper MT4
Isaac Wanasolo
1 (1)
A scalping indicator based on mathematical patterns, which on average gives signals with relatively small SL, and also occasionally helps to catch big moves in the markets (more information in the video) This indicator has three main types of notifications: The first type warns of a possible/upcoming signal on the next bar The second type indicates the presence of a ready signal to enter the market/open a position The third type is for SL and TP levels - you will be notified every time price re
Pair Trading Station MT4
Young Ho Seo
3.67 (3)
How to use Pair Trading Station Pair Trading Station is recommended for H1 time frame and you can use it for any currency pairs. To generate buy and sell signal, follow few steps below to apply Pair Trading Station to your MetaTrader terminal. When you load Pair Trading Station on your chart, Pair Trading station will assess available historical data in your MetaTrader platforms for each currency pair. On your chart, the amount of historical data available will be displayed for each currency pai
FFx Engulfing Setup Alerter gives trade suggestions with Entry, Target 1, Target 2 and StopLoss. Below are the different options available: Entry suggestion - pips to be added over the break for the entry 3 different options to calculate the SL - by pips, by ATR multiplier or at the pattern High/Low 3 different options to calculate the 2 TPs - by pips, by ATR multiplier or at Risk/Reward Offset the dashboard - any place on the chart Remove the suggestion once the price reached the SL line Lines
FFx InsideBar Setup Alerter gives trade suggestions with Entry, Target 1, Target 2 and StopLoss. Below are the different options available: Entry suggestion - pips to be added over the break for the entry Minimum candle size - to avoid too close buy/sell entry suggestions 3 different options to calculate the SL - by pips, by ATR multiplier or at the pattern High/Low 3 different options to calculate the 2 TPs - by pips, by ATR multiplier or at Risk/Reward Offset the dashboard - any place on the c
FFx OutsideBar Setup Alerter gives trade suggestions with Entry, Target 1, Target 2 and StopLoss. Below are the different options available: Entry suggestion - pips to be added over the break for the entry. 3 different options to calculate the SL - by pips, by ATR multiplier or at the pattern High/Low. 3 different options to calculate the 2 TPs - by pips, by ATR multiplier or at Risk/Reward. Offset the dashboard - any place on the chart. Remove the suggestion once the price reached the SL line.
FFx PinBar Setup Alerter gives trade suggestions with Entry, Target 1, Target 2 and StopLoss. Below are the different options available: Entry suggestion - pips to be added over the break for the entry Minimum candle size - to avoid too small candles 3 different options to calculate the SL - by pips, by ATR multiplier or at the pattern High/Low 3 different options to calculate the 2 TPs - by pips, by ATR multiplier or at Risk/Reward Offset the dashboard - any place on the chart Remove the sugges
Lineverse Trendlines
Arkady Segal
5 (1)
Automatic, live & interactive picture of all trendlines. Assign push, email and sound alerts to the lines of your choice and be informed about price rollback, breakout, rollback after breakout, number of rollbacks, line expiration by double breakout. Correct, drag or delete the lines and interactively tune the line system. https://youtu.be/EJUo9pYiHFA . Chart examples https: //www.mql5.com/en/users/efficientforex Price Interaction Events All events are effective immediately and only after one
Adaptive Stochastic
Rasoul Mojtahedzadeh
Stochastic Oscillator is one of the most popular and accurate oscillators widely used by traders to capture overbought and oversold areas of price action. Although the Stochastic indicator works fine for an interval of the market, it fails to generate profitable signals when the market conditions change, and hence it produces wrong signals resulting in big losses. Have you ever thought about an adaptive Stochastic indicator that adapts its period of calculation based on the market conditions? Th
FFx MACD Divergences
Eric Venturi-Bloxs
The purpose of this new version of the MT4 standard indicator provided in your platform is to display in a sub-window multiple timeframes of the same indicator with its divergences. See the example shown in the picture below. But the display isn't like a simple MTF indicator. This is the real display of the indicator on its timeframe. Here's the options available in the FFx divergences indicator: Select the timeframes to be displayed (M1 to Monthly) Define the width (number of bars) for each tim
FFx RSI Divergences
Eric Venturi-Bloxs
The purpose of this new version of the MT4 standard indicator provided in your platform is to display in a sub-window multiple timeframes of the same indicator with its divergences. See the example shown in the picture below. But the display isn't like a simple MTF indicator. This is the real display of the indicator on its timeframe. Here's the options available in the FFx divergences indicator: Select the timeframes to be displayed (M1 to Monthly) Define the width (number of bars) for each tim
FFx CCI Divergences
Eric Venturi-Bloxs
The purpose of this new version of the MT4 standard indicator provided in your platform is to display in a sub-window multiple timeframes of the same indicator with its divergences. See the example shown in the picture below. But the display isn't like a simple MTF indicator. This is the real display of the indicator on its timeframe. Here's the options available in the FFx divergences indicator: Select the timeframes to be displayed (M1 to Monthly). Define the width (number of bars) for each ti
作者的更多信息
RelicusRoad MACD v2 MT5
Relicus LLC
4.77 (22)
移动平均收敛发散(MACD)交易策略是一种流行的技术分析工具,用于识别动量和趋势方向的变化。MACD的计算方法是将26期指数移动平均线(EMA)减去12期EMA。然后在MACD上方绘制一个9期EMA,称为“信号线”,以充当买入和卖出信号的触发器。 当MACD线在信号线上方时,MACD被认为处于看涨区域,在下方时处于看跌区域。交易者经常使用这些信息来确定潜在的买入和卖出机会。 MACD是一种多功能指标,可以用多种方式使用,其中一些常见的用法包括: 交叉:当MACD线穿过信号线时,出现看涨交叉;当MACD线穿过信号线下方时,出现看跌交叉。 发散:当MACD正在创造新高时,而基础证券没有创造新高时,出现看涨发散;当MACD正在创造新低时,而基础证券没有创造新低时,出现看跌发散。 趋势跟踪:当MACD在零线上方时,出现看涨趋势;当MACD在零线下方时,出现看跌趋势。 需要注意的是,MACD是一种滞后指标,应与其他技术指标和分析结合使用才能做出交易决策。
FREE
RelicusRoad Pro MT5
Relicus LLC
4.96 (24)
RelicusRoad Pro: 量化市场操作系统 终身访问限时 70% 折扣 - 加入 2,000+ 交易员社区 为什么大多数交易者即使拥有“完美”指标也会失败? 因为他们在真空中交易 单一概念 。没有背景的信号是赌博。要持续获胜,您需要 共振 (CONFLUENCE) 。 RelicusRoad Pro 不是一个简单的箭头指标。它是一个完整的 量化市场生态系统 。它描绘价格运行的“公允价值之路”,区分市场噪音和真实的结构性突破。 停止猜测。开始用机构级“路”逻辑进行交易。 核心引擎:“Road” (路) 算法 系统的核心是 Road Algo ,一个实时适应市场条件的动态波动率通道。它投射出 安全线 (平衡) 和价格可能反转的 扩展水平 。 Simple Road: 典型市场的标准结构映射。 Smooth Road: 针对震荡盘整的降噪计算。 Breakout Road: 专为识别波动率扩张和爆发性走势而调整。 1. 算法动量与确认 我们的“剥头皮箭头”不只是简单的交叉。它们利用 高阶多项式逻辑 过滤噪音,确保信号与主周期一致。我们检测动量、价格行为和 Road 结构汇聚的精确入场
RelicusRoad MACD v2
Relicus LLC
4.6 (5)
移动平均收敛发散(MACD)交易策略是一种流行的技术分析工具,用于识别动量和趋势方向的变化。MACD的计算方法是将26期指数移动平均线(EMA)减去12期EMA。然后在MACD上方绘制一个9期EMA,称为“信号线”,以充当买入和卖出信号的触发器。 当MACD线在信号线上方时,MACD被认为处于看涨区域,在下方时处于看跌区域。交易者经常使用这些信息来确定潜在的买入和卖出机会。 MACD是一种多功能指标,可以用多种方式使用,其中一些常见的用法包括: 交叉:当MACD线穿过信号线时,出现看涨交叉;当MACD线穿过信号线下方时,出现看跌交叉。 发散:当MACD正在创造新高时,而基础证券没有创造新高时,出现看涨发散;当MACD正在创造新低时,而基础证券没有创造新低时,出现看跌发散。 趋势跟踪:当MACD在零线上方时,出现看涨趋势;当MACD在零线下方时,出现看跌趋势。 需要注意的是,MACD是一种滞后指标,应与其他技术指标和分析结合使用才能做出交易决策。
FREE
您想在只使用一个账户(主账户)进行交易的同时管理多个账户,同时管理风险和手数吗? 特征: 主(主)/从(复制帐户) 接受的滑点(价格差异) 乘/除(复制批次除法或乘法系数) 手数因子(除法或乘法的因子) 全部关闭(关闭所有活动头寸按钮) 快来了: 全部关闭 - 仅从站 关闭所有获利头寸 - 主从 关闭所有利润 - 仅限从站 Check out our indicator RelicusRoad for best results: https://www.mql5.com/en/market/product/861300 Join our discord group as well   RelicusRoaders with guides, trainings and help.
FREE
RelicusRoad Support Resistance 是适用于 MetaTrader 4 和 MetaTrader 5 的支撑阻力指标,依据分形摆动构建供需区域,并按强度与近期测试情况为每个区域评级。 指标在价格上下方各自保留一份简要的区域地图,每个区域都标注等级、宽度与近期测试次数。 工作原理 摆动高低点被归纳为价格区域,而不是单一线条。摆动是指其高点或低点在两侧各 7 根 K 线范围内都未被超越的 K 线,其中跨度更大的 15 根 K 线摆动,以及之后出现强烈反应的摆动,权重更高。这些加权摆动沿价格轴累加,密度最高且彼此分开的区域即成为分级区域。每个区域都有一个强度分,每次重复测试都会削弱该分数,区域之间至少保持平均真实波幅(ATR)的 0.75 倍距离,不会重叠。 Verified:在最近 100 根 K 线内被测试过,且仍然强劲。 Weak:在最近 100 根 K 线内被测试过,强度低于 Verified 等级。 Untested:最近 100 根 K 线内没有测试。 Turncoat、Possible 和 Broken:分别为已翻转、未确认和已失效的区域,仅在关闭 U
RelicusRoad Signal Line 是适用于 MetaTrader 4 和 MetaTrader 5 的趋势过滤指标,绘制两条移动平均线,并依据所选的策略过滤器,把每根线段染成绿色、鲑鱼色或灰色。 线条本身显示均线所在的位置,颜色则显示所选过滤器对该 K 线的判断。默认情况下,Line 1 是以 momentum 着色的快速 KAMA 9,Line 2 是以 Ichimoku 着色的慢速 Hull 移动平均 200。 工作原理 每条线都根据设定的均线类型与周期,以收盘价计算得出,下方始终绘制着一条灰色底线。在所选过滤器判断为向上的 K 线上,会在其上绘制绿色线段;判断为向下的 K 线上,线段则为浅鲑鱼色。过滤器无法判断时,灰色底线保持可见。每条线都有自己独立的均线设置与过滤器。 Momentum:上一根已收盘 K 线 5 周期 momentum,与两根 K 线之前的数值比较。 Ichimoku:Tenkan 高于 Kijun,且上一根收盘价高于云层两条边界时为绿色,相反情形为鲑鱼色。 MACD:12、26、9 参数下的主线高于或低于其信号线。 ParabolicSAR:K
RelicusRoad Action Levels 是适用于 MetaTrader 4 和 MetaTrader 5 的支撑阻力价位指标,依据品种自身的波动率与历史反应拟合一套主要与次要价位网格,并为每个价位标注触碰次数。 这套网格既不是固定点差,也不是简单的整数网格。其间距与偏移是从已收盘的 K 线中选取的,每个价位都会根据价格在其周围的表现获得评分,图表上只绘制当前价格附近最强的价位。 工作原理 在默认的 Formula 模式下,指标读取所选周期最多 1200 根已收盘 K 线,收集其中的反应:摆动高低点,以及带有长上下影线的 K 线。随后它会尝试一系列间距方案,分别基于典型 K 线波幅、反应点之间的距离,以及两者的组合,每种方案再配合多个偏移量。最终保留线条与这些反应及历史支撑/阻力拟合得最贴切的那套网格。 Touches:只有当价格明显远离该价位之后,再次触及才会重新计数。 Holds:价格触及该价位后,向有利方向的运行距离大于向不利方向。 Breaks and retests:价格收盘穿越该价位,并在 16 根 K 线内回到该价位。 Recency and stability
RelicusRoad Daily High Low 是适用于 MetaTrader 4 和 MetaTrader 5 的前一日高低点指标,在日内图表的每根 K 线上标出昨日的最高价、最低价与今日的开盘价。 这三条价位以彩色点状线绘制,在新周期开始时跳转到新数值,并在每个周期末尾带有小小的 High、Low 与 Open 标签。在 H1 至 H4 的图表上,同样的标记改为显示上周的区间与本周的开盘价,在 D1 上则显示对应的月度数值。 工作原理 对图表上的每根 K 线,指标都会找出包含它的参考周期。High 与 Low 标记取自上一个周期的最高价与最低价,Open 标记取自该 K 线所属周期的开盘价。参考周期默认跟随图表周期,除非自行选择。 Below H1:日参考:前一日的最高价、最低价,以及当日开盘价。 H1 to H4:周参考:上周的最高价、最低价,以及本周开盘价。 D1:月参考:上月的最高价、最低价,以及本月开盘价。 W1 与 MN1:这些图表上不绘制任何内容。 周期边界跟随经纪商的服务器时间,与平台自身的日线、周线和月线保持一致,没有时区偏移参数。标记在每根新 K 线开盘时重
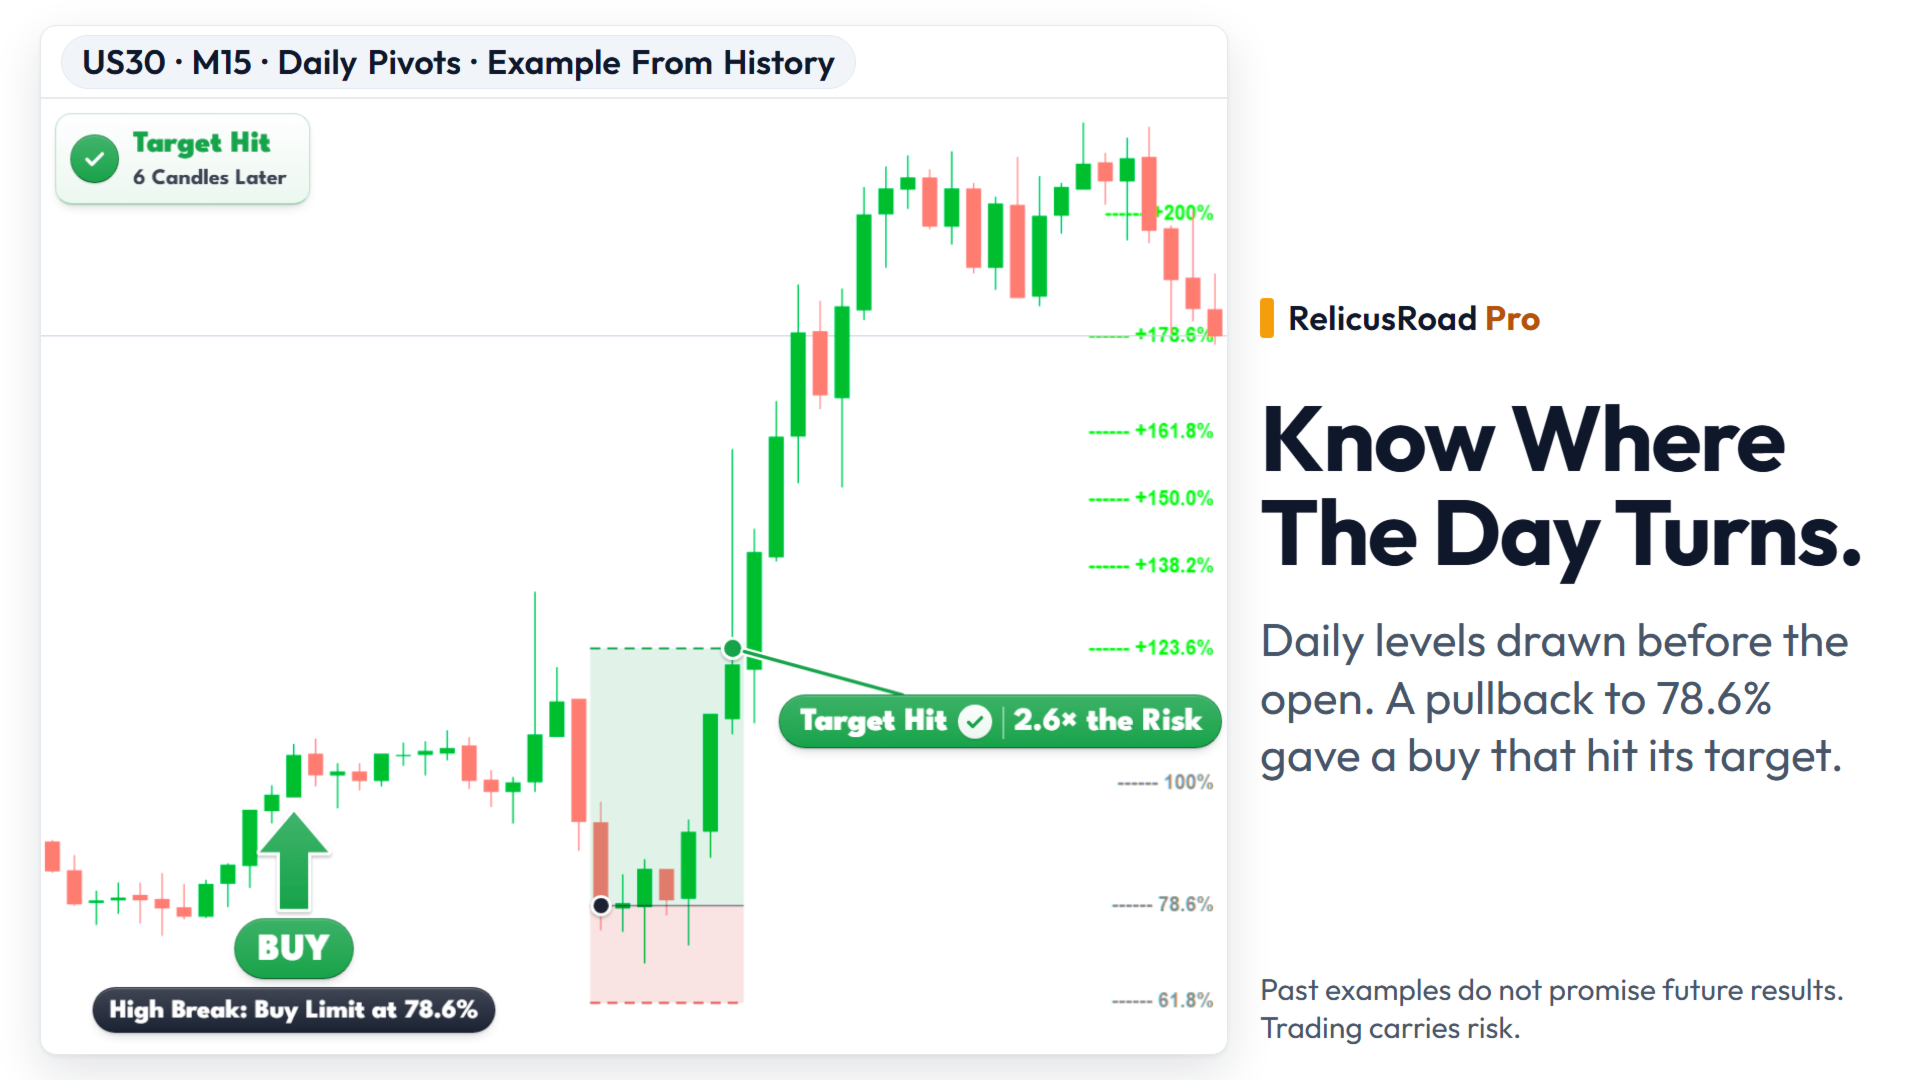
RelicusRoad Daily Pivots 是适用于 MetaTrader 4 和 MetaTrader 5 的日内枢轴价位指标,将前一日区间划分为斐波那契价位,并向上下两侧延伸,范围从负 100% 到正 200%。 指标不采用经典的地板枢轴公式,而是把前一个已完成的区间当作一把刻度尺,最低价为 0%,最高价为 100%。图表右侧以紧凑的彩色标记打印出十九个价位,因此今日行情的大小可以直接读作昨日区间的分数或倍数。 工作原理 指标取前一个已完成参考周期的最高价与最低价,并在该区间的每个比例处放置一个价位:价位 = 最低价 + 比例 x(最高价 − 最低价)。周末的 K 线会被跳过,因此周一的参考是上一个交易日。参考周期由图表周期决定。 Inside set, gray:0%、23.6%、38.2%、50.0%、61.8%、78.6% 与 100%。 Above set, green:+123.6%、+138.2%、+150.0%、+161.8%、+178.6% 与 +200%。 Below set, red:-23.6%、-38.2%、-50.0%、-61.8%、-78.6% 与
RelicusRoad Scalping Pivots 是适用于 MetaTrader 4 和 MetaTrader 5 的摆动点与斐波那契价位指标,在 60 根 K 线的回溯窗口内交替标记摆动高点与低点,并为最新摆动标注斐波那契回撤与延伸价位。 名称中的 pivots 指的正是这些摆动点,而不是 PP、R1、S1 这类经典地板枢轴点。在最新摆动旁边,指标会打印一列百分比标签,因此无需手工绘制斐波那契工具即可读取回撤与延伸价位。 工作原理 当某根 K 线的最高价是最近 Range 根 K 线(含自身)中的最高值时,该 K 线被标记为摆动高点。摆动低点以同样方式判定。这项检验只向回看,因此一根 K 线一旦成为目前为止的极值就会被标记。第二遍处理只保留每段上涨行情中最极端的高点,以及每段下跌行情中最极端的低点,因此标记会交替出现。两侧的命名如下: Bull:在配对的摆动低点之后形成的摆动高点,绘制为柠檬绿圆点。 Bear:在配对的摆动高点之后形成的摆动低点,绘制为洋红色圆点。 请注意命名方式:在本指标中,Bull 标记的是摆动高点,Bear 标记的是摆动低点,这与许多交易者习惯的用法相反。
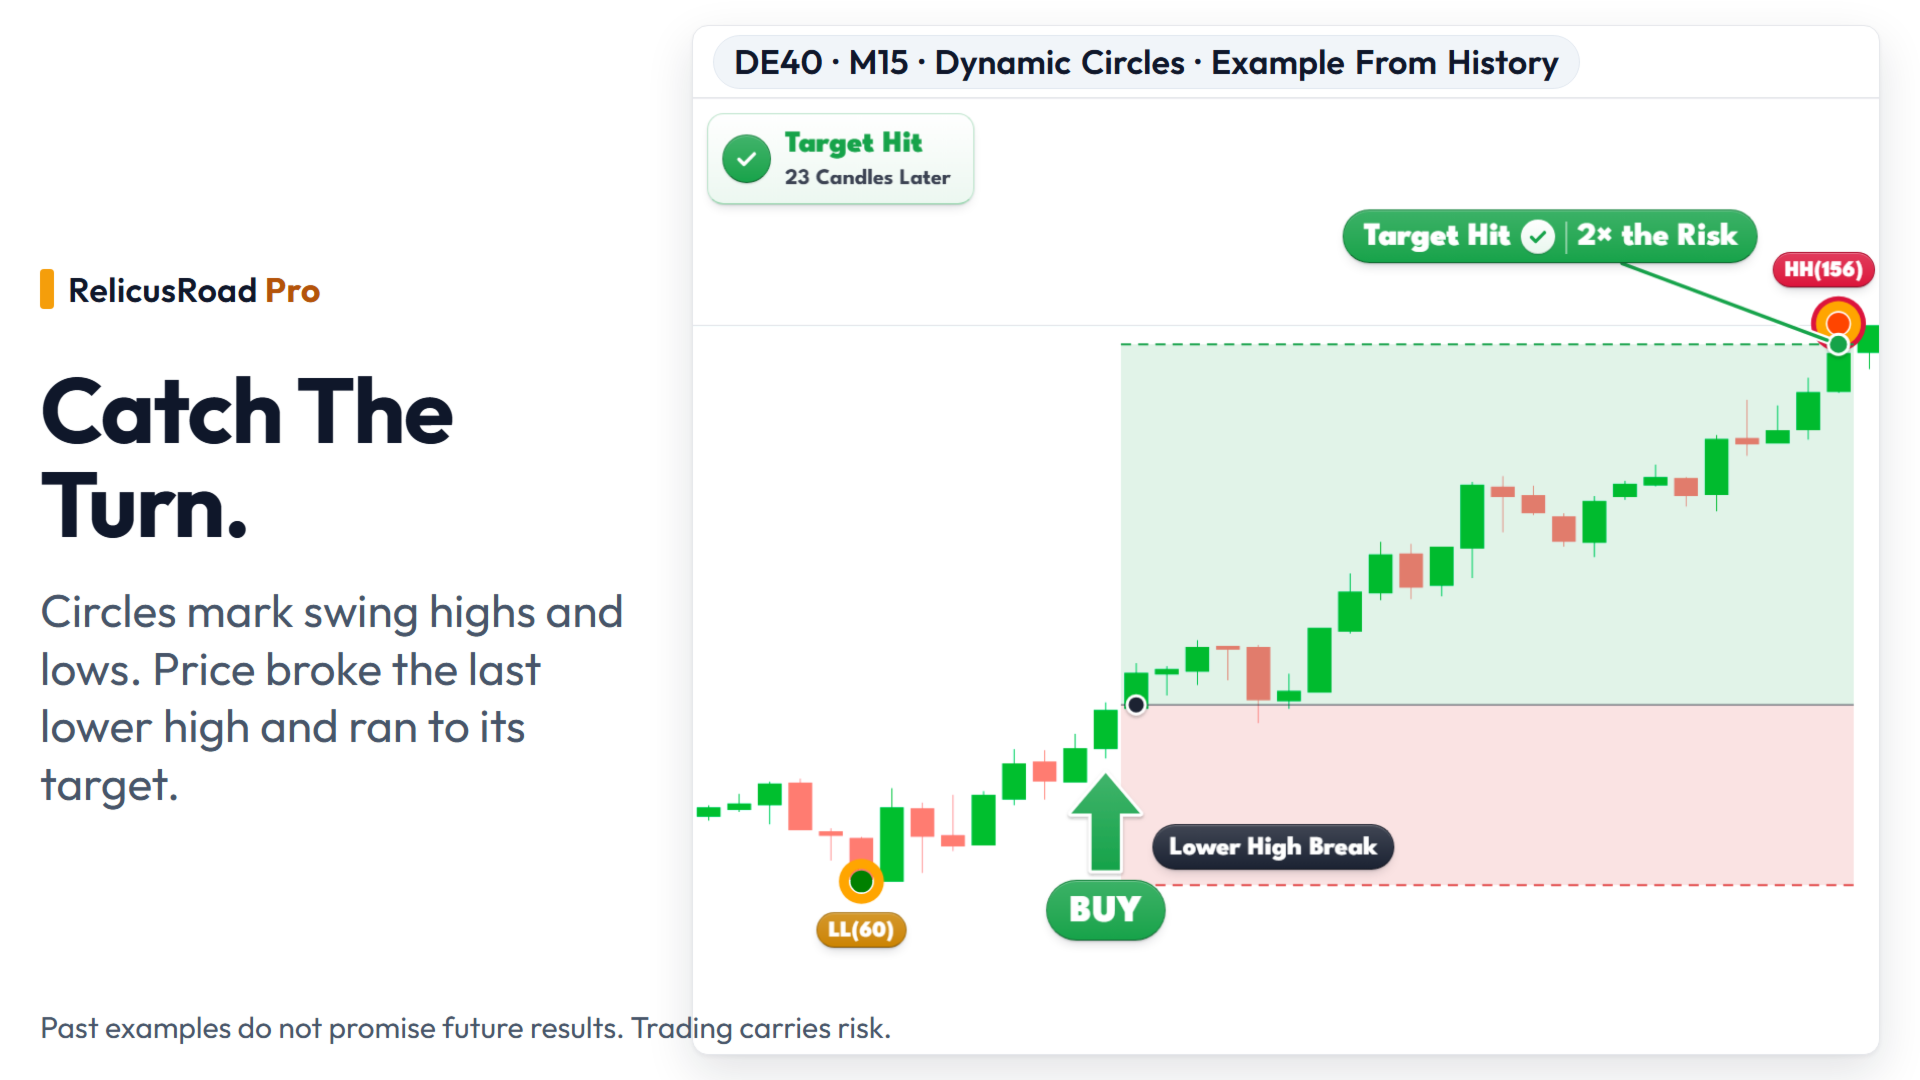
RelicusRoad Dynamic Circles 是适用于 MetaTrader 4 和 MetaTrader 5 的摆动高低点指标,同时以三种回溯长度——9、60 与 156 根 K 线——用圆圈标记转折点。 小转折和大转折出现在同一张图表上,但外观不同。短区间的小圆点表示次要摆动,而较大的中区间与长区间圆环,只会出现在价格创下更长窗口内极值的位置。每个圆圈都可以带上一小段文字标签,例如 HH(60) 或 LL(156)。 工作原理 对每一根 K 线,指标都会检查其最高价是否是最近 N 根 K 线(含自身)中的最高值,如果是,该 K 线就会得到一个高点圆圈。低点的检验方式相同。这项检验只向回看,因此一根 K 线一旦成为目前为止的极值,就会立即被标记。同样的检验会针对三个区间各运行一次: Short range:默认 9 根 K 线,绘制为小圆点。 Medium range:默认 60 根 K 线,绘制为圆环。 Long range:默认 156 根 K 线,绘制为更大的圆环。 标记完成后,会有第二遍处理对结果进行精简。当连续出现多个高点圆圈、之间没有低点圆圈时,只保留其中最高的
RelicusRoad Fractals 是适用于 MetaTrader 4 和 MetaTrader 5 的分形指标,以两种强度标记摆动高低点:Fast 检验两侧各 7 根 K 线,Slow 检验两侧各 15 根 K 线。 两侧各 7 根 K 线的窗口已经能滤掉许多细小的波动,而 Slow 检验要求的窗口是它的两倍多,因此其较粗的箭头挑出的是在更宽范围内依然成立的摆动。两种强度同时显示,因此次要摆动与更大的摆动可以一眼分辨。 工作原理 当一根 K 线左侧窗口内没有更高的高点、右侧窗口内也没有更高或相等的高点时,这根 K 线即为高点分形。若出现相同价位,标记归属于较新的 K 线。低点分形的判定方式与此相反。检验以两个固定强度进行: Fast:高点或低点须在两侧各 7 根 K 线中脱颖而出。 Slow:高点或低点须在两侧各 15 根 K 线中脱颖而出。 由于检验需要右侧的 K 线存在,箭头只能在这些 K 线出现之后才会显示。最新可能出现的 Fast 箭头在 7 根 K 线之前,最新可能出现的 Slow 箭头在 15 根 K 线之前。每个 Slow 分形也必然通过 Fast 检验,因为 1
RelicusRoad Multi Timeframe Trendbar 是适用于 MetaTrader 4 和 MetaTrader 5 的多周期趋势指标,在图表角落以一行彩色圆点显示 M1 至 MN1 共九个周期的 Uptrend、Neutral 或 Downtrend 状态。 每个周期在图表右下角都有一个圆点,其名称显示在上方。颜色表示该周期的状态,因此无需切换图表即可看出哪些周期方向一致。 工作原理 对每个周期,指标都会在该周期当前 K 线上比较两个标准工具:步长 0.02、最大值 0.2 的 Parabolic SAR,以及周期为 14 的 ADX 中 +DI 与 -DI 两条线。只有二者一致时才会显示方向: Uptrend:Parabolic SAR 位于收盘价下方,且 +DI 高于 -DI,默认柠檬绿。 Downtrend:Parabolic SAR 位于收盘价上方,且 -DI 高于 +DI,默认红色。 Neutral:其他所有情况,包括 SAR 与 DI 意见不一致,默认黄色。 ADX 主线未被使用,因此这一行只显示方向,不显示趋势强度。ADX 与 SAR 的设置是固定
RelicusRoad SuperTrend 是适用于 MetaTrader 4 和 MetaTrader 5 的 SuperTrend 指标,在上升趋势中于价格下方、在下降趋势中于价格上方绘制一条基于 ATR 的跟踪线。 这是经典的 SuperTrend 算法,没有附加任何其他内容:上升一条线,下降一条线,没有箭头、标签或面板。 工作原理 对每一根 K 线,指标取中位价,即该 K 线最高价与最低价的中点,并在其上下方各设定若干个平均真实波幅(ATR)单位的通道带。当收盘价高于上一根 K 线的上轨时,趋势转为上升;当收盘价低于上一根 K 线的下轨时,趋势转为下降。在这两个事件之间,趋势方向不会改变。 Uptrend:下轨以上升颜色(默认绿色)绘制在价格下方。 Downtrend:上轨以下降颜色(默认金黄色)绘制在价格上方。 Flip:当前活跃的线结束,留出一根 K 线的空白,另一侧的线随之开始。 No neutral state:每一根被计算的 K 线都属于上升或下降一侧,没有中性状态。 SuperTrend 线只会顺着趋势移动。在上升趋势中,下轨可以上升但不会下降,因此它会在价格后方
RelicusRoad Trading Sessions 是适用于 MetaTrader 4 和 MetaTrader 5 的交易时段指标,在 M1、M5 与 M15 图表上以垂直点线标出东京、伦敦与纽约时段的开盘时间。 每个时段的开盘都以一条线、一个旋转显示的小名称标签,以及一个事件标记来呈现,颜色为该时段自己的颜色,覆盖当前交易日与此前的若干工作日。将鼠标悬停在其上会显示时段名称与开盘时间。本指标只标记开盘:不会填充时段区间、重叠或收盘时间。 工作原理 指标加载时会读取经纪商服务器时间与 UTC 之间的差值,四舍五入到整小时,再减去一小时。随后它会把东京开盘设在 UTC 23:00、伦敦开盘设在 UTC 07:00、纽约开盘设在 UTC 12:00,换算为服务器时间,并从当前 UTC 日期向前逐个工作日标出。周六与周日会被跳过。 Tokyo:默认橙色,位于 UTC 23:00,即东京时间 08:00。 London:默认绿色,位于 UTC 07:00,即夏令时下的伦敦开盘时间。 New York:默认红色,位于 UTC 12:00,即夏令时下的纽约开盘时间。 指标不做夏令时调整。这
RelicusRoad Trendlines 是适用于 MetaTrader 4 和 MetaTrader 5 的自动趋势线指标,在三种摆动尺度上通过已确认的摆动枢轴拟合趋势线通道,并以阴影区域绘制。 短、中、长三种摆动各有自己的颜色。图表显示当前评分最高的两到三条通道,外加一个灰色棋盘格方框,为其中一条选定的轨道标出参考入场位、止损位与目标位。 工作原理 只有当某根 K 线是其两侧各设定数量已收盘 K 线中的最高或最低点时,摆动高点或低点才算确认:默认短摆动为 9 根,中摆动为 60 根,长摆动为 156 根。穿过十个最新枢轴的一条线,通常需要其中至少三个落在 0.35 倍 ATR 以内,且中间没有枢轴穿透它。随后高点线与低点线配对形成通道。 Active:价格正在尊重该轨道,其区域以中等强度绘制。 Testing:最新收盘价与该轨道相距不到 0.2 倍 ATR,区域绘制得更亮。 Broken:连续两次收盘超出该轨道 0.25 倍 ATR,区域随之淡出。 Retest:突破之后价格再次触及该轨道,并在突破的一侧收盘,绘制得最亮。 Reclaimed:价格重新越过已突破的轨道超过 0.
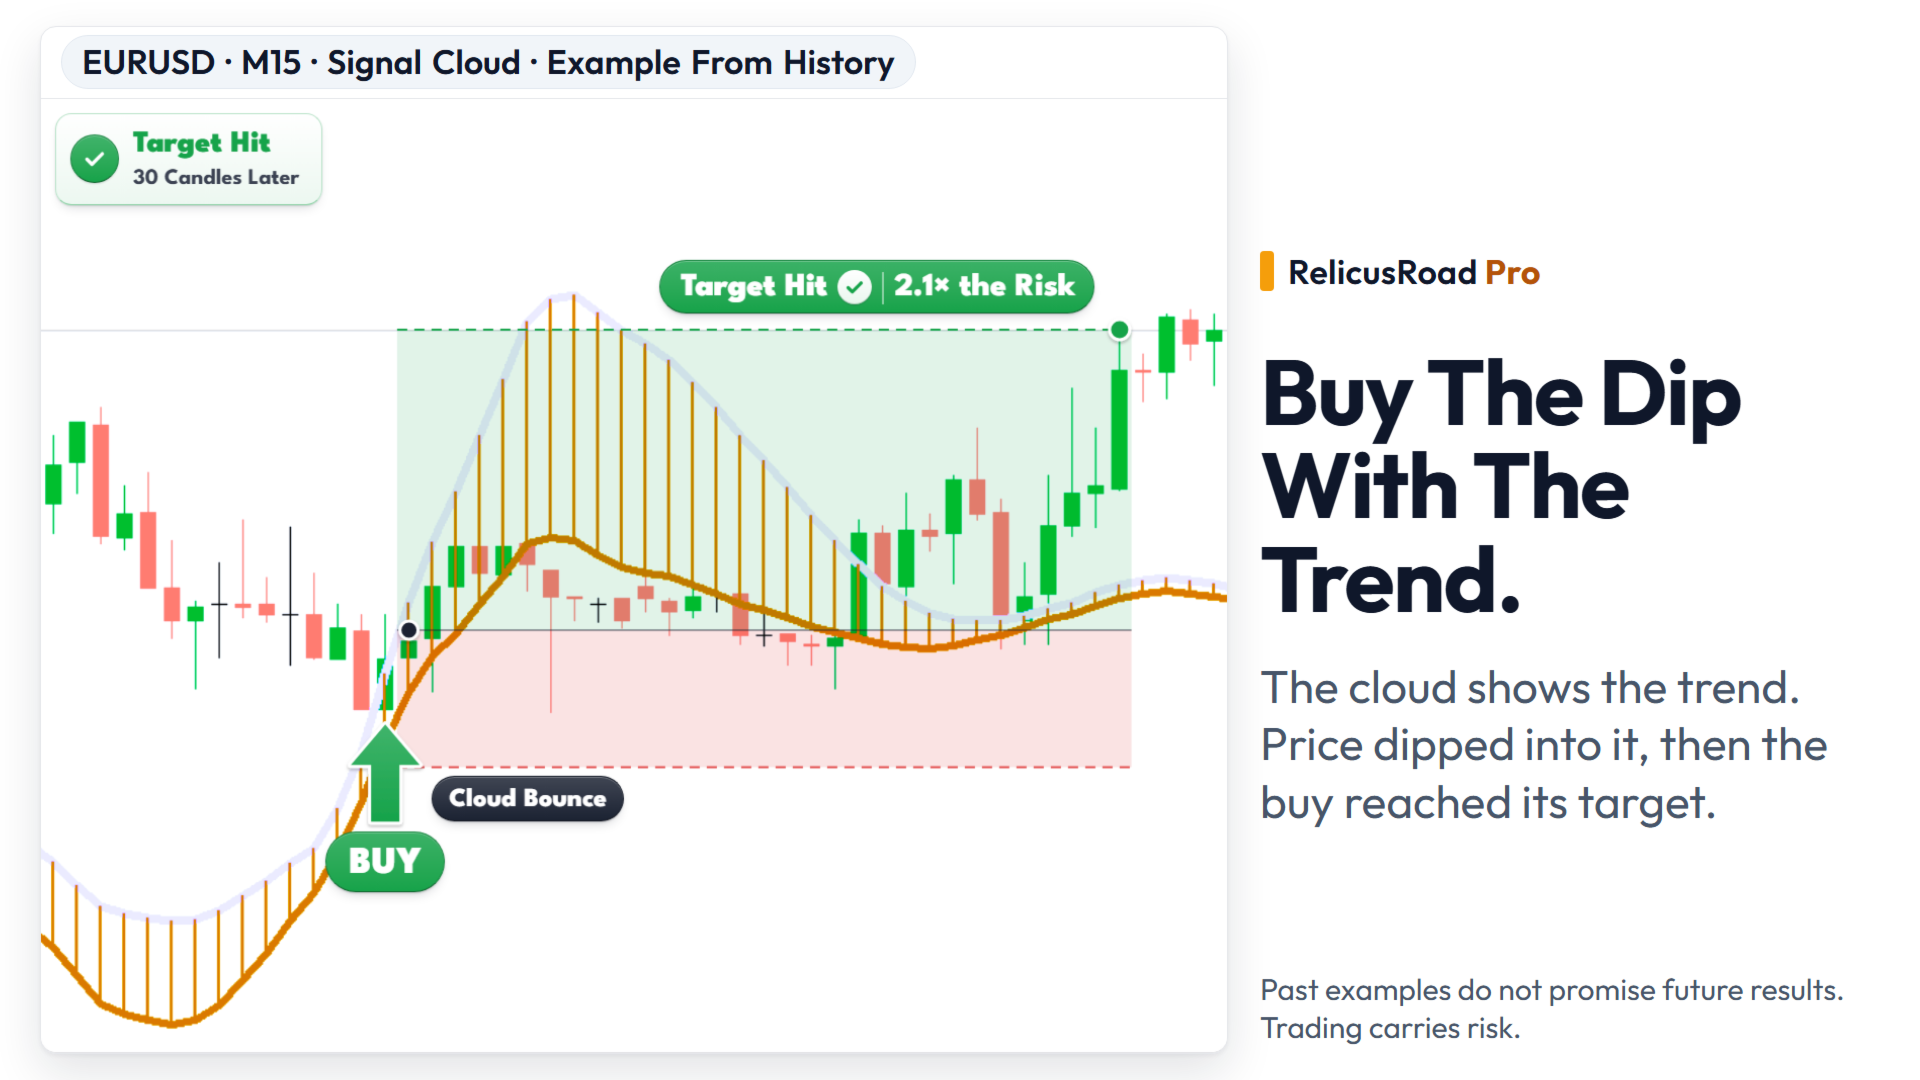
RelicusRoad Signal Cloud 是适用于 MetaTrader 4 和 MetaTrader 5 的云状指标,向前 21 根 K 线投射一条价格区间,其宽度由 12 与 26 周期 EMA 之间的差距决定。 该区间以收盘价的 3 周期 EMA 为中心,并经过平滑处理,使其边界逐渐变化。由于向前偏移,云的一部分始终位于最后一根 K 线的右侧,价格随后会到达此前已经绘制好的那一段。 工作原理 对每一根 K 线,指标测量收盘价 12 与 26 周期指数移动平均之间的绝对差距,即 MACD 线所显示的同一个距离。该差距成为区间的半宽:加到收盘价 3 周期 EMA 上得到上边界,减去则得到下边界。两条边界随后都用 9 周期简单移动平均平滑,并向右绘制 21 根 K 线。 Width:EMA 12 与 EMA 26 之间的距离。 Center:收盘价的 3 周期 EMA,本版本中固定。 Smoothing:对两条边界应用的 9 周期简单移动平均。 Forward shift:默认向右偏移 21 根 K 线。 Daily wait:一个可选的闸门,在每个交易日开始时暂停计算。 Da
RelicusRoad Multi Timeframe Levels 是适用于 MetaTrader 4 和 MetaTrader 5 的多周期支撑阻力指标,把 H1、H4、D1、W1 与 MN1 的最新摆动高点与低点,以水平线的形式绘制在你正在交易的图表上。 这五个周期各自贡献一条阻力线与一条支撑线,因此一张日内图表最多可以承载十条线。每条线都按其来源周期着色,因此无需切换图表即可持续看到更高周期的摆动。 工作原理 对固定集合中的每个周期,指标都会从最近的 K 线向前搜索最新的五根 K 线分形:某根 K 线的最高价未被其两侧各两根 K 线超越。该最高价即成为该周期的阻力线,对最低价进行同样的检验则得到支撑线。只有当某个周期等于或高于图表周期时才会被使用,因此你看到的组合取决于当前图表: M1, M5, M15 and M30 charts:全部五个来源周期,从 H1 到 MN1。 H1 chart:H1、H4、D1、W1 与 MN1,因为图表自身的周期也会包含在内。 H4 chart:H4、D1、W1 与 MN1,H1 的线会被隐藏。 D1 chart:D1、W1 与 MN1。 W1
RelicusRoad Order Blocks 是适用于 MetaTrader 4 和 MetaTrader 5 的订单块指标,寻找位移 K 线,把每一波行情起始的那根 K 线标记为看涨或看跌订单块,并跟踪价格回补进入该区域的深度。 本指标为使用 smart money concepts(SMC)方法的交易者而设计。 工作原理 位移 K 线是指实体至少达到最近 14 根 K 线平均真实波幅(ATR)1.5 倍、且实体占自身最高最低价区间至少 55% 的 K 线。随后指标向前最多回溯三根 K 线,寻找最后一根相反颜色的 K 线,其最高价与最低价即构成该订单块。如果位移 K 线的收盘价还超出了此前 20 根 K 线的最高点或最低点,该订单块会获得更高评分,但结构突破并非必要条件。只使用已收盘的 K 线,因此正在形成的 K 线永远不会创建或改变订单块。每个订单块都有一个角色和一个状态: Bull OB:看涨位移行情的起始位置。 Bear OB:看跌位移行情的起始位置。 Bull Breaker 与 Bear Breaker:价格收盘突破并守住的看跌订单块,或收盘跌破并守住的看涨订单块,依据
RelicusRoad Liquidity Levels 是适用于 MetaTrader 4 和 MetaTrader 5 的流动性价位指标,围绕一条加权均衡线在其上下绘制基于波动率的价位,Simple 与 Smooth 两类通道共七条线。 尽管名称如此,这些价位是波动率带,并非检测出的流动性池或止损簇。中线上方的三条价位称为 Sell 价位,下方的三条称为 Buy 价位。图表上它们标记为 TP/SL-1 至 TP/SL-3,中线标记为 Safe Close,作为目标位与止损位的参考点。 工作原理 中线称为 Neutral 价位,是以加权价格计算的 12 周期线性加权移动平均。指标随后测量价格偏离该线的幅度,并对上行与下行分别加权,因此上下两侧的带宽可以不同。Level 1 与中线的距离是该偏离值的固定倍数,Level 2 为 1.5 倍,Level 3 为 2 倍。Road Type 从以下五种模型中选择一种: Simple Road Narrow (No-Repaint):仅使用过去 61 根 K 线的均值,绘制全部七条线与标签,默认选项。 Simple Road Wide (No
RelicusRoad Support Resistance 是适用于 MetaTrader 4 和 MetaTrader 5 的支撑阻力指标,依据分形摆动构建供需区域,并按强度与近期测试情况为每个区域评级。 指标在价格上下方各自保留一份简要的区域地图,每个区域都标注等级、宽度与近期测试次数。 工作原理 摆动高低点被归纳为价格区域,而不是单一线条。摆动是指其高点或低点在两侧各 7 根 K 线范围内都未被超越的 K 线,其中跨度更大的 15 根 K 线摆动,以及之后出现强烈反应的摆动,权重更高。这些加权摆动沿价格轴累加,密度最高且彼此分开的区域即成为分级区域。每个区域都有一个强度分,每次重复测试都会削弱该分数,区域之间至少保持平均真实波幅(ATR)的 0.75 倍距离,不会重叠。 Verified:在最近 100 根 K 线内被测试过,且仍然强劲。 Weak:在最近 100 根 K 线内被测试过,强度低于 Verified 等级。 Untested:最近 100 根 K 线内没有测试。 Turncoat、Possible 和 Broken:分别为已翻转、未确认和已失效的区域,仅在关闭 U
RelicusRoad Signal Line 是适用于 MetaTrader 4 和 MetaTrader 5 的趋势过滤指标,绘制两条移动平均线,并依据所选的策略过滤器,把每根线段染成绿色、鲑鱼色或灰色。 线条本身显示均线所在的位置,颜色则显示所选过滤器对该 K 线的判断。默认情况下,Line 1 是以 momentum 着色的快速 KAMA 9,Line 2 是以 Ichimoku 着色的慢速 Hull 移动平均 200。 工作原理 每条线都根据设定的均线类型与周期,以收盘价计算得出,下方始终绘制着一条灰色底线。在所选过滤器判断为向上的 K 线上,会在其上绘制绿色线段;判断为向下的 K 线上,线段则为浅鲑鱼色。过滤器无法判断时,灰色底线保持可见。每条线都有自己独立的均线设置与过滤器。 Momentum:上一根已收盘 K 线 5 周期 momentum,与两根 K 线之前的数值比较。 Ichimoku:Tenkan 高于 Kijun,且上一根收盘价高于云层两条边界时为绿色,相反情形为鲑鱼色。 MACD:12、26、9 参数下的主线高于或低于其信号线。 ParabolicSAR:K
RelicusRoad Action Levels 是适用于 MetaTrader 4 和 MetaTrader 5 的支撑阻力价位指标,依据品种自身的波动率与历史反应拟合一套主要与次要价位网格,并为每个价位标注触碰次数。 这套网格既不是固定点差,也不是简单的整数网格。其间距与偏移是从已收盘的 K 线中选取的,每个价位都会根据价格在其周围的表现获得评分,图表上只绘制当前价格附近最强的价位。 工作原理 在默认的 Formula 模式下,指标读取所选周期最多 1200 根已收盘 K 线,收集其中的反应:摆动高低点,以及带有长上下影线的 K 线。随后它会尝试一系列间距方案,分别基于典型 K 线波幅、反应点之间的距离,以及两者的组合,每种方案再配合多个偏移量。最终保留线条与这些反应及历史支撑/阻力拟合得最贴切的那套网格。 Touches:只有当价格明显远离该价位之后,再次触及才会重新计数。 Holds:价格触及该价位后,向有利方向的运行距离大于向不利方向。 Breaks and retests:价格收盘穿越该价位,并在 16 根 K 线内回到该价位。 Recency and stability
RelicusRoad Daily High Low 是适用于 MetaTrader 4 和 MetaTrader 5 的前一日高低点指标,在日内图表的每根 K 线上标出昨日的最高价、最低价与今日的开盘价。 这三条价位以彩色点状线绘制,在新周期开始时跳转到新数值,并在每个周期末尾带有小小的 High、Low 与 Open 标签。在 H1 至 H4 的图表上,同样的标记改为显示上周的区间与本周的开盘价,在 D1 上则显示对应的月度数值。 工作原理 对图表上的每根 K 线,指标都会找出包含它的参考周期。High 与 Low 标记取自上一个周期的最高价与最低价,Open 标记取自该 K 线所属周期的开盘价。参考周期默认跟随图表周期,除非自行选择。 Below H1:日参考:前一日的最高价、最低价,以及当日开盘价。 H1 to H4:周参考:上周的最高价、最低价,以及本周开盘价。 D1:月参考:上月的最高价、最低价,以及本月开盘价。 W1 与 MN1:这些图表上不绘制任何内容。 周期边界跟随经纪商的服务器时间,与平台自身的日线、周线和月线保持一致,没有时区偏移参数。标记在每根新 K 线开盘时重
RelicusRoad Daily Pivots 是适用于 MetaTrader 4 和 MetaTrader 5 的日内枢轴价位指标,将前一日区间划分为斐波那契价位,并向上下两侧延伸,范围从负 100% 到正 200%。 指标不采用经典的地板枢轴公式,而是把前一个已完成的区间当作一把刻度尺,最低价为 0%,最高价为 100%。图表右侧以紧凑的彩色标记打印出十九个价位,因此今日行情的大小可以直接读作昨日区间的分数或倍数。 工作原理 指标取前一个已完成参考周期的最高价与最低价,并在该区间的每个比例处放置一个价位:价位 = 最低价 + 比例 x(最高价 − 最低价)。周末的 K 线会被跳过,因此周一的参考是上一个交易日。参考周期由图表周期决定。 Inside set, gray:0%、23.6%、38.2%、50.0%、61.8%、78.6% 与 100%。 Above set, green:+123.6%、+138.2%、+150.0%、+161.8%、+178.6% 与 +200%。 Below set, red:-23.6%、-38.2%、-50.0%、-61.8%、-78.6% 与
RelicusRoad Dynamic Circles 是适用于 MetaTrader 4 和 MetaTrader 5 的摆动高低点指标,同时以三种回溯长度——9、60 与 156 根 K 线——用圆圈标记转折点。 小转折和大转折出现在同一张图表上,但外观不同。短区间的小圆点表示次要摆动,而较大的中区间与长区间圆环,只会出现在价格创下更长窗口内极值的位置。每个圆圈都可以带上一小段文字标签,例如 HH(60) 或 LL(156)。 工作原理 对每一根 K 线,指标都会检查其最高价是否是最近 N 根 K 线(含自身)中的最高值,如果是,该 K 线就会得到一个高点圆圈。低点的检验方式相同。这项检验只向回看,因此一根 K 线一旦成为目前为止的极值,就会立即被标记。同样的检验会针对三个区间各运行一次: Short range:默认 9 根 K 线,绘制为小圆点。 Medium range:默认 60 根 K 线,绘制为圆环。 Long range:默认 156 根 K 线,绘制为更大的圆环。 标记完成后,会有第二遍处理对结果进行精简。当连续出现多个高点圆圈、之间没有低点圆圈时,只保留其中最高的
RelicusRoad Fractals 是适用于 MetaTrader 4 和 MetaTrader 5 的分形指标,以两种强度标记摆动高低点:Fast 检验两侧各 7 根 K 线,Slow 检验两侧各 15 根 K 线。 两侧各 7 根 K 线的窗口已经能滤掉许多细小的波动,而 Slow 检验要求的窗口是它的两倍多,因此其较粗的箭头挑出的是在更宽范围内依然成立的摆动。两种强度同时显示,因此次要摆动与更大的摆动可以一眼分辨。 工作原理 当一根 K 线左侧窗口内没有更高的高点、右侧窗口内也没有更高或相等的高点时,这根 K 线即为高点分形。若出现相同价位,标记归属于较新的 K 线。低点分形的判定方式与此相反。检验以两个固定强度进行: Fast:高点或低点须在两侧各 7 根 K 线中脱颖而出。 Slow:高点或低点须在两侧各 15 根 K 线中脱颖而出。 由于检验需要右侧的 K 线存在,箭头只能在这些 K 线出现之后才会显示。最新可能出现的 Fast 箭头在 7 根 K 线之前,最新可能出现的 Slow 箭头在 15 根 K 线之前。每个 Slow 分形也必然通过 Fast 检验,因为 1
RelicusRoad Multi Timeframe Trendbar 是适用于 MetaTrader 4 和 MetaTrader 5 的多周期趋势指标,在图表角落以一行彩色圆点显示 M1 至 MN1 共九个周期的 Uptrend、Neutral 或 Downtrend 状态。 每个周期在图表右下角都有一个圆点,其名称显示在上方。颜色表示该周期的状态,因此无需切换图表即可看出哪些周期方向一致。 工作原理 对每个周期,指标都会在该周期当前 K 线上比较两个标准工具:步长 0.02、最大值 0.2 的 Parabolic SAR,以及周期为 14 的 ADX 中 +DI 与 -DI 两条线。只有二者一致时才会显示方向: Uptrend:Parabolic SAR 位于收盘价下方,且 +DI 高于 -DI,默认柠檬绿。 Downtrend:Parabolic SAR 位于收盘价上方,且 -DI 高于 +DI,默认红色。 Neutral:其他所有情况,包括 SAR 与 DI 意见不一致,默认黄色。 ADX 主线未被使用,因此这一行只显示方向,不显示趋势强度。ADX 与 SAR 的设置是固定
RelicusRoad Scalping Pivots 是适用于 MetaTrader 4 和 MetaTrader 5 的摆动点与斐波那契价位指标,在 60 根 K 线的回溯窗口内交替标记摆动高点与低点,并为最新摆动标注斐波那契回撤与延伸价位。 名称中的 pivots 指的正是这些摆动点,而不是 PP、R1、S1 这类经典地板枢轴点。在最新摆动旁边,指标会打印一列百分比标签,因此无需手工绘制斐波那契工具即可读取回撤与延伸价位。 工作原理 当某根 K 线的最高价是最近 Range 根 K 线(含自身)中的最高值时,该 K 线被标记为摆动高点。摆动低点以同样方式判定。这项检验只向回看,因此一根 K 线一旦成为目前为止的极值就会被标记。第二遍处理只保留每段上涨行情中最极端的高点,以及每段下跌行情中最极端的低点,因此标记会交替出现。两侧的命名如下: Bull:在配对的摆动低点之后形成的摆动高点,绘制为柠檬绿圆点。 Bear:在配对的摆动高点之后形成的摆动低点,绘制为洋红色圆点。 请注意命名方式:在本指标中,Bull 标记的是摆动高点,Bear 标记的是摆动低点,这与许多交易者习惯的用法相反。
RelicusRoad SuperTrend 是适用于 MetaTrader 4 和 MetaTrader 5 的 SuperTrend 指标,在上升趋势中于价格下方、在下降趋势中于价格上方绘制一条基于 ATR 的跟踪线。 这是经典的 SuperTrend 算法,没有附加任何其他内容:上升一条线,下降一条线,没有箭头、标签或面板。 工作原理 对每一根 K 线,指标取中位价,即该 K 线最高价与最低价的中点,并在其上下方各设定若干个平均真实波幅(ATR)单位的通道带。当收盘价高于上一根 K 线的上轨时,趋势转为上升;当收盘价低于上一根 K 线的下轨时,趋势转为下降。在这两个事件之间,趋势方向不会改变。 Uptrend:下轨以上升颜色(默认绿色)绘制在价格下方。 Downtrend:上轨以下降颜色(默认金黄色)绘制在价格上方。 Flip:当前活跃的线结束,留出一根 K 线的空白,另一侧的线随之开始。 No neutral state:每一根被计算的 K 线都属于上升或下降一侧,没有中性状态。 SuperTrend 线只会顺着趋势移动。在上升趋势中,下轨可以上升但不会下降,因此它会在价格后方
筛选:
Erwin Fonke
646
Erwin Fonke 2025.09.05 06:45 
 

i am using this indicator in combination with a EA trading assistent. It,s absolute amazing. Almost passed my FTMO challange now. Great work man! Keep it up!

Juan Feliciano
1730
Juan Feliciano 2025.05.07 21:26 
 

great indicator. super clean and accurate entries. just want to know how to join discord pls

Danny Tsang
288
Danny Tsang 2025.05.01 08:58 
 

用户没有留下任何评级信息

Relicus LLC
36890
来自开发人员的回复 Waleed Ur Rehman 2025.05.01 21:40
Sure. Welcome to the RelicusRoad Community! Please check your private message.
Manuel Gonzalez
170
Manuel Gonzalez 2025.02.16 14:46 
 

Good morning everyone. Please to the administrator and owner of the indicator. A few years ago I bought this wonderful indicator and wanted to make it work. There was a gentleman within discord who helped me a lot but due to my inexperience I did not understand the instructions well. Now I have acquired more experience and please would like to recover the accesses to: User Manual + Strategies + Training Videos + Private Group with VIP Access + Mobile Version Available (Separately) Please help me recover these accesses. Thank you very much...

Relicus LLC
36890
来自开发人员的回复 Waleed Ur Rehman 2025.02.17 17:25
Please check your private message :)
ashiem1
49
ashiem1 2024.07.26 23:01 
 

Before I read and understood the documentation or the training that accompanied this indicator, I placed this on my demo chart and was truly overwhelmed with all of the information and insight into what price was doing. What I did understand was I saw price hitting and reacting to a level of resistance along with (at one simple glance) seeing the indicator telling me all of the HTFrames were also trending down. I took that trade and easily hit my TP. I have since been able to go through the training and see where this indicator is much more robust than I could have ever imagined. Anyone trading one of the many strategies included or trading their own can't help but benefit from this purchase. Truly AMAZING!

CHUNGSIK YOU
672
CHUNGSIK YOU 2024.02.09 02:56 
 

Hello, it's been 8 months since I bought the product. I'd like to get a lot of help.

1. RelicusRoad User Guide

2. Training Videos

3. Private Discord Group Access

4. VIP Status

How can I get four support?

please can you send me manual and discord? Thank you

Relicus LLC
36890
来自开发人员的回复 Waleed Ur Rehman 2024.02.14 09:55
Indicator manual has been sent to your private message and you may find required full support guide in it.
Oscar Jesus Murillo Zamora
309
Oscar Jesus Murillo Zamora 2024.02.03 21:55 
 

developer always looking to optimized the product, really good indicator, has evrything you need for your trading, love it

moneyfx3593
19
moneyfx3593 2024.01.24 18:11 
 

I've been using this since April 2021 before it was on MQL5 . Amazing indicator with top notch support and commitment for ongoing development from the RR team. Great/friendly Discord group too!

zaid filtons
141
zaid filtons 2024.01.23 15:53 
 

(i love this indicator) At first i didn't know what i was doing i lost money even though there was tutorial videos i speeded through the tutorial videos thinking i was confident to have a go again and lost again, then i got frustrated thinking it was the creator that had made a bad indicator also put a bad review, the creator contacted me he is really nice guy he offered a 1 to 1 session or either a refund for the indicator... and i am glad i chose the 1 to 1 session. after the 1 to1 session i had it took me a few days to get use to the indicator and the losses i made were made back within few days. yes i do feel like a fool after what i did but most of all this indictor is worth penny the creator has made a discord channel for those who have purchased the indicator in this discord channel you have everything you need for the indicator ... even the creator works on the indicator near enough everyday to make it perfect for those who find faults as in small to big details on the indicator like the alerts signal performance etc. it feels like the creator has made an indicator that is probably worth a lot more than it is like an advert you see with for 2000 dollar plus indicator which a lot cant afford which am glad i bought, i usually wake up late nearly everyday in the afternoon time and for this indicator i wake up so early excited just to trade with the indicator. once a again thank you to the creator and please try not to do what i did at the beginning if you are struggling and you dont know what you are doing , speak to the creator he will help you out the creator took one hour of his time just to teach me what to do which i am very happy he did.

Steffen Schmidt
1059
Steffen Schmidt 2024.01.19 13:43 
 

Not honest business practices. Good luck with your business endeavors with repainting indicator.

Relicus LLC
36890
来自开发人员的回复 Waleed Ur Rehman 2024.01.19 13:58
Our indicator consists of 24 different features. 20 features are non-repaint and only 4 features are repaint. I do not understand what you're referring to and why are you saying it's not honest practice? We have open discord group to discuss any issues, we do not ban anyone unless they try to spam or try to sell their services to other people.
Oneill The Best
57
Oneill The Best 2024.01.05 09:11 
 

don t trust this guys they sell this system but if u don t know how to use it and u ask for help they want 60 $ per month to tell u how it s works lol. so u send me to the guy who have asked for the money Ș))))))) is this a joke? i have spoked to this salahudin today and it was the one asking for the money

Relicus LLC
36890
来自开发人员的回复 Waleed Ur Rehman 2024.01.19 13:56
We do not charge any of our customers to provide guidance on the indicator. Please co-ordinate with Salahuddin on Discord to assist you.
tomaszroman26
171
tomaszroman26 2023.12.03 21:28 
 

A stunning piece of art. This system will provide you with all you need to learn how to build a profitable empire slowly. I have tested it for more than a month and already have great results. The support the developer gives you makes it even better. They always answer with help. I give it 5 stars and highly recommend it if you search for complex solutions!

Qinchao Zhang
681
Qinchao Zhang 2023.11.30 09:37 
 

Many functions are numerous but lack refinement, making them mostly trivial and of little practical value, especially unsuitable for long-term trading.

gogibaidwan
34
gogibaidwan 2023.11.22 23:17 
 

用户没有留下任何评级信息

Relicus LLC
36890
来自开发人员的回复 Waleed Ur Rehman 2023.11.23 05:12
Indicator manual and discord invitation link has been sent to your private message
Arthit Fx
198
Arthit Fx 2023.11.19 09:50 
 

用户没有留下任何评级信息

Relicus LLC
36890
来自开发人员的回复 Waleed Ur Rehman 2023.11.20 05:00
Indicator manual has been sent to your private message
maido
505
maido 2023.11.17 02:37 
 

Please send me the manual and invite me to the discord.

Relicus LLC
36890
来自开发人员的回复 Waleed Ur Rehman 2023.11.17 13:13
Indicator manual and discord invitation have been sent to your private message
aa973140507
42
aa973140507 2023.11.11 04:28 
 

我已经购买了这个指标,使用了几个月,后面才发现没有手册也没有加入discord 小组。

Relicus LLC
36890
来自开发人员的回复 Waleed Ur Rehman 2023.11.15 14:28
一旦您购买并向我们发送消息。然后,我们会通过私人消息向您发送手册以及私人群组的邀请。
Welber Goncalves
412
Welber Goncalves 2023.11.03 16:50 
 

用户没有留下任何评级信息

Relicus LLC
36890
来自开发人员的回复 Waleed Ur Rehman 2023.11.04 16:53
Indicator manual with discord invitation link has been sent to your private message
mjh12345
263
mjh12345 2023.10.31 12:56 
 

Plenty of support if you join Discord, plenty of options to improve your trading combined in one indicator, plenty of strategies to select from dependent upon your trading style, Salahuddin is both friendly and helpful, I'm pretty confident that there is not much else out there that comes close for $147, constant improvement. Once you realise that there are VERY few consistantly profitable EA's and switch your attention and education to manual trading you will realise what an asset this indicator is..........in my opinion.

Update. 31/01/2024

I'm still using the indicator and I have no idea why we have the bad reviews here. I'm very pleased and will most likely purchase the complete set (TV,MT5&4) in the coming months. Thank you guys.

Steve Agleron
330
Steve Agleron 2023.10.20 14:46 
 

Hard to use. its a bit complicated to use and there isn't really much help or support to get started.

Relicus LLC
36890
来自开发人员的回复 Waleed Ur Rehman 2023.10.23 01:58
Did you join the discord group? Because we have dedicated people to help. You can contact Salahuddin for any help. Also if you look at the manual, you can just choose from any one of the strategies and follow through with the strategies on the discord server.
回复评论