KT Alpha Hunter Arrows MT4

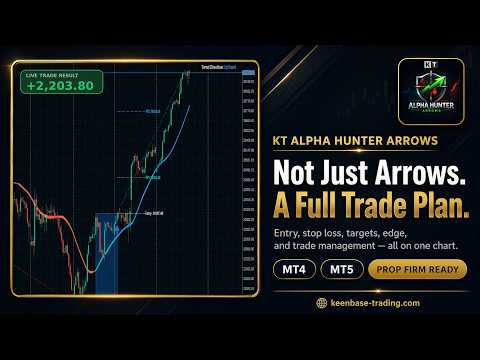
大多数箭头指标只给你一个信号,然后把剩下的判断全部留给你自己。KT Alpha Hunter Arrows 给你的,是一套完整的交易计划。

每一个信号箭头出现时,图表上都会同时绘制完整计划:入场线、止损位、四个止盈目标,以及实时 Edge 结论,告诉你当前品种和时间周期是否值得交易。套装中还包含 Trade Manager EA,在你手动入场后负责后续执行,让你在市场波动和情绪干扰下依然保持纪律。非重绘。只在K线收盘后给出信号。适用于 Forex、黄金、指数,以及你交易的其他任何品种。

核心功能

  • 非重绘买入和卖出箭头,只在K线收盘后出现。
  • 每个信号都带有入场线、结构性止损和四个止盈目标。
  • Edge Dashboard 会分别评估当前图表上的买入和卖出机会。
  • 结论系统:No Edge、Marginal、Tradeable、Good 或 Strong。
  • 一键 Auto Optimize 按钮,可根据当前品种和时间周期自动调整设置。
  • 完整套装包含 Trade Manager EA,并内置五种专为本指标设计的交易管理方案。
  • Prop Firm Risk Panel 可在图表上实时追踪日内回撤和总回撤。
  • 市场交易时段和周收盘背景信息,帮助避开低效时段并降低周末持仓风险。
  • 开放风险追踪器可显示所有持仓的累计风险敞口。
  • 每个交易机会都配有趋势云和风险区域可视化。
  • 适用于 Forex、黄金、指数、加密货币,以及任何 MT4 支持的交易品种。
  • 包含详细用户指南,以及表现较好的交易品种和时间周期 PDF 速查表。
  • 兼容任何 MT4 经纪商和任何账户类型。
  • 包含终身更新。

它有什么不同

Edge Dashboard: 大多数箭头指标会把所有信号都当成同样重要。KT Alpha Hunter Arrows 不会这样做。Edge Dashboard 会在当前图表上分别评估买入和卖出机会,因为同一个市场可能只支持一个方向,而另一个方向反而风险更高。当 Dashboard 结论显示 Strong 或 Good 时,该交易机会更值得关注。当它显示 No Edge 时,即使图表上出现箭头,指标也会提醒你跳过。

Trade Manager EA: 信号只是交易的一半。真正决定账户表现的,往往是出场管理。随附的 Trade Manager EA 会从你的手动入场开始,根据五种管理方案之一执行到最终出场:保护性持仓到 TP4、先平一半再继续持有、在 TP2 全部止盈、先平四分之一再继续持有,或在 TP1 快速止盈。你选择方案,EA 负责部分平仓、移动止损和目标出场。

Prop Firm Panel: 很多 funded trader 不是因为信号差而失败,而是因为违反回撤规则或过度使用仓位。Prop Firm Risk Panel 会把日内回撤、总回撤、开放风险敞口和交易时段背景直接显示在图表上,让你在点击 Buy 或 Sell 之前就能清楚看到规则和风险。

一笔交易如何运行

  1. 将指标加载到图表:把 KT Alpha Hunter Arrows 添加到任意图表。指标会使用适合大多数品种的默认设置加载。
  2. 运行 Auto Optimize:只需一键,指标就会根据当前品种和时间周期调整参数。Edge Dashboard 会更新该图表上买入和卖出方向的实时结论。
  3. 查看结论:如果 Dashboard 在某个方向显示 Tradeable、Good 或 Strong,该方向就值得交易。如果显示 Marginal 或 No Edge,就跳过该图表,继续寻找更好的机会。
  4. 等待箭头出现:箭头只会在K线收盘后打印。信号出现后,图表会绘制入场线、止损位和四个止盈目标。
  5. 检查风险:确认止损距离符合你的账户风险规则。确保价格还没有越过 TP1。Prop Firm Risk Panel 会显示你当前的回撤状态。
  6. 入场并让计划执行:手动开仓。将 Trade Manager EA 加载到图表并选择你的管理方案,EA 会负责后续执行直到最终出场。

五种交易管理方案

随附的 Trade Manager EA 提供五种预设方案。你始终根据指标信号手动开仓。入场后,选择其中一种方案,EA 就会按照该逻辑管理交易直到最终出场。

Plan 1: Protected Run to TP4 当价格朝有利方向移动时,止损会按照结构进行跟踪。四个目标全部保持开放。适合强趋势交易机会,目标是尽可能抓住完整波段。

Plan 2: Bank Half, Run to TP4 在 TP2 平掉一半仓位,剩余仓位通过跟踪止损继续朝 TP4 运行。这是适合大多数交易者的平衡型默认方案。

Plan 3: Take Profit at TP2 全部仓位在 TP2 平仓。简单、快速、纪律性强。对于刚开始使用这套系统的交易者,这是一个很好的起点。

Plan 4: Bank Quarter, Run to TP4 提前平掉四分之一仓位锁定部分利润,剩余四分之三继续朝 TP4 运行。相比 Plan 2,它保留更多上涨空间,但早期锁定的利润较少。

Plan 5: Quick Profit at TP1 全部仓位在 TP1 平仓。适合节奏较短的交易时段、低波动市场,或你希望缩短持仓时间的情况。

为 Prop Firm 和 Funded Trader 打造

KT Alpha Hunter Arrows 包含专为严格账户规则下交易的 prop firm trader 设计的面板。Prop Firm Risk Panel 会在每张图表上显示回撤限制、开放风险和风险规则,让这些规则实时可见,而不是藏在电子表格里。

该面板追踪内容:

  • 日内回撤和总回撤,实时显示在图表上。
  • 所有交易的开放风险,让你在开新仓前了解累计风险敞口。
  • 市场交易时段和背景信息,帮助避开低效时段并降低周末跳空风险。
  • 周收盘提醒,用于提示不适合持有过周末的仓位。

推荐交易品种和时间周期

KT Alpha Hunter Arrows 可运行在任何 MT4 交易品种和任何时间周期上。Auto Optimize 功能会根据你打开的图表自动调整设置。该系统已在 Forex 主要货币对和交叉盘、黄金、指数和加密货币上进行测试。表现会因品种和时间周期而异,有些组合会更稳定地显示较强的 Edge 读数。

如何寻找更好的交易机会:

  • 在你考虑交易的任意图表上运行 Auto Optimize。
  • 交易前查看 Edge Dashboard 结论。
  • 只交易评级为 Tradeable、Good 或 Strong 的机会。
  • 跳过任何评级为 Marginal 或 No Edge 的图表,即使箭头已经出现。

随附的 PDF 速查表列出了 Edge Dashboard 最稳定显示 Good 或 Strong 结论的具体交易品种和时间周期。 你可以把它作为筛选重点图表的起点。

包含内容

KT Alpha Hunter Arrows 是一个完整套装,覆盖从信号生成、交易管理到使用文档的整个交易流程。

通过 MQL5 自动交付:你会收到适用于 MT4 的 KT Alpha Hunter Arrows 指标,并获得所有未来更新。每次购买都包含终身更新。

由我们单独交付:包含五种预设方案的 Trade Manager EA、完整 PDF 用户指南,以及单独的交易品种和时间周期 PDF 速查表。

如何获得完整套装: MQL5 每个产品只能交付一个文件,因此套装中的其他部分会由我们直接发送。购买后,请给我们发送一条消息。完整套装将在一个工作日内交付给你。只需一条消息,即可获得完整套装。

输入参数

KT Alpha Hunter Arrows 的输入参数经过分组整理,重点清晰,让你无需面对数百个复杂选项,也能轻松配置指标。

Signal Engine: 控制信号箭头的检测方式,并为买入和卖出设置独立的回看长度。Adaptive Lookbacks 模式允许指标根据市场波动自动调整周期,这是推荐给大多数用户的设置。

Entry, Stop Loss, and Take Profit: 可开启或关闭入场线、SL 和四个止盈目标的显示,并配置线条颜色。包含 TP1 Risk Fraction 设置,适合希望让 TP1 更靠近入场位的交易者;同时包含 Minimum TP3 Gap 控制,用于过滤区间过小的交易机会。

Signal Zone Boxes: 显示或隐藏风险区域可视化,并可独立设置区域颜色、填充透明度和边框透明度。

Optimizer and Edge Dashboard: 开启或关闭一键优化按钮和主 Edge Dashboard。还包含最小信号数量阈值,避免优化器在数据不足时进行优化。

Trend Cloud and Badge: 开启或关闭趋势云和右上角趋势徽章。可调整趋势云周期,以及多头和空头状态下的配色方案。

专属支持

我们为所有产品问题和故障排查提供专属支持。大多数消息会在一个工作日内得到回复。

推荐产品
The BB Reversal Arrows technical trading system has been developed to predict reverse points for making retail decisions. The current market situation is analyzed by the indicator and structured for several criteria: the expectation of reversal moments, potential turning points, purchase and sale signals. The indicator does not contain excess information, has a visual understandable interface, allowing traders to make reasonable decisions. All arrows appear to close the candle, without redrawin
VR Cub
Vladimir Pastushak
VR Cub 这是获得高质量切入点的指标。该指标的开发是为了促进数学计算并简化对仓位入场点的搜索。多年来,该指标所针对的交易策略已被证明其有效性。交易策略的简单性是其巨大的优势,即使是新手交易者也能成功进行交易。 VR Cub 计算开仓点以及获利和止损目标水平,这显着提高了效率和易用性。查看使用以下策略进行交易的屏幕截图,了解简单的交易规则。 设置、设置文件、演示版本、说明、问题解决,可以从以下位置获取 [博客] 您可以在以下位置阅读或撰写评论 [关联] 版本为 [MetaTrader 5] 计算入场点的规则 开仓 要计算入场点,您需要将 VR Cub 工具从最后一个高点拉伸到最后一个低点。 如果第一个点在时间上早于第二个点,交易者等待柱线收于中线上方。 如果第一个点在时间上晚于第二个点,交易者等待柱线收于中线下方。 根据上述条件,严格在 柱线收盘 后建仓。 换句话说,如果我们在小时图上进行交易,那么从最高点到最低点的时间距离必须超过24小时,最高点和最低点之间的点数必须大于或等于平均价格变动每天。 维持和改变市场地位 可以有多个未平仓头寸;每个头寸都可以单独修改。 VR Cub
True Magic Oscillator
Muhammed Emin Ugur
The   True Magic Oscillator   indicator is designed for signal trading. This indicator generates trend signals. It uses many algorithms and indicators to generate this signal. It tries to generate signals from the points with the highest trend potential. This indicator is a complete trading product. This indicator does not need any additional indicators. The indicator is never repainted. The point at which the signal is given does not change.         Features and Recommendations Works wit
The newest indicator for binary options. The indicator looks for large market turns and gives out qualitative signals for 2 candles ahead. The indicator also works on Forex, but was developed initially under binary options. After the appearance of the arrow, you receive a notification by e-mail, PUSH notification to the phone or an allert at the terminal. Signals appear at the beginning of the new bar. Timeframe 1 hour. Expiration period 2 candles. More than 75% of signals are closed in posi
Automated Trendlines
Georgios Kalomoiropoulos
5 (16)
趋势线是外汇交易中最重要的技术分析工具。不幸的是,大多数交易者没有正确绘制它们。自动趋势线指标是专业交易者的专业工具,可帮助您可视化市场的趋势运动。 有两种类型的趋势线看涨趋势线和看跌趋势线。 在上升趋势中,外汇趋势线是通过价格变动的最低摆动点绘制的。 连接至少两个“最低点”将创建一条趋势线。 在下跌趋势中,趋势线是通过价格走势的最高摆动点绘制的。 连接至少两个“最高点”将创建一条趋势线。 趋势线何时突破? 当看跌蜡烛收于看涨​​趋势线下方并且蜡烛的高点在趋势线上方时,看涨趋势线会被打破。 当看涨蜡烛收于看跌趋势线上方并且蜡烛的低点低于趋势线时,看跌趋势线会被打破。 趋势线何时删除? 当一根完整的蜡烛在看涨趋势线下方形成时,看涨趋势线将被删除。 当完整的蜡烛在看跌趋势线上方形成时,看跌趋势线将被删除。 您可以从输入参数更改看涨和看跌趋势线的颜色和宽度。
Credible Cross System
Muhammed Emin Ugur
Credible Cross System   indicator is designed for signal trading. This indicator generates trend signals. It uses many algorithms and indicators to generate this signal. It tries to generate a signal from the points with the highest trend potential. The indicator works based on instant price movements. This indicator is a complete trading product. This indicator does not need any additional indicators. The indicator certainly does not repaint. The point at which the signal is given does not c
The Serpent Rider Binary Options
Ellan Dirgantara Tholkhah
Embark on the pinnacle of Binary Options evolution. Our indicator isn't just adaptive—it's relentless. Picture a ninja riding a serpent, shadowing its every move; that's how this tool trails the market trend, unwavering till the end. Built upon the foundational prowess of the Ichimoku indicator and honed with an array of fine-tuned oscillators, it epitomizes accuracy and precision. Dive deep without getting lost in the Ichimoku's intricacies—our indicator simplifies the process for you. Perhaps
PipFinite Exit EDGE
Karlo Wilson Vendiola
4.83 (115)
Did You Have A Profitable Trade But Suddenly Reversed? In a solid strategy, exiting a trade is equally important as entering. Exit EDGE helps maximize your current trade profit and avoid turning winning trades to losers. Never Miss An Exit Signal Again Monitor all pairs and timeframes in just 1 chart www.mql5.com/en/blogs/post/726558 How To Trade You can close your open trades as soon as you receive a signal Close your Buy orders if you receive an Exit Buy Signal. Close your Sell orders if
Crosskalp1
Mikhail Bilan
Добрый День уважаемые трейдеры!  Вашему вниманию индикатор созданный и работающий на базе трендовика ADX,  для торговли на смене направления движения который учитывает коррекцию и даёт возможность на ней заработать.  Применяю этот индикатор для скальпинга. Рекомендую таймфреймы от 15 ти минутного(М15) до часового (Н1) периодов.  Красный кружок сигнал на продажу- Sell) Зелёный кружок  сигнал на покупку Buy) Чем меньше ваш таймфрейм тем меньше пунктов вы зарабатываете.   Важно выставлять стопы! !В
Gvs Undefeated Trend   indicator is designed for trend and signal trading. This indicator generates trend signals.  It uses many algorithms and indicators to generate this signal. It tries to generate a signal from the points with the highest trend potential. This indicator is a complete trading product. This indicator does not need any additional indicators.  You can only trade with this indicator. The generated signals are displayed on the graphical screen.  Thanks to the alert features you ca
Quantum Regime Indicator
Gideon Asiamah Yeboah
Product Name:   Quantum Regime Indicator Short Description:   A multi-engine structural regime and volatility filter. Description: Quantum Regime Indicator (QRI) is a sophisticated technical analysis algorithm designed to identify market structure shifts and volatility regimes. Unlike standard indicators that rely on immediate price action, QRI utilizes a hierarchical logic architecture to filter market noise and identify statistical extremes. The indicator is built on the philosophy of "Market
ExactArrows
Pavel Krysanov
3.71 (7)
The main aim of this indicator lies in determining entry and exit points, that is why the ExactArrow indicator does not draw nothing but arrows which show entry and exit points. In spite of apparent simplicity of the indicator, it has complicated analytic algorithms which determine entry and exit points. The indicator generates exact and timely entry and exit signals which appear on the current candle. The indicator generates an average of 1-2 candles before its analogues do. The indicator is ve
Crypto_Forex 指标“CCI 带动态超卖/超买区域”,适用于 MT4,无需重绘。 - 商品通道指数 (CCI) 非常适合顺势交易,顺势而为。 - 非常适合在动态超买区域设置卖出入场点,并在动态超卖区域设置买入入场点,顺势而为。 - 此指标也非常适合与价格行动入场点结合使用。 - 动态超买区域 - 黄线上方。 - 动态超卖区域 - 蓝线下方。 - CCI 震荡指标用于测量当前价格与历史平均价格之间的差额。 - 提供 PC 和移动端提醒。 ............................................................................. Click here to see high quality Trading Robots and Indicators! 本产品为原创产品,仅在 MQL5 网站上提供。
Signal From Level
Yaroslav Varankin
Binary Options Support Resistance Indicator This indicator is designed for binary options trading and effectively shows retracements from support and resistance levels. Signals appear on the current candle. A red arrow pointing downwards indicates a potential selling opportunity, while a blue arrow pointing upwards suggests buying opportunities. All that needs adjustment is the color of the signal arrows. It is recommended to use it on the M1-M5 timeframes as signals are frequent on these timef
HC ARROW
Cuong Pham
The indicator shows you buy/sell signals and does not repaint. It works well with almost all pairs, while the best ones are GBPUSD, XAUUSD and EURUSD. The product works better on H1 and H4. You can change the parameters in the inputs tab to get the best signals and the best trade results on each pair. You can enable/disable alerts when signal appears. The indicator is easy to use. Parameters barstrip & Sensitive: amount of bars to process the highest and lowest prices (relates to the internal l
Advanced Stochastic Scalper
Evgeny Belyaev
4.56 (16)
Advanced Stochastic Scalper - is a professional indicator based on the popular Stochastic Oscillator. Advanced Stochastic Scalper is an oscillator with dynamic overbought and oversold levels, while in the standard Stochastic Oscillator, these levels are static and do not change. This allows Advanced Stochastic Scalper to adapt to the ever-changing market. When a buy or a sell signal appears, an arrow is drawn on the chart and an alert is triggered allowing you to open a position in a timely mann
The Th3Eng PipFinite indicator is based on a very excellent analysis of the right trend direction with perfect custom algorithms. It show the true direction and the best point to start trading. With StopLoss point and Three Take Profit points. Also it show the right pivot of the price and small points to order to replace the dynamic support and resistance channel, Which surrounds the price. And Finally it draws a very helpful Box on the left side on the chart includes (take profits and Stop loss
Pro Magic Signal   indicator is designed for signal trading. This indicator generates trend signals.  It uses many algorithms and indicators to generate this signal. It tries to generate a signal from the points with the highest trend potential. This indicator is a complete trading product. This indicator does not need any additional indicators.  The indicator certainly does not repaint. The point at which the signal is given does not change.  Thanks to the alert features you can get the signals
Binary Option Signal
Yaroslav Varankin
Indicator for binary options arrow is easy to use and does not require configuration works on all currency pairs, cryptocurrencies buy signal blue up arrow sell signal red down arrow tips do not trade during news and 15-30 minutes before their release, as the market is too volatile and there is a lot of noise it is worth entering trades one or two candles from the current period (recommended for 1 candle) timeframe up to m 15 recommended money management fixed lot or fixed percentage of the depo
Wolfe Wave Scanner
Jalitha K Johny
4.5 (2)
Wolfe Waves scanner - It scans all the Symbols and identify the movement of price and it gives confidence in trade. It automatically plots  fifth wave breaks out of the channel. According to the theory behind the pattern, a line drawn from the point at the beginning of the first wave and passing through the beginning of the fourth wave predicts a target price for the end of the fifth wave. If a trader properly identifies a Wolfe Wave as it forms, the beginning of the fifth wave represents an op
Indicador Taurus All4
Fabio Oliveira Magalhaes
Taurus All4 Taurus All4 is a high-performance indicator, it will tell you the strength of the trend, and you will be able to observe the strength of the candle. Our indicator has more than 4 trend confirmations. It is very simple and easy to use. Confirmation Modes Candle Trend Confirmations: When the candle switches to light green the trend is high. When the candle switches to light red the trend is reverting down. When the candle changes to dark red the trend is low. Trendline Trend Confirm
Gioteen Volatility Index (GVI)   - your ultimate solution to overcoming market unpredictability and maximizing trading opportunities. This revolutionary indicator helps you in lowering your losing trades due to choppy market movements. The GVI is designed to measure market volatility, providing you with valuable insights to identify the most favorable trading prospects. Its intuitive interface consists of a dynamic red line representing the volatility index, accompanied by blue line that indicat
Your good friend
Sergei Semenov
Your Good Friends — this is not just an indicator, but your reliable trading assistant, designed for traders who value simplicity, clarity, and stability. It combines the best classic methods of technical analysis — support and resistance levels, reversal signals, visual cues — and presents them in the clearest, most user-friendly format possible. Suitable for both beginners and experienced traders — especially those who want to eliminate chaos, reduce stress, and trade based on clear signals.
Nice Stable Arrow
Muhammed Emin Ugur
Nice Stable Arrow   indicator is designed for signal trading. This indicator generates trend signals. It uses many algorithms and indicators to generate this signal. It tries to generate a signal from the points with the highest trend potential. This indicator is a complete trading product. This indicator does not need any additional indicators. The indicator certainly does not repaint. The point at which the signal is given does not change. Signals are sent at the beginning of new candles.
Entry Signal Arrows   indicator is designed for signal trading. This indicator generates trend signals.  It uses many algorithms and indicators to generate this signal. It tries to generate a signal from the points with the highest trend potential. This indicator is a complete trading product. This indicator does not need any additional indicators.  The indicator certainly does not repaint. The point at which the signal is given does not change.  Thanks to the alert features you can get the sign
ACB Breakout Arrows
KEENBASE SOFTWARE SOLUTIONS
4.15 (34)
ACB Breakout Arrows 指标通过识别一种特殊的突破形态,为交易者提供关键的入场信号。该指标持续扫描图表中某一方向上趋于稳定的动能,并在主要行情启动之前给出准确的进场信号。  点击此处获取多品种、多周期扫描仪 - ACB Breakout Arrows MT4 专用扫描仪 主要功能 指标自动提供止损和止盈位置。 配备 MTF 多周期扫描仪面板,可跟踪所有时间周期的突破信号。 适用于日内交易者、波段交易者和剥头皮交易者。 采用优化算法,提高信号准确性。 提供特殊目标线,用于设置快速平仓点或无损平移位(Quick Profit Line)。 包括胜率、成功率、平均收益等表现分析指标。 不重绘,信号一旦出现即保持不变。 交易确认 -  建议结合使用 ACB Trade Filter 指标 以过滤低质量信号。 强买入: 上箭头 + 绿色柱状图 + 多头趋势。 强卖出: 下箭头 + 红色柱状图 + 空头趋势。 避免交易 :当柱状图为灰色且趋势为震荡时。 (可选) -  建议使用 KT  支撑与阻力位指标  来避免在关键支撑/阻力区域附近开仓。此类交易可能迅速转为亏损,造成不必
Reback
Yazhou Liu
本指标可回溯历史交易,可以一目了然的看到交易位置,交易类型及盈亏情况,还有统计信息。 showlabel用于是否显示统计信息,summary_from是订单统计的开始时间,该参数以订单开仓时间为准。 回溯历史可以帮助我们纠正曾经错误的交易习惯,对于学习手动交易的新手极为重要。 本指标适用于各个时间周期,通过交易标识和划线能非常明显地看出各个订单的具体交易情况,可作为信号卖家的辅助工具使用。         即使加载到当前图标中也能实时看到当前订单的下单位置及盈亏情况。        即使加载到当前图标中也能实时看到当前订单的下单位置及盈亏情况。 本指标可回溯历史交易,可以一目了然的看到交易位置,交易类型及盈亏情况,还有统计信息。 showlabel用于是否显示统计信息,summary_from是订单统计的开始时间,该参数以订单开仓时间为准。 回溯历史可以帮助我们纠正曾经错误的交易习惯,对于学习手动交易的新手极为重要。 本指标适用于各个时间周期,通过交易标识和划线能非常明显地看出各个订单的具体交易情况,可作为信号卖家的辅助工具使用。
Night ghost
Dmitriy Kashevich
Night Ghost - Arrow indicator for binary options. This is a reliable assistant to you in the future! - No redrawing on the chart -Works great on EUR/USD currency pairs! -Indicator accuracy up to 90% (Especially at night) -No long setup required (Perfectly set up for Binary Options) - Not late signals - The appearance of a signal on the current candle -Perfect for M1 period (No More!) - Eye-friendly candle color (Red and Blue) -Installed Alert Working with it: - Blue arrow shows signa
QuantumEdge Trader
Hossam Ali Ahmed Ali
QuantumEdge Trader v1.0 AI-Powered Precision Signals for Serious Traders QuantumEdge Trader is a smart and reliable indicator that delivers accurate BUY and SELL signals using advanced market analysis and trend detection. Designed for M1 to M60 timeframes, it's ideal for scalping and intraday strategies. --- Key Features: No Repaint – Signals never change after appearing Smart trend filters to reduce noise Adjustable sensitivity and alerts Perfect for XAUUSD, EURUSD, and m
Alpha Trend sign Alpha Trend sign 是我么长期以来非常受欢迎的交易工具,它可以验证我们的交易系统,并且明确的提示交易信号,并且信号不会漂移。 主要功能: •  根据市场显示活跃区域,根据指标可以很直观的判断当前行情是属于趋势行情,还是震荡行情。    并根据指标的指示箭头切入市场,绿色箭头提示买入,红色箭头提示卖出。 •  建议使用5分钟以上的时间周期进行交易,避免因为小周期波动出现频繁的交易信号。 •  您也可以开启信号提示,以免错过最佳的交易时机。 •  本指标不但可以很好的预测趋势行情,也可以在宽幅震荡行情中获利。 •  本指标本着大道至简的原则,适合不同阶段的交易者使用。 注意事项: •  Alpha Trend sign 有明确的进出场信号,不建议逆势操作,以免造成损失。 •  Alpha Trend sign 是特别成熟的指标,我们团队人手一个,使用它可以实现稳定盈利。     
该产品的买家也购买
Breakout Arrows Mt4
Michael Oko Oboh
5 (1)
Trend Breakout Arrows Indicator The Trend Breakout Arrows Indicator is a momentum-based signal tool designed to identify potential bullish and bearish breakout opportunities. It displays clear arrow signals directly on the price chart, helping traders quickly recognize possible trend changes and continuation setups. Up Arrow (Buy Signal) A magenta up arrow appears below a candle when bullish momentum begins to strengthen. This signal indicates that buying pressure may be overtaking selling press
Dynamic Scalper System
Vitalyi Belyh
5 (1)
“ Dynamic Scalper System ”指标专为在趋势波内进行剥头皮交易而设计。 已在主要货币对和黄金上进行测试,并可与其他交易工具兼容。 提供顺势短线建仓信号,并提供额外的价格变动支持。 指标原理: 大箭头决定趋势方向。 在趋势波内,我们采用一种生成小箭头形式的剥头皮交易信号的算法。 红色箭头代表看涨方向,蓝色箭头代表看跌方向。 敏感的价格变动线会沿着趋势方向绘制,并与小箭头信号协同作用。 信号运作方式如下:当线在适当时刻出现时,将形成入场信号;在出现线时,持仓;线完成后,平仓。 建议的操作时间范围为M1 - H4。 箭头在当前K线上方形成,如果下一根K线已开仓,则不会重新绘制上一根K线上方的箭头。 输入参数 Trend Wave Period - 趋势方向(大箭头)的周期,改变趋势波的时间间隔。值 1 表示趋势方向的最长持续时间,参数值越大,持续时间越短。 Scalper Arrows Period - 信号箭头(小箭头)的计算周期,改变入场信号的生成频率。值 3 表示最频繁的生成频率,参数值越大,箭头频率越低,准确度越高。 这些参数可以根据不同的时间范
Enigmera
Ivan Stefanov
5 (8)
ENIGMERA: 市场的核心 重要提示:MQL5.com 演示版本在策略测试器中运行,可能无法完全反映 Enigmera 的功能。请查看描述、截图和视频了解详细信息。如有任何问题,请随时联系我! 该指标的代码已完全重写。版本 3.0 增加了新功能并修复了自指标发布以来积累的错误。 简介 这个指标和交易系统是金融市场的一种独特方法。ENIGMERA 使用分形周期来精确计算支撑和阻力水平。它展示了真实的积累阶段,并提供了方向和目标。无论是在趋势中还是在修正中,这个系统都能工作。 它是如何工作的 指标的大部分功能通过图表左侧的按钮控制,使得能够快速响应不同的市场情况。 按钮 ON/OFF – 显示或隐藏整个指标。 Channel – 激活支撑通道,显示可接受的偏差范围。 Dev1 (第一偏差) – 指示价格在支撑偏差内的波动,信号表示市场正在整合或积累力量。 Dev2 (第二偏差) – 显示价格在偏差之间的波动,表示趋势形成和方向。 Dev3 (第三偏差) – 表示趋势的显著加速和高波动性。 45deg (45度) – 显示市场的节奏和相对于 45 度线的运动稳定性。 Tgt1/2
The Propfolio Master Suite is the ultimate all-in-one analytical workstation for professional traders. Combining the power of the Beat The Market Maker (BTMM) methodology, Smart Money Concepts (SND/Liquidity), and Advanced Volume Profile, this suite replaces multiple different indicators with one optimized engine. Monitor up to 14 pairs simultaneously from a single chart, instantly identify market cycles, and seamlessly map institutional footprints with the click of a button. The Command Center
GoldRush Trend Arrow Signal
Kirk Lee Holloway
5 (2)
GoldRush 趨勢箭頭信號 GoldRush 趨勢箭頭信號 指標為 XAU/USD 中的高速、短期短線交易者提供精確、實時的趨勢分析。 專為1分鐘時間框架設計,此工具顯示方向箭頭以明確顯示入場點,使短線交易者能在波動市場中自信操作。 該指標包含主要和次要警示箭頭。主要信號為白色和黑色方向箭頭,用於指示趨勢方向的轉變;次要信號為藍色和紅色箭頭,用於確認主要箭頭指示的方向並提示潛在交易入場點。 注意:當趨勢方向發生變化後僅出現一個主要警報箭頭時,請注意可能會出現多個次要藍/紅箭頭。次要信號將在滿足信號標準的任何蠟燭圖後出現,因此在長期趨勢移動中,螢幕上將顯示大量次要箭頭(如附帶的截圖所示)。您可在設置中開啟或關閉任一箭頭類型。 以下是我使用此指標進行交易的方式: - 對於買入入場,我會耐心等待白箭頭在蠟燭收盤時出現,並在下一根可用蠟燭收盤時出現藍箭頭時進行買入交易。 - 對於賣出入場,我會耐心等待黑箭頭在蠟燭收盤時出現,並在下一根可用蠟燭收盤時出現紅箭頭時進行賣出交易。 - 獲利了結/止損設置由使用者自行負責,但我個人使用最低R:R為1:2,並發現這在倫敦/紐約開盤等
Quant Direction
Georgios Kalomoiropoulos
Quant Direction 是一款三维市场分析工具。它通过同时计算多个维度上的精确百分比偏差,提供完全客观的、基于算法的市场分析视角。该算法采用先进的人工智能建模工具开发,并经过全面测试,旨在以独特的精准度解读市场。它可以分析您平台上的任何货币对或金融工具。 无论您是短线 交易者、日内 交易者还是波段交易者,Quant Direction 都是您的理想之选。 交易者的真正优势 Quant Direction 的真正优势在于彻底消除情绪、屏幕疲劳和过度思考。它无需手动点击十几个图表来寻找方向并反复质疑自己的偏好,引擎即可在几毫秒内即时处理 8 个时间周期(从 5 个月到月线)。它能准确告诉你任何时刻谁在掌控市场,确保你始终朝着概率最高的方向进行交易。 市场分析的三个维度 该算法将市场分为三个不同的交易维度,为您提供完整的宏观和微观视角: 超短线交易分析: 捕捉即时、快速的动量变化和较低时间框架的执行点。 日内分析: 识别真实的、潜在的每日方向性偏差。 波动分析: 专注于宏观趋势,确保您不会与大盘机构的走势背道而驰。 独家评分引擎 Quant Direction 的底层采用了一套
Super Signal – Skyblade Edition 專業級無重繪 / 無延遲趨勢信號系統,擁有卓越勝率 | 適用於 MT4 / MT5 在較低的時間週期上效果最佳,例如 1 分鐘、5 分鐘與 15 分鐘圖表。 核心特色: Super Signal – Skyblade Edition 是一套專為趨勢交易設計的智能信號系統。 其採用多重濾波邏輯,僅篩選出具有明確方向性、動能強勁且波動結構健康的走勢進場點。 本系統 不預測高點或低點 ,只有在同時滿足以下三項條件時才會觸發交易信號: 趨勢方向明確 動能持續增強 波動率結構穩定 此外,系統還結合市場流動性分析,以進一步提升信號的準確性與觸發時機。 信號特性: 所有箭頭信號皆為 100% 無重繪,無延遲 信號一旦出現即固定於圖表,不會閃爍或消失 提供圖表箭頭、資訊面板、彈出通知、聲音提示及推播訊息 支援 EA 呼叫(Buffer 輸出),可整合至自動化交易或信號跟單系統 提供預設參數模板,免調整即可使用,適合新手快速上手 總結: Super Signal – Skyblade Edition 是一款邏輯清晰、穩定高效的專業趨勢型
El indicador "MR BEAST ALERTAS DE LIQUIDEZ" es una herramienta avanzada diseñada para proporcionar señales y alertas sobre la liquidez del mercado basándose en una serie de indicadores técnicos y análisis de tendencias. Ideal para traders que buscan oportunidades de trading en función de la dinámica de precios y los niveles de volatilidad, este indicador ofrece una visualización clara y detallada en la ventana del gráfico de MetaTrader. Características Principales: Canal ATR Adaptativo: Calcula
Gold Channel XAUUSD
Paulo Rocha
5 (4)
Gold Channel is a volatility-based indicator, developed with a specific timing algorithm for the XAUUSD pair, which consists of finding possible corrections in the market. This indicator shows two outer lines, an inner line (retracement line) and an arrow sign, where the theory of the channel is to help identify overbought and oversold conditions in the market. The market price will generally fall between the boundaries of the channel. If prices touch or move outside the channel it is a tradi
Buy Sell Signal Pro Looking for a precise and efficient swing detection tool that clearly identifies market structure turning points? Need consistent and easy-to-read buy and sell signals across different timeframes and instruments? Buy Sell Signal Pro  is designed to deliver accurate swing identification with a clean and practical approach, helping traders interpret price structure with confidence. Overview This indicator detects key market structure points, including: Higher Highs (HH) Higher
CountSig
Yin Zhou Luo
一款信号统计指标(MT4)——实现基于当前图表周期下的单线MA转向和双线MA金叉/死叉统计 . 转向定义:前一K向下或走平,当前K向上,视为转向向上;反之,转向向下。 金死叉定义:前一K快线在慢线下方,当前K快线在慢线上方,为金叉;反之,死叉。 参数及使用说明: 1、可指定统计K线数。 2、可指定4个不同的日内时间段,格式如"03:00-07:59",4个时间段可交叉任意输入。 3、可配置ABC三个浮盈区间段点值。如:分界区间统计小点值设为500,即当某转向信 号出现后到下一反向信号止浮盈<=此点值,计入A区间; 若大于此点值<大分界点值时,计入B区间;若大于“大分界点值”计入C区间。 4、最大/最小浮盈统计。显示所有统计区间内的最大浮盈点值和最小浮盈点值(亏损点值)。 5、输出完整信号,按信号出现顺序排列,如“ACCBCA”之类。 6、综合预测。使用概率、周期、趋势、马尔可夫链等综合概算输出预测该信号出现的归类概率值。 7、加载指定MA线。在当前图表自动载入相应设置的MA线。 8、自适应列宽。以完整显示统计信号数。 9、用法:点击相应统计按钮即输出相应的统计表格.
Linear Trend Predictor — 结合切入点和方向支撑线的趋势指标。按照突破高/低价通道的原理运作。该指标算法过滤市场噪音,考虑波动性和市场动态。 指示器功能  使用平滑方法,显示市场趋势和开立买入或卖出订单的切入点。  适合通过分析任何时间范围内的图表来确定短期和长期的市场走势。  输入参数可适应任何市场和时间范围,允许交易者独立定制指标。  设定的指示信号不会消失,也不会重新绘制——它是在蜡烛收盘时确定的。  几种类型的通知以箭头组合。  该指标既可以作为独立的交易系统使用,也可以作为其他交易系统的补充。  可供任何经验水平的交易者使用。 主要参数 Volatility Smoothing Level - 指标的主要参数,允许您配置指标以实现舒适的操作。 它的数字范围是 1 到 100,从而增加了您可以获得更长趋势运动的平滑度。 通过少量的数字,您可以获得短期走势并快速退出交易。 使用指标进行交易的时刻:  红线和箭头表示下降趋势和卖出开盘信号。止损应根据前一个上分形来设置。  黄线和箭头表示上升趋势和买入开盘信号。止损应根据前一个下分形来设置。
GEM Signal MT4
Shengzu Zhong
GEM Signal Pro GEM Signal Pro 是一款適用於 MetaTrader 4 的趨勢跟隨指標,專為希望在圖表上獲得更清晰訊號、更有結構的交易設定,以及更實用風險管理的交易者而設計。 它不僅僅顯示一個簡單的箭頭,GEM Signal Pro 還能以更清晰、更易讀的方式呈現完整的交易思路。當條件確認完成後,指標可在圖表上顯示進場價、止損價與止盈目標,幫助交易者更有效率地評估交易設定。 運作方式 該指標首先根據其內部邏輯識別有效的初始訊號。 當確認條件滿足後,GEM Signal Pro 會在圖表上顯示完整的交易設定。這讓交易者可以更清楚地看到交易結構,並減少手動分析與計算的工作量。 圖表上的交易價位 對於已確認的訊號,GEM Signal Pro 可顯示: 進場價 止損價 止盈 1 止盈 2 止盈 3 風險報酬比 這讓交易設定更容易理解,也有助於讓圖表分析更有條理。 內建風險管理 風險管理是此指標設計的重要部分。 止損位基於近期市場結構,結合附近的擺動高低點與可選的 ATR 緩衝距離。這能讓交易價位更貼近當前市場條件,而不只是依賴固定距離。 圖表資訊面板 GEM Si
KuKl
IGOR KIRIANEN
The indicator is built on a non-standard Zig Zag, it draws accumulations after which if the price leaves this zone and a test of this zone occurs, then a sound signal is given and an arrow appears - after the test candle closes.The indicator does not redraw its signals, it is very easy to use, there are only three settings 1- this is the zig zag parameter 2- this is the minimum price exit from the zone 3- this is the maximum price exit from the zone. The lower the parameter for Zig Zag, the more
PairMaster Buy Sell Arrow Indicator for MT4 Trade Reversals Like a Pro — Catch Every Swing Point with Precision The PairMaster Buy Sell Arrow Indicator is a powerful MetaTrader 4 tool built to identify high-probability swing trading opportunities . Designed for traders who value accuracy, clarity, and simplicity, PairMaster detects key market turning points and plots intuitive buy and sell arrows directly on your chart. Key Features Accurate Swing Point Detection – Automatically identifies ma
NAM Divergences
NAM TECH GROUP, CORP.
5 (1)
MT4多時限發散和超買/超賣檢測指標。 特徵 -在圖表控制面板上完全可自定義,提供完整的交互。 -隨時隨地隱藏和顯示控制面板。 -有關非大寫差異的實時信息。 -有關超買/超賣情況的實時信息。 -有關規則差異的實時信息。 -有關隱藏分歧的實時信息。 -可用於發散檢測的振盪器:AO,RSI,CCI,MACD,STOCH,RMI,TDI,RSIOMA。 -通知服務(屏幕警報|推送通知)。 概括 使用差異交易有助於發現趨勢減弱或勢頭逆轉。有時,您甚至可以將其用作趨勢持續的信號。我們的工具在一個非常舒適和直觀的控制面板中同時提供所有時間範圍的差異檢測,並具有顯示和隱藏的可能性,以使您的圖表盡可能保持清潔。 您會在選擇的歷史時期實時看到超買和超賣情況,定期背離,隱藏背離和無資本背離。 對於沒有大寫字母的差異,我們會在屏幕上顯示MT4通知,並將通知推送到您的手機!
The Nihilist 5.0 Indicator includes Forexalien and Nihilist Easy Trend trading strategies and systems. It is composed of an MTF Dashboard where you can analyze the different input possibilities of each strategy at a glance. It has an alert system with different types of configurable filters. You can also configure which TF you want to be notified on your Metatrader 4 platform and Mobile application The indicator has the option to view how could be a TP and SL by using ATR or fixed points, even w
Enigma scalper fx
Yonny Pascal Ekwa Mezui
Enigma Scalper  Overview Enigma Scalper Pro is a multi-filter breakout indicator designed for traders who want clean entry signals with confirmation from several technical conditions instead of relying on a single trigger. The indicator combines: 3-Bar Breakout pattern detection Higher Timeframe confluence Bollinger Band extreme filtering RSI momentum analysis Optional EMA trend filtering ATR-based SL/TP projection Signals are generated only after candle close to ensure stable non-repainting beh
Meravith
Ivan Stefanov
5 (3)
做市商工具。 Meravith 将: 分析所有时间周期并显示当前正在运行的趋势。 标注流动性区域(成交量均衡区),即多头与空头成交量相等的位置。 在您的图表上直接显示来自不同时间周期的所有流动性水平。 生成并展示基于文本的市场分析供您参考。 根据当前趋势计算目标位、支撑位和止损位。 计算交易的风险回报比。 根据您的账户余额计算仓位大小,并估算潜在利润。 在市场出现重大变化时,Meravith 还会发出警告。 指标的主要线条: 多头/空头成交量衰竭线 —— 作为目标位使用。 趋势线 —— 指示市场趋势方向。根据市场是多头还是空头而改变颜色,并作为趋势支撑。其颜色主要反映市场情绪。 成交量均衡线(Eq)—— Eq(Volume Equilibrium)是系统的核心。它表示买卖双方成交量的平衡点,即市场流动性所在位置。向上突破 Eq 表示多头倾向,向下突破 Eq 表示空头倾向。突破后,应等待回调——当价格回到相反趋势的偏离线或衰竭线附近时。 使用方法:只需将其添加到图表中。 Meravith 可以分析一切——趋势和回调。 趋势线与某条成交量衰竭线之间的距离越大,说明该方向的成交量越高。 趋
Weis Wave with Alert
Trade The Volume Waves Single Member P.C.
4.82 (22)
Rental/Lifetime Package Options and Privileges' Rent Monthly Six Months   Yearly/Lifetime Weis Wave with Speed with Alert+Speed Index x x x Manual  x x x Quick Set up Video x x x Blog x x x Lifetime Updates x x x Setup and Training Material x x Rectangle Break Alert Tool      x Discord Access Channel "The SI traders" x   How to trade info visit:    http://www.tradethevolumewaves.com   ** If you purchase please contact me to setup your  : training Room and  complete manual access.  This is
Smart4x Institutional Order Blocks v6.0 Advanced Smart Money Concepts (SMC) Indicator with Quality Scoring, Fibonacci Confluence & Multi-Timeframe Analysis The Ultimate Smart Money Trading Tool for Forex, Crypto, Indices, and Commodities Brand:   Smart4x Version:   6.0 Type:   MT4 Indicator Overview Smart4x Institutional Order Blocks v6.0   is a next-generation Smart Money Concepts indicator designed to scout, score, and filter institutional-grade order blocks with unparalleled precision. Bui
Binary Booster
Yaroslav Varankin
5 (1)
Binary Options Trading Indicator: A Reliable Tool for Your Trades This indicator is specifically designed for binary options trading and has proven its high quality, reliability, and adequate accuracy, depending on the dynamics of the chart. Key Points: Signal Interpretation: When a blue cross signal appears, it indicates a potential entry into a trade, though it is considered a weak signal on its own. However, if the blue cross is accompanied by an arrow, it is considered a more reliable buy s
Rtc ML Ai Predictor MT4
Muhammad Faisal Sagala
Rtc ML Ai | Predictor CORE MACHINE LEARNING ENGINE Adaptive ML Market Predictor – Multi-Bar Trend & Candle Forecast What This Indicator Does This indicator is a  real-time market prediction engine  designed to analyze price behavior and estimate  future market tendencies . Unlike conventional indicators, this system  does not rely on static parameters or historical curve-fitting , but adapts its internal state dynamically during live market operation. Instead of using static rules, the indic
SYSTEM INTRODUCTION:   The Binary Options Channels System Is Specifically Designed For Binary Options Trading. Unlike Other Systems And Indicators That Were Adopted From Other Trading Environments For Binary Options. Little Wonder Why Many Of Such Systems Fail To Make Money . Many End Up Loosing Money For Their Users.  A Very Important Fact That Must Be Noted Is The Fact That Application Of Martingale Is not Required. Thus Making It Safer For Traders Usage And Profitability. A Trader Can Use Fi
Fxland Price Reversal Zones (MT4) FXLAND Smart Reversal Indicator is a professional technical analysis tool designed to help traders identify potential price reversal zones and key market turning points with clarity and precision. The best reversal indicator and price return by choosing only one ceiling or floor in each time frame A masterpiece of combining mathematics and Gann, fractal matrix, Fibonacci, movement angle and time. Completely intelligent Key Features Detects potential pr
OrderFlow Absorption – 專業級MT4買賣差與吸收訊號指標 釋放真正訂單流分析的力量,OrderFlow Absorption 是MetaTrader 4上最強大的買賣差(Delta)直方圖與吸收訊號指標。專為想看清每一個價格波動背後真相的交易者設計,這個工具揭示了隱藏的買賣壓力與推動市場的吸收事件。 功能特色 買賣差直方圖視覺化:   以清晰的色彩直方圖即時顯示買方與賣方壓力。 吸收訊號偵測:   先進邏輯自動辨識多空吸收事件,及早預警潛在反轉。 圖表標記:   吸收訊號直接標示於主圖表,方便視覺辨識。 彈出式警報:   新吸收訊號出現時即時通知。 自訂門檻:   過濾弱訊號,專注高勝率機會。 資源管理:   高效運算,適用於大型圖表也能流暢運行。 全品種兼容:   適用於任何商品與週期,包括外匯、指數、商品等。 簡易整合:   參數簡單,快速上手與調整。 OrderFlow Absorption 的邏輯說明 OrderFlow Absorption 採用專利演算法,能在沒有完整Tick數據的情況下,估算每根K棒的買賣壓力(Delta)。它分析成交量、價格行為、K
Quantum Momentum Guard (QMG) Advanced Breakout & Momentum Indicator for MetaTrader 4 Quantum Momentum Guard (QMG) is a next-generation MetaTrader 4 trading indicator designed to identify high-probability breakout opportunities using a powerful combination of advanced momentum analysis and high-level mathematical calculations . Unlike ordinary indicators that generate signals based on a single condition, QMG confirms every breakout with momentum strength and mathematical validation , ensuring
The Hurricane Indicator
Paul Nicholas Clevett
5 (1)
Currently switched to the 4 hour chart - but use other time frames for confirmation. :-)  I change my main time frame based on the market movement at the time. The Hurricane Forex Indicator is a multi time frame indicator that includes such things as Trade Notifications, Trade Calculator, Momentum Indicator, risk reward and much more. We have a free Trade room for our users as well. Please check out the video for full details of how this indicator works as it has over 15 years worth of developme
VTrende Pro mt4
Andrii Diachenko
3 (2)
VTrende Pro MT4 - MTF indicator for trend trading with a display panel for MT5 *** Videos can be translated into any language using subtitles (video language - Russian) Although the signals of the VTrende Pro indicator can be used as signals of a full-fledged trading system, it is recommended to use them in conjunction with the Bill Williams TS. VTrende Pro  MT4 is an extended version of the VTrende indicator. Difference between Pro version and VTrende: - Time zones - Signal V - signal 1-2 wave
Naked Forex Kangaroo Tail Pro Indicator Kangaroo Tail Pro Indicator is a pattern recognition indicator for Forex, Stocks, Indices, Futures, Commodities and Cryptos. The Kangaroo Tail is a multi-bar pattern. The Kangaroo Tail pattern is very effective and is very simple to trade. The strategy that comes with the Kangaroo Tail is based on price action. The indicator does what it was designed for: displaying Kangaroo Tail patterns.   Don't expect to follow the up and down arrows and make money
作者的更多信息
ACB Breakout Arrows MT5
KEENBASE SOFTWARE SOLUTIONS
3.5 (2)
ACB Breakout Arrows 指标通过检测特殊的突破形态,提供市场中的关键入场信号。该指标持续扫描图表中的价格动量,在价格出现重大变动前,提前提供精确的入场信号。 点击此处获取多品种多周期扫描器 - ACB Breakout Arrows MT5 扫描器 主要特点 指标自动提供止损和止盈价格。 内置多周期扫描仪仪表盘,可追踪所有时间周期的突破信号。 适用于日内交易者、波段交易者和剥头皮交易者。 优化算法提升信号精度。 特别设置的快速盈利线用于无亏损移动或短线目标。 支持胜率、盈亏比、平均利润等绩效分析指标。 无重绘,信号可靠。 交易确认 - 可使用 ACB Trade Filter 指标 来过滤低概率的交易信号。 强烈买入: 向上箭头 + 绿色柱状图 + 多头趋势。 强烈卖出: 向下箭头 + 红色柱状图 + 空头趋势。 当柱状图为灰色且趋势为震荡时,应避免交易。 (可选) -  使用  KT 支撑阻力水平指标  避免在重要支撑/阻力位附近入场。这类交易可能迅速变成亏损。 “一个成功交易者的目标是做出最好的交易。金钱只是附属。” —— 亚历山大·埃尔德 输入参数 历史
KT Auto Support Resistance Levels:适用于 MetaTrader 4/5 的多周期支撑阻力、智能区域与水平仪表盘 摆动高点、Pivot 枢轴点、订单块、前期高低点。每个交易者标记市场的方式都不太一样,最后承受代价的往往是图表本身。把太多方法堆在同一张图上,它就不再是一张清晰的地图,而会变成噪音。 KT Auto Support Resistance Levels 正是为了解决这个问题而设计。它会同时扫描月线、周线、日线以及当前周期,然后自动把真正重要的水平直接绘制到您的 MetaTrader 图表上。当图表开始变得拥挤时,只需点击一次,就可以把这些水平合并成干净的 Smart Zones。实时面板还会持续显示价格上方和下方最近的水平,让您不必在图表上来回寻找。 可以把它看作一位永远不会疲惫的图表分析师,始终帮您标记关键位置。 它能为您做什么 从多个经过验证的来源寻找并绘制水平:摆动点、Pivot 枢轴点、前期价格以及订单块中点,覆盖多个时间周期。 当您想要更简洁的图表时,可以把彼此接近的水平合并成清晰的 Smart Zones。 保持一个实时面板,显示
ACB Trade Filter MT5
KEENBASE SOFTWARE SOLUTIONS
ACB Trade Filter indicator provides a way to filtering out the low probability trading entries in a trading strategy. The indicator uses a sophisticated filtration algorithm based on the market sentiment and trend. The MT4 version of the same indicator is available here ACB Trade Filter MT4 Applications Works great with our indicator ACB Breakout Arrows MT5 Filter out low probability signals from any indicator. Avoid over-trading and minimize the losses. Trade in the direction of market sentime
KT Heiken Ashi Smoothed MT4
KEENBASE SOFTWARE SOLUTIONS
KT Heiken Ashi Smoothed 是标准 Heiken Ashi 的平滑版本,同时在趋势反转处绘制买卖箭头,方便即时捕捉信号。凭借这种直观而即时的可视化,交易者能在快节奏的市场中快速做出判断。 当状态由空头转为多头时绘制买入箭头。 当状态由多头转为空头时绘制卖出箭头。 支持手机推送、邮件、声音与弹窗等多通道提醒,确保第一时间获知变动。 Heiken Ashi Smoothed 究竟是什么? 它通过双移动平均对标准 Heiken Ashi 进行二次平滑,过滤虚假信号与噪声。尽管会带来些许滞后,但能清晰揭示摆动点与新兴趋势,让原本肉眼难以分辨的价格动态变得一目了然。利用这些信息,交易者可相应地优化进出场、调整仓位、完善风控,以在外汇、商品乃至指数市场中把握先机。 应用场景 该指标适用于外汇、商品和股票等多种市场。以下五种核心用法可以帮助寻找交易机会和确认行情: 纯蓝色蜡烛且无下影线:显示强劲上升趋势。 纯红色蜡烛且无上影线:显示强劲下降趋势。 趋势拐点常伴随实体极小、上下影线较长的蜡烛,可视为转势信号。
KT Support and Resistance Levels
KEENBASE SOFTWARE SOLUTIONS
KT Auto Support Resistance Levels:适用于 MetaTrader 4/5 的多周期支撑阻力、智能区域与水平仪表盘 摆动高点、Pivot 枢轴点、订单块、前期高低点。每个交易者标记市场的方式都不太一样,最后承受代价的往往是图表本身。把太多方法堆在同一张图上,它就不再是一张清晰的地图,而会变成噪音。 KT Auto Support Resistance Levels 正是为了解决这个问题而设计。它会同时扫描月线、周线、日线以及当前周期,然后自动把真正重要的水平直接绘制到您的 MetaTrader 图表上。当图表开始变得拥挤时,只需点击一次,就可以把这些水平合并成干净的 Smart Zones。实时面板还会持续显示价格上方和下方最近的水平,让您不必在图表上来回寻找。 可以把它看作一位永远不会疲惫的图表分析师,始终帮您标记关键位置。 它能为您做什么 从多个经过验证的来源寻找并绘制水平:摆动点、Pivot 枢轴点、前期价格以及订单块中点,覆盖多个时间周期。 当您想要更简洁的图表时,可以把彼此接近的水平合并成清晰的 Smart Zones。 保持一个实时面板,显示
如果您进行外汇交易,了解货币强弱和货币对相关性等详细信息,可以让您的交易更上一层楼。通过相关性分析,您可以将风险减半,而强弱分析将帮助您最大化利润。 本指标通过结合货币强弱分析和货币对相关性,提供了一种混合的方法,帮助选择最合适的货币对进行交易。 如何使用货币强弱分析 假设您的交易策略在AUD/JPY上提供了买入机会,但通过KT货币强弱分析发现JPY比AUD更强。那么,这笔交易很可能以亏损告终。有了这个指标,您可以轻松避免此类亏损。 如何使用货币对相关性 假设您的交易策略同时在NZD/USD和GBP/JPY上提供了卖出机会。通过KT货币对相关性功能,您发现这两个货币对的相关性达到77%。  由于这些货币对高度相关,同时交易它们只会加倍您的风险。如果在NZD/USD上出现亏损,GBP/JPY上的交易也很有可能出现亏损。 功能特点 快速识别最强和最弱货币,用以验证交易策略生成的交易机会。 通过避免交易高度相关的货币对,将风险降低一半甚至三分之一。 当某个货币成为最强或最弱时,接收警报通知。 通过货币金字塔分析强弱报告,将货币按强到弱进行排序。 详细了解货币强弱分析 货币强弱分析通
KT Asian Breakout
KEENBASE SOFTWARE SOLUTIONS
4 (1)
KT Asian Breakout carefully analyzes the range-bound market during the Asian session and then fires a long or short trade after doing some preassessment based on its inbuilt technical analysis module. The executed orders are closed within a day before the completion of the next day session. The inbuilt technical analysis module checks for the session range and compares it with the last 20 days price movement. If it finds any erratic price movement within the session, the orders are not executed
KT Momentum Arrows MT5
KEENBASE SOFTWARE SOLUTIONS
5 (2)
KT Momentum Arrows 指标基于瞬时突破计算,它结合了价格波动方向中的带宽偏离和新兴波动率。这是一种对动量变化反应灵敏的技术指标,适合在趋势开始阶段发出交易信号。 当价格收于上轨之上时,生成买入信号;当价格收于下轨之下时,生成卖出信号。 该指标使用一个“幅度系数”作为输入参数,同时影响带宽偏离和波动率计算。建议根据不同品种和时间周期仔细选择和优化该系数值以获得最佳效果。 主要特点 信号不重绘! 非常适合动量交易者的进场工具。 性能分析功能:胜率、盈亏比、平均收益等数据可视化展示。 适用于日内交易者、波段交易者和剥头皮交易者。 输入参数 历史K线数量:  用于指标计算的K线数量。 幅度系数:  用于调节带宽偏离和波动率的单一系数。 性能分析:  显示或隐藏性能分析,包括利润趋势线。  提醒设置:  支持弹窗、邮件、推送和声音提醒。 其余参数无需额外解释,简单明了。
KT Auto Fibo MT5
KEENBASE SOFTWARE SOLUTIONS
5 (1)
KT Auto Fibo根据当前的趋势方向自动绘制斐波那契回撤水平。最高点和最低点是根据图表上可用的最大值和最小值自动选择的。您可以通过缩放和滚动图表来相应地调整斐波那契水平。 模式 自动:  根据图表区域自动绘制斐波那契水平。 手动: 仅绘制一次斐波那契水平,之后您可以手动调整锚点。 使用方法: 帮助您合理预测未来的获利目标。 结合支撑/阻力位或趋势线使用时,具有较强的反转可能性。 在趋势市场中提供低风险的入场机会。 输入参数 自动:  无需人为干预即可绘制斐波那契回撤水平。 手动:  仅绘制一次斐波那契回撤水平,之后可以手动拉伸锚点。 显示未回撤区域: 在图表上显示或隐藏尚未被价格回撤触及的区域。 其余输入项为直观设置,无需额外解释。
KT Heiken Ashi Smoothed MT5
KEENBASE SOFTWARE SOLUTIONS
KT Heiken Ashi Smoothed 是标准 Heiken Ashi 的平滑版本,同时在趋势反转处绘制买卖箭头,方便即时捕捉信号。凭借这种直观而即时的可视化,交易者能在快节奏的市场中快速做出判断。 当状态由空头转为多头时绘制买入箭头。 当状态由多头转为空头时绘制卖出箭头。 支持手机推送、邮件、声音与弹窗等多通道提醒,确保第一时间获知变动。 Heiken Ashi Smoothed 究竟是什么? 它通过双移动平均对标准 Heiken Ashi 进行二次平滑,过滤虚假信号与噪声。尽管会带来些许滞后,但能清晰揭示摆动点与新兴趋势,让原本肉眼难以分辨的价格动态变得一目了然。利用这些信息,交易者可相应地优化进出场、调整仓位、完善风控,以在外汇、商品乃至指数市场中把握先机。 应用场景 该指标适用于外汇、商品和股票等多种市场。以下五种核心用法可以帮助寻找交易机会和确认行情: 纯蓝色蜡烛且无下影线:显示强劲上升趋势。 纯红色蜡烛且无上影线:显示强劲下降趋势。 趋势拐点常伴随实体极小、上下影线较长的蜡烛,可视为转势信号。
KT Psar Arrows
KEENBASE SOFTWARE SOLUTIONS
KT Psar Arrows使用标准的抛物线转向指标(Parabolic SAR)在图表上绘制箭头。当蜡烛的最高点触及SAR时绘制看涨箭头;当蜡烛的最低点触及SAR时绘制看跌箭头。信号在实时生成,无需等待K线收盘。  特点 对于想要基于抛物线SAR指标开发交易策略的交易者来说,这是一个非常有用的工具。  可以用于寻找市场中的转折点。 支持自定义PSAR参数输入。 提供所有MT4的提醒功能。 注意事项:抛物线SAR是一个滞后且严格机械化的指标。每一笔潜在交易都应该通过明确定义的规则进行筛选。     输入参数 PSAR步长:输入步长值。 PSAR最大值:输入最大值。 显示PSAR点:显示/隐藏PSAR点。即使不显示PSAR点,箭头功能也能正常工作。 其余输入项均为直观设置,无需特别说明。
KT Round Numbers MT5
KEENBASE SOFTWARE SOLUTIONS
KT Round Numbers plots the round number levels which are also commonly known as psychological levels in the Forex world. In the context of Forex trading, round number levels are those levels in which there are two or more zeroes at the end. They are named as 00 levels on the chart. Some traders also consider the halfway points as a valid round number level. They are named as 50 levels on the chart. Use of round number levels in trading Round number levels work as strong support and resistance
ACB Breakout Arrows
KEENBASE SOFTWARE SOLUTIONS
4.15 (34)
ACB Breakout Arrows 指标通过识别一种特殊的突破形态,为交易者提供关键的入场信号。该指标持续扫描图表中某一方向上趋于稳定的动能,并在主要行情启动之前给出准确的进场信号。  点击此处获取多品种、多周期扫描仪 - ACB Breakout Arrows MT4 专用扫描仪 主要功能 指标自动提供止损和止盈位置。 配备 MTF 多周期扫描仪面板,可跟踪所有时间周期的突破信号。 适用于日内交易者、波段交易者和剥头皮交易者。 采用优化算法,提高信号准确性。 提供特殊目标线,用于设置快速平仓点或无损平移位(Quick Profit Line)。 包括胜率、成功率、平均收益等表现分析指标。 不重绘,信号一旦出现即保持不变。 交易确认 -  建议结合使用 ACB Trade Filter 指标 以过滤低质量信号。 强买入: 上箭头 + 绿色柱状图 + 多头趋势。 强卖出: 下箭头 + 红色柱状图 + 空头趋势。 避免交易 :当柱状图为灰色且趋势为震荡时。 (可选) -  建议使用 KT  支撑与阻力位指标  来避免在关键支撑/阻力区域附近开仓。此类交易可能迅速转为亏损,造成不必
ACB Trade Filter MT4
KEENBASE SOFTWARE SOLUTIONS
5 (1)
The ACB Trade Filter indicator provides a solution for filtering out the low probability trading setups in a trading strategy. The indicator uses a sophisticated filtration algorithm based on the market sentiment and trend. Applications Works great with our indicator " ACB Breakout Arrows ". Filter out low probability signals from any indicator. Avoid overtrading and minimize the losses. Trade in the direction of market sentiment and trend. Avoid the choppiness in the market. How to use Only L
KT Momentum Arrows
KEENBASE SOFTWARE SOLUTIONS
KT Momentum Arrows 指标基于瞬时突破计算,它结合了价格波动方向中的带宽偏离和新兴波动率。这是一种对动量变化反应灵敏的技术指标,适合在趋势开始阶段发出交易信号。 当价格收于上轨之上时,生成买入信号;当价格收于下轨之下时,生成卖出信号。 该指标使用一个“幅度系数”作为输入参数,同时影响带宽偏离和波动率计算。建议根据不同品种和时间周期仔细选择和优化该系数值以获得最佳效果。 主要特点 信号不重绘! 非常适合动量交易者的进场工具。 性能分析功能:胜率、盈亏比、平均收益等数据可视化展示。 适用于日内交易者、波段交易者和剥头皮交易者。 输入参数 历史K线数量:  用于指标计算的K线数量。 幅度系数:  用于调节带宽偏离和波动率的单一系数。 性能分析:  显示或隐藏性能分析,包括利润趋势线。  提醒设置:  支持弹窗、邮件、推送和声音提醒。 其余参数无需额外解释,简单明了。
KT COG Advanced MT4
KEENBASE SOFTWARE SOLUTIONS
1 (1)
KT COG is an advanced implementation of the center of gravity indicator presented by John F. Ehlers in the May 2002 edition of Technical Analysis of Stocks & Commodities magazine. It's a leading indicator which can be used to identify the potential reversal points with the minimum lag. The COG oscillator catches the price swings quite effectively. MT5 version of the same indicator is available here KT COG Advanced MT5 Calculation of COG The COG indicator is consist of the two lines. The main l
KT Pin Bar
KEENBASE SOFTWARE SOLUTIONS
KT Pin Bar identifies the pin bar formation which is a type of price action pattern which depicts a sign of reversal or rejection of the trend. When combined with support and resistance, BRN and other significant levels, Pin Bar pattern proved to be a very strong sign of reversal. Basically, a pin bar is characterized by a small body relative to the bar length which is closed either in upper or lower 50% part of its length. They have very large wicks and small candle body. A pin bar candlestic
KT Trend Magic
KEENBASE SOFTWARE SOLUTIONS
KT Trend Magic shows the trend depiction on chart using the combination of market momentum and volatility. A smoothing coefficient is used to smooth out the noise from the signal.It can be used to find out the new entries or confirm the trades produced by other EA/Indicators. Usage Drag n drop MTF scanner which scans for the new signals across multiple time-frames. Find new entries in the trend direction. Improve the accuracy of other indicators when used in conjunction. Can be used as a dynami
KT Auto Fibo
KEENBASE SOFTWARE SOLUTIONS
KT Auto Fibo根据当前的趋势方向自动绘制斐波那契回撤水平。最高点和最低点是根据图表上可用的最大值和最小值自动选择的。您可以通过缩放和滚动图表来相应地调整斐波那契水平。 模式 自动:  根据图表区域自动绘制斐波那契水平。 手动: 仅绘制一次斐波那契水平,之后您可以手动调整锚点。 使用方法: 帮助您合理预测未来的获利目标。 结合支撑/阻力位或趋势线使用时,具有较强的反转可能性。 在趋势市场中提供低风险的入场机会。 输入参数 自动:  无需人为干预即可绘制斐波那契回撤水平。 手动:  仅绘制一次斐波那契回撤水平,之后可以手动拉伸锚点。 显示未回撤区域: 在图表上显示或隐藏尚未被价格回撤触及的区域。 其余输入项为直观设置,无需额外解释。
KT Ichimoku Trader
KEENBASE SOFTWARE SOLUTIONS
1 (1)
KT Ichimoku Trader is a fully automated expert advisor that offers five popular trading strategies based on the Ichimoku indicator. Each strategy has it's own entry and exit method without any interference to other strategies. The Ichimoku system can be applied to all major currency pairs and metals. However, we found that it performs reasonably well mainly on two pairs.   MT5 Version is available here  https://www.mql5.com/en/market/product/35043 Features Trade up to 5 famous trading strategi
KT Volatility Oscillator
KEENBASE SOFTWARE SOLUTIONS
KT波动率振荡器通过数学公式分析过去和当前的市场数据,以振荡器的形式显示结果。振荡器中波浪的增长和减弱分别对应于资产的高波动性和低波动性。  简单来说,波动率就是衡量资产在一定时间内价格波动幅度的指标。没有波动性,市场上的价格变化将非常有限,交易者也将难以从价格波动中获利。 外汇市场中波动率的应用 在外汇市场中利用波动率,可以帮助你更有效地进行交易,同时让你的预期更加符合实际情况。  高波动性 基于趋势的交易系统在高波动市场中表现出色,因为价格波动幅度大,趋势持续时间长,直到出现趋势反转。 如果突破发生在高波动期间,突破系统可以从市场中获得更多的点数收益。 低波动性 均值回归系统在低波动性环境下表现良好,因为市场有回归均值的特性。 基于通道的系统在市场盘整期,即低波动阶段,能够更加有效地发挥作用。 非方向性指标 KT波动率振荡器是一种非方向性指标,不与市场的牛市或熊市趋势直接相关。波动性的上升可能出现在牛市或熊市两种情形下。  输入参数 波动率周期:   一个整数值,用于设定计算的周期。 文本信息:   在图表上显示或隐藏信息文本。 ----- 警报设置 ----- 声音警报
KT COG Robot
KEENBASE SOFTWARE SOLUTIONS
KT COG Robot is a fully automated Expert Advisor based on the KT COG Indicator . The COG indicator was originally presented by John F. Ehlers in the May 2002 edition of Technical Analysis of Stocks & Commodities magazine. The EA fires a long trade when COG line cross above the signal line and a short trade is fired when the COG line cross below the signal line.  Adaptive Filtration Our adaptive filtration algorithm combines the original COG formula with the major trend direction and market acce
ACB Breakout Arrows EA
KEENBASE SOFTWARE SOLUTIONS
这是一款基于我们自定义指标 “ACB Breakout Arrows” 的全自动化智能交易系统。入场基于一种常见的双向突破模式,可通过外部参数“Signal Sensitivity”来调节入场信号的强度。 交易确认机制 ACB Breakout Arrows EA 可通过另一个自定义指标 ACB Trade Filter 来过滤不理想的入场信号,提高交易准确性。 强烈买入: 向上箭头 + 绿色柱状图 + 多头趋势。 强烈卖出: 向下箭头 + 红色柱状图 + 空头趋势。 当柱状图为灰色并且趋势为震荡时,EA 将避免交易。 EA 会在后台加载所有相关指标和依赖项,指标不会显示在图表上。 主要功能亮点 长期以来的呼声终于实现,现在您可以通过我们 ACB Breakout Arrows 指标 实现完全自动化交易。 ACB Trade Filter 也已集成在 EA 中,用于模拟完整的交易系统。 无需额外下载,所有指标和依赖都内嵌在 EA 中。 可直接从指标中提取止损和止盈目标。 通过内置过滤器(如交易时段、MMI、Vortex、波动率、市场状态等)进一步提升性能。 提供三阶段的部分平仓
KT London Breakout
KEENBASE SOFTWARE SOLUTIONS
First thirty minutes are essential for a trading session. The early reaction of traders and market players sets a path for the rest of the day. KT London Breakout EA takes advantage of this phenomenon, and after analyzing the first thirty minutes of London session, it places two bidirectional pending orders. One of pending order is eventually canceled after realizing the market direction with certainty. It has been strictly tested and developed for EUR/JPY using 30-Min Time Frame. You can expe
MACD Divergence Seeker
KEENBASE SOFTWARE SOLUTIONS
KT MACD Divergence Seeker trades the regular and hidden divergence signals generated by our free indicator named KT MACD Divergence indicator. Trading the standalone divergences can be a risky affair that's why the KT MACD Divergence Seeker combines the standard divergence signals with an advanced analysis module to exploit the price inefficiencies on some FX pairs. What is the Divergence exactly? As a general conception if the price is making higher highs, then macd should also be making hig
KT Asian Breakout Indicator
KEENBASE SOFTWARE SOLUTIONS
KT Asian Breakout 指标分析亚洲交易时段的关键部分,以生成双向买卖信号,并基于价格突破的方向进行交易。当价格突破该交易时段的最高点时,会出现买入信号;当价格突破最低点时,会出现卖出信号。 注意事项 如果交易时段的范围过大,建议避免新交易,因为大部分价格走势已在该时段内完成。 如果突破K线过大,价格通常会在继续沿信号方向运行之前发生短暂回调。 功能特点 买入/卖出信号包含止损和盈利目标。 KT Asian Breakout 指标持续监测其表现,并使用第一、第二或第三盈利目标作为成功标准。 显示三个关键性能指标,包括盈亏信号、成功率和每个信号的平均点数。 如果突破K线过大,图表上会显示警告信息。 推荐设置 时间周期: 15分钟。 交易货币对: 所有 JPY 货币对。 输入参数 绘制交易时段框 :  true/false 绘制止损和盈利目标 :  true/false 性能分析 : true/false 显示文本分析(左上角) :  true/false 成功率标准 :  第一目标 | 第二目标 | 第三目标 颜色和样式设置 :  可自定义 警报设置 :  可自定义
MACD Divergence MT4
KEENBASE SOFTWARE SOLUTIONS
KT MACD 背离指标显示价格与振荡器之间的常规背离和隐藏背离。如果你的交易策略是基于趋势反转,可以使用 MACD 的常规背离来捕捉潜在的转折点。而如果你的策略是基于趋势延续,MACD 的隐藏背离将是一个不错的选择。 KT MACD 背离的局限性 将 MACD 背离作为单独的入场信号可能存在一定风险。并非所有的背离都能解释为反转信号。为了获得更好的效果,建议将其与价格行为分析和其他交易方法结合使用。 功能特点 标记价格与振荡器之间的常规和隐藏背离。 为提高准确率并减少图表杂乱,会自动忽略不对称的背离。 支持趋势反转和趋势延续两种交易策略。 完全支持嵌入到智能交易系统中使用。 可用于入场信号和出场信号。 支持所有 MetaTrader 警报功能。 什么是背离? 一般来说,如果价格创出更高高点,那么振荡器也应创出更高高点;如果价格创出更低低点,那么振荡器也应同步走低。当这种正常的行为没有出现时,就表示价格和振荡器之间出现了背离。背离主要分为两种类型: 常规背离 常规看涨背离:当价格创出更低低点,但振荡器却创出更高低点。 常规看跌背离:当价格创出更高高点,但振荡器却创出更低高点。
KT Bollinger Bands Trader MT4
KEENBASE SOFTWARE SOLUTIONS
KT Bollinger Bands Trader 是一款 100% 自动化的智能交易顾问(EA),基于布林带在低波动时期的均值回归交易策略构建。价格经常在布林带的上轨或下轨附近产生反应,但并非每次都会发生反转。然而,在低波动期间,价格反转的可能性更高。 入场规则 当价格正确下穿布林带下轨时,开启买入交易。 当价格正确上破布林带上轨时,开启卖出交易。 出场规则 在低波动阶段结束时自动平仓。 也可在达到止损或止盈时平仓。 本 EA 在经典布林带策略基础上进行了诸多改进,允许用户通过内置的趋势过滤器、波动率过滤器、Vortex、MMI 和星期过滤器等工具,对策略进行细致调节。 输入参数 ----- 策略设置 ----- 布林带周期、带移位、带偏差 开始时间(Start Hour) 结束时间(End Hour) GMT 时区偏移(GMT offset) ----- 交易设置 ----- 手数类型:固定手数 | 自动手数 每单风险百分比(Risk Per Trade) ----- 出场设置 ----- 止损方式:无止损 | 基于波动率 | 固定点数 止盈方式:无止盈 | 基于波动率 |
KT CCI Divergence MT4
KEENBASE SOFTWARE SOLUTIONS
KT CCI Divergence shows the regular and hidden divergence created between the price and CCI oscillator. Divergence is one of the vital signals that depicts the upcoming price reversal in the market. Manually spotting the divergence between price and CCI can be a hectic and ambiguous task. Limitations of KT CCI Divergence   Using the CCI divergence as a standalone entry signal can be risky. Every divergence can't be interpreted as a strong reversal signal. For better results, try to combine it w
KT MA Crossover MT4
KEENBASE SOFTWARE SOLUTIONS
KT MA Crossover 指标根据所选的移动平均线交叉绘制买入和卖出箭头。此外,它还会生成相应的提醒通知,并为每个连续信号显示 MFE(最大有利偏移)值,帮助交易者更好地了解潜在利润区域。 移动平均交叉策略是全球交易者广泛采用的一种经典技术分析方法。通常包含一条快速和一条慢速的移动平均线,根据交叉的方向来确定买入或卖出的交易信号。 买入信号 - 快速均线向上穿越慢速均线。 卖出信号 - 快速均线向下穿越慢速均线。 功能特点 每项均线参数都可完全自定义设置。 每个连续信号都会显示对应的 MFE 值。 代码轻量,占用系统资源极少。 包含所有 MetaTrader 系统提示和警报。 缺点  移动平均线是一种滞后性指标,主要依赖历史数据。在盘整行情中,均线交叉信号可能显得较为随机,容易产生假信号。因此,交易者在实际应用中需要根据自身判断灵活处理这些信号。 输入参数 历史K线数量:  用于计算信号的历史K线数量。 ----- 选择用于计算快慢移动平均的周期和方法 ----- 显示均线:  在图表上显示或隐藏移动平均线(不影响交叉信号)。 绘制利润线: 显示或隐藏 MFE 曲线。 
筛选:
无评论
回复评论