SupplyDemandZoneLines
- 指标
- 版本: 1.2
- 更新: 12 五月 2025
- 激活: 5

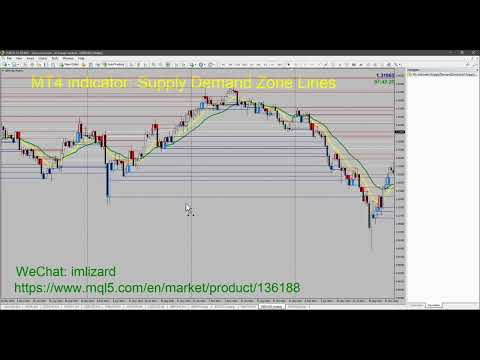
供求区关键价指标
背景
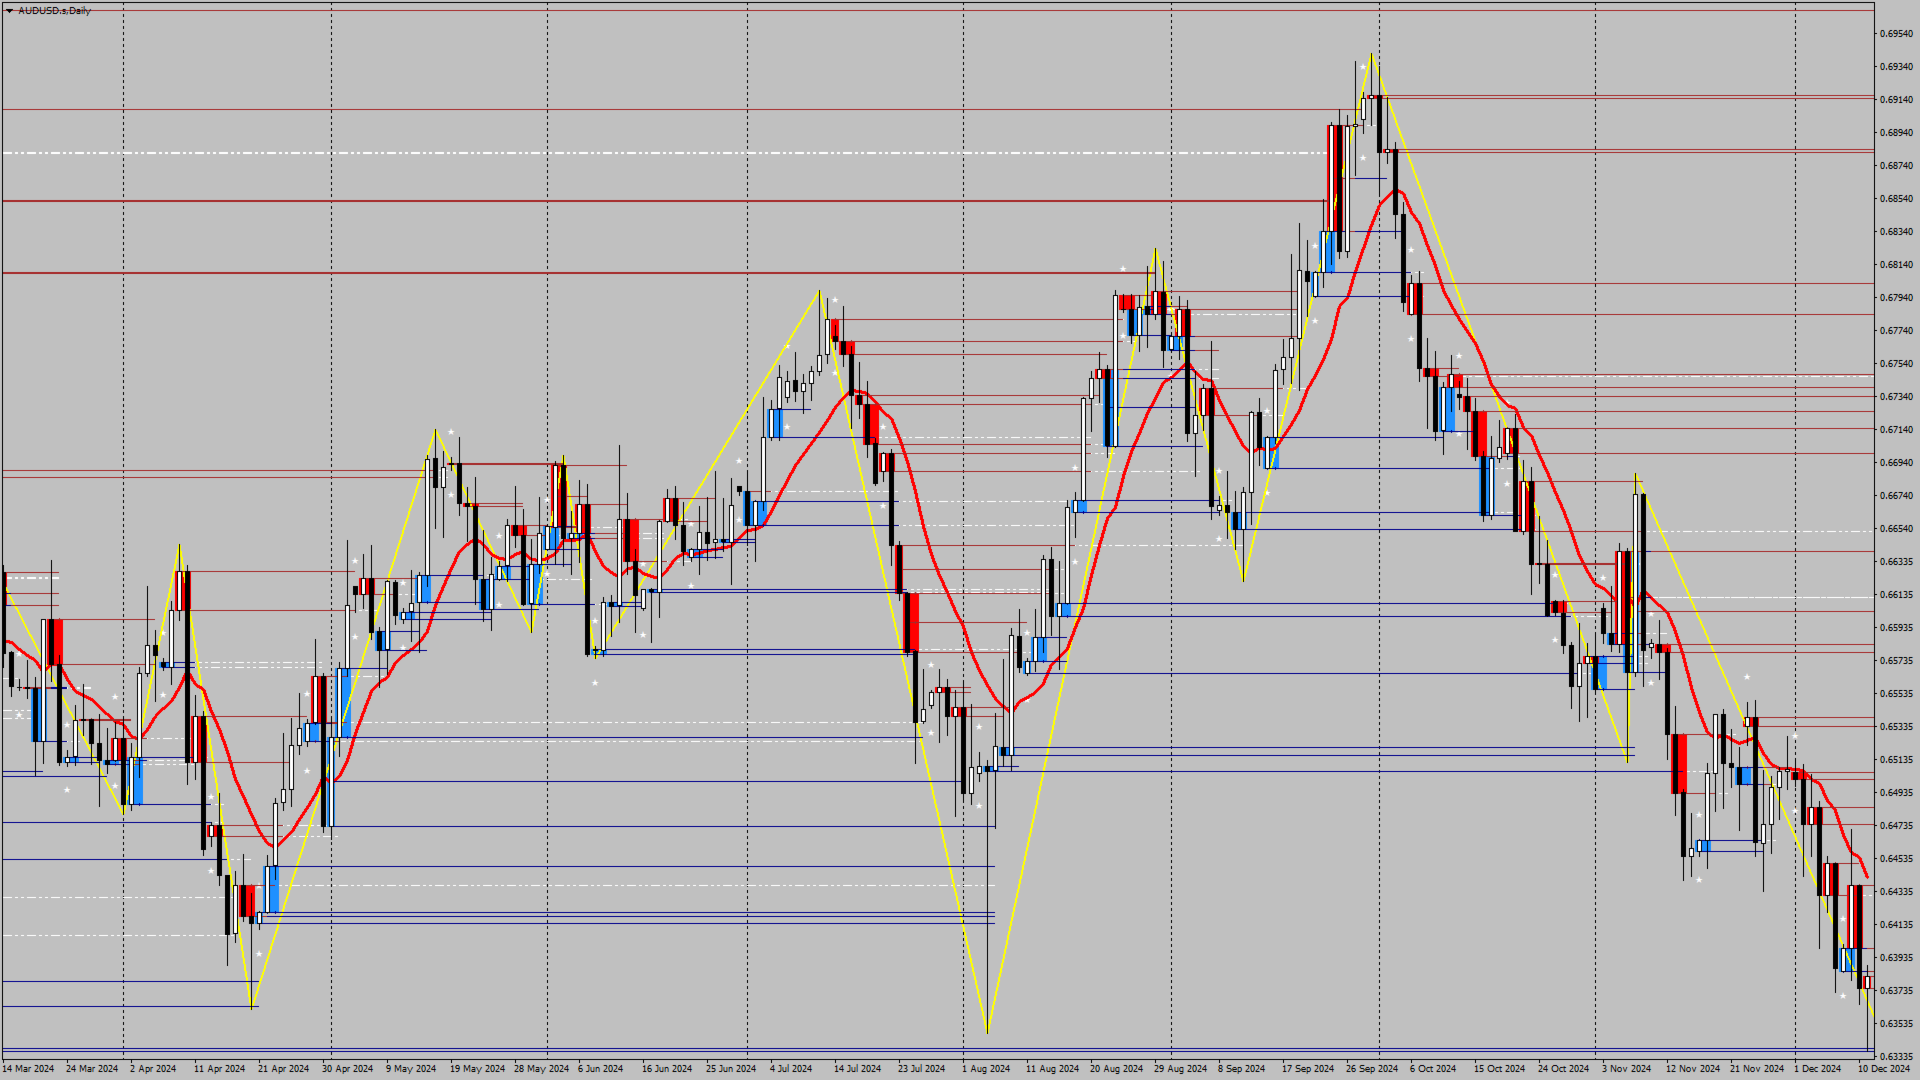
系统自动搜索K线中的供求区域,并画出实时的关键价格线,交易者可以根据价格交易线进行交易。
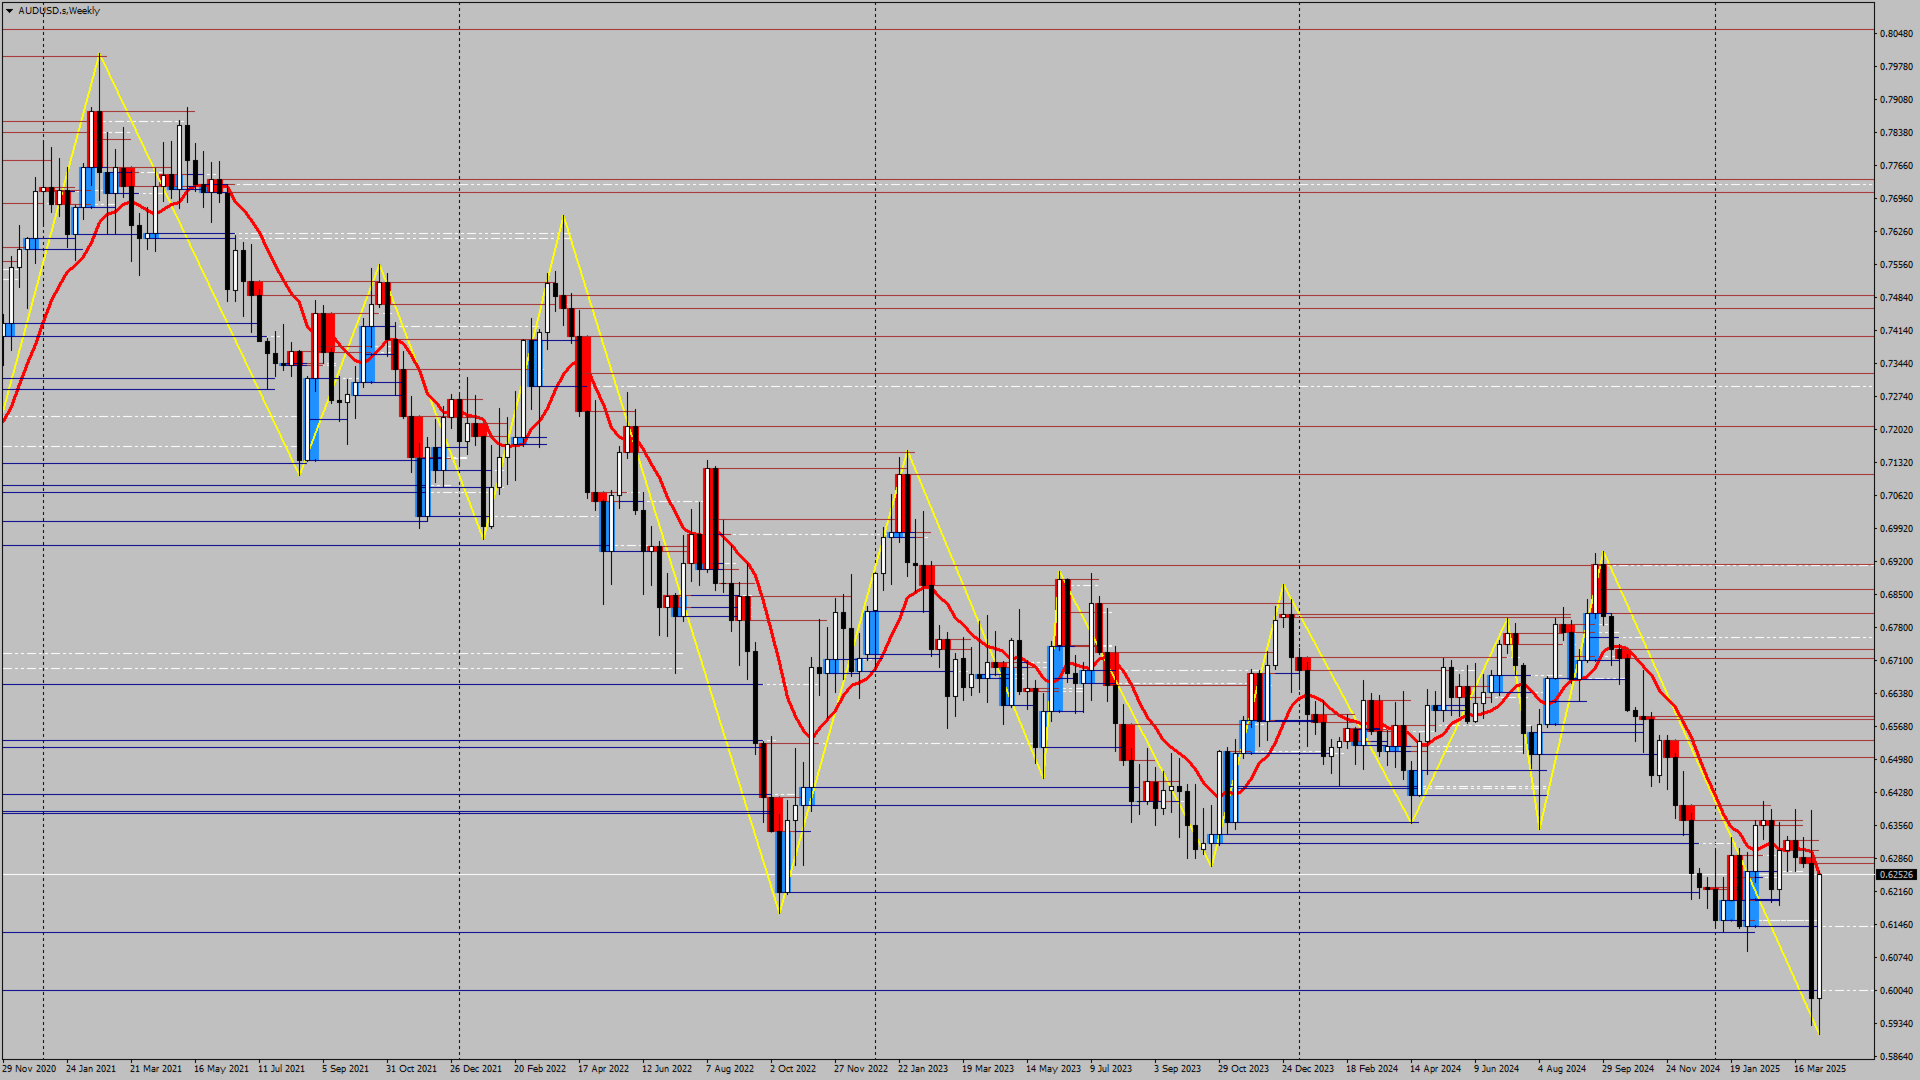
主要特点
系统是自动搜索K线中的供求区域的,系统同时会画出实时的关键价格线,交易者可以根据价格交易线进行交易。所以使用供求区策略的交易员无需再耗费时间去寻找标识供求区域,而可以关注在价格对供求区域以及关键价格的反应,制定适合自己的交易策略。
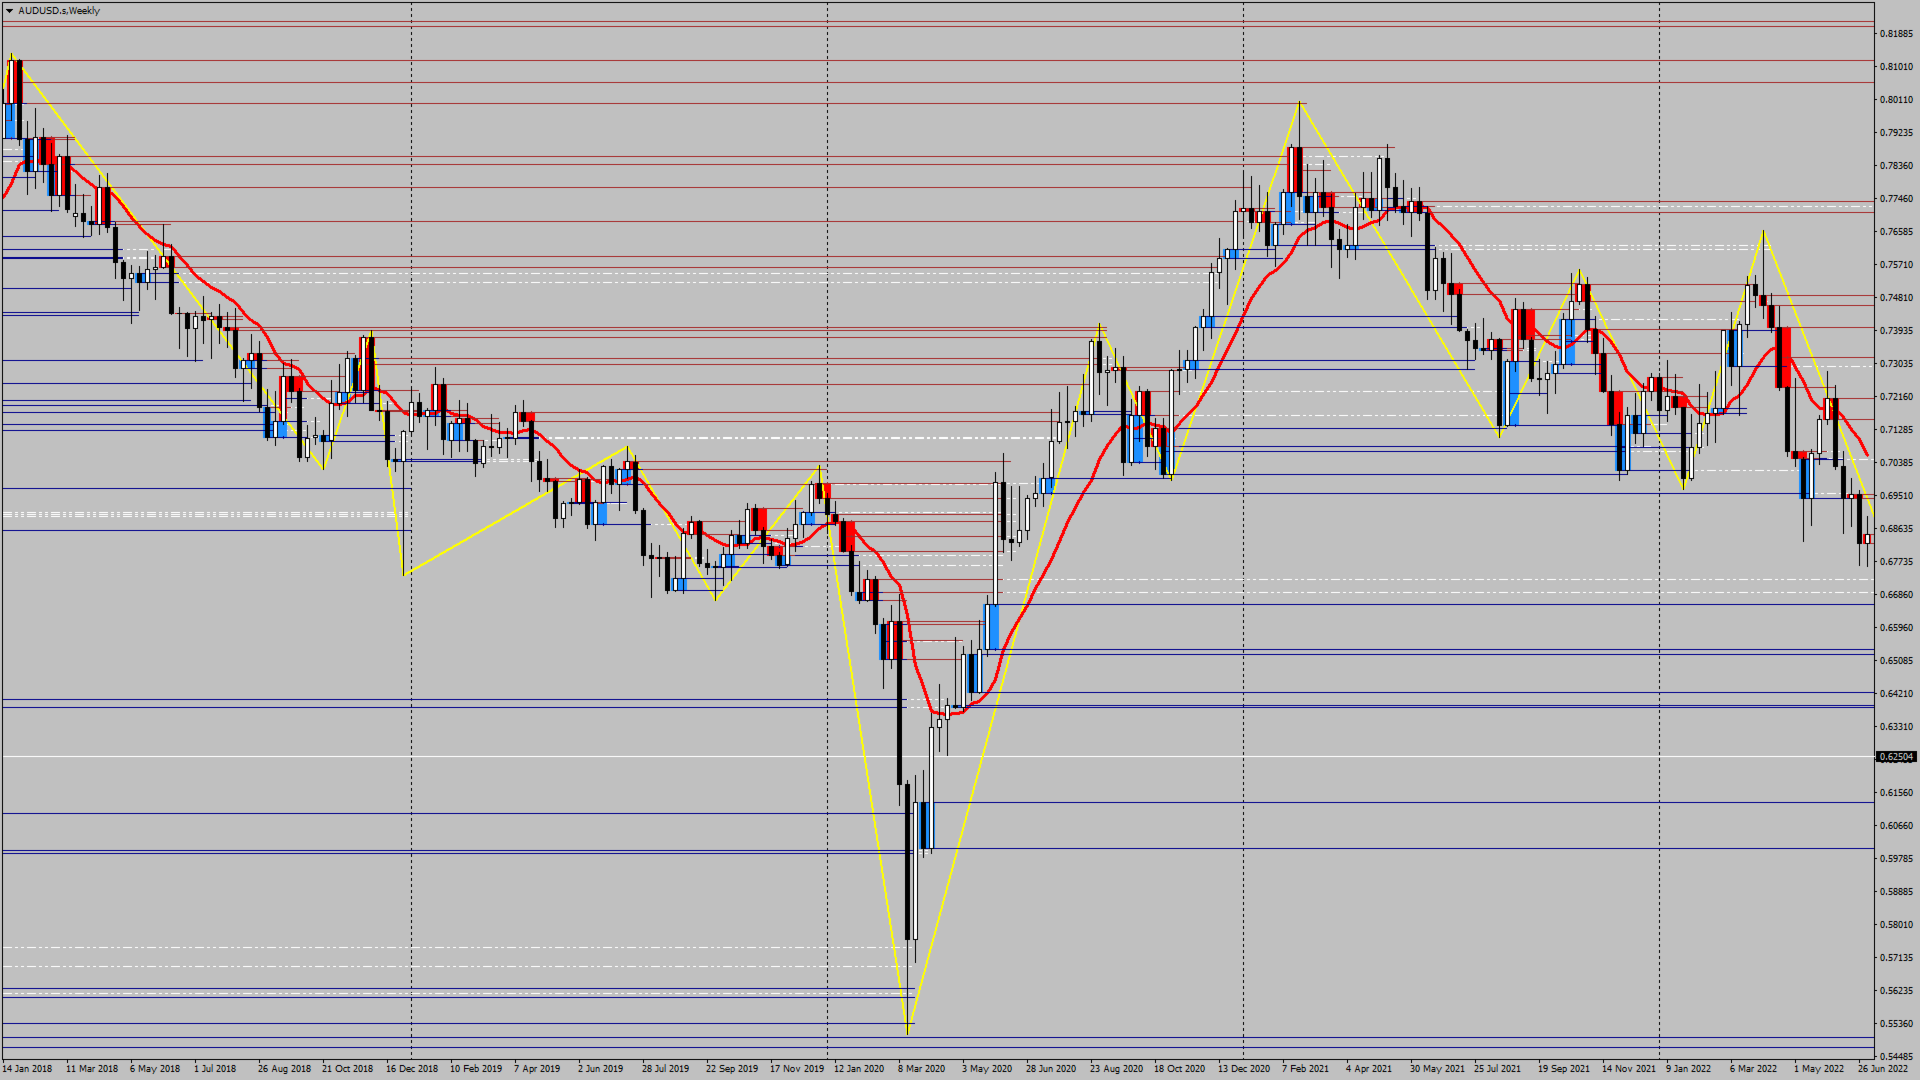
然而供求区策略本身就是一个在震荡时期更加有效的策略,所以当市场呈现强大趋势的时候,应当小心使用,或者按顺应趋势的方向使用指标提供的建议。
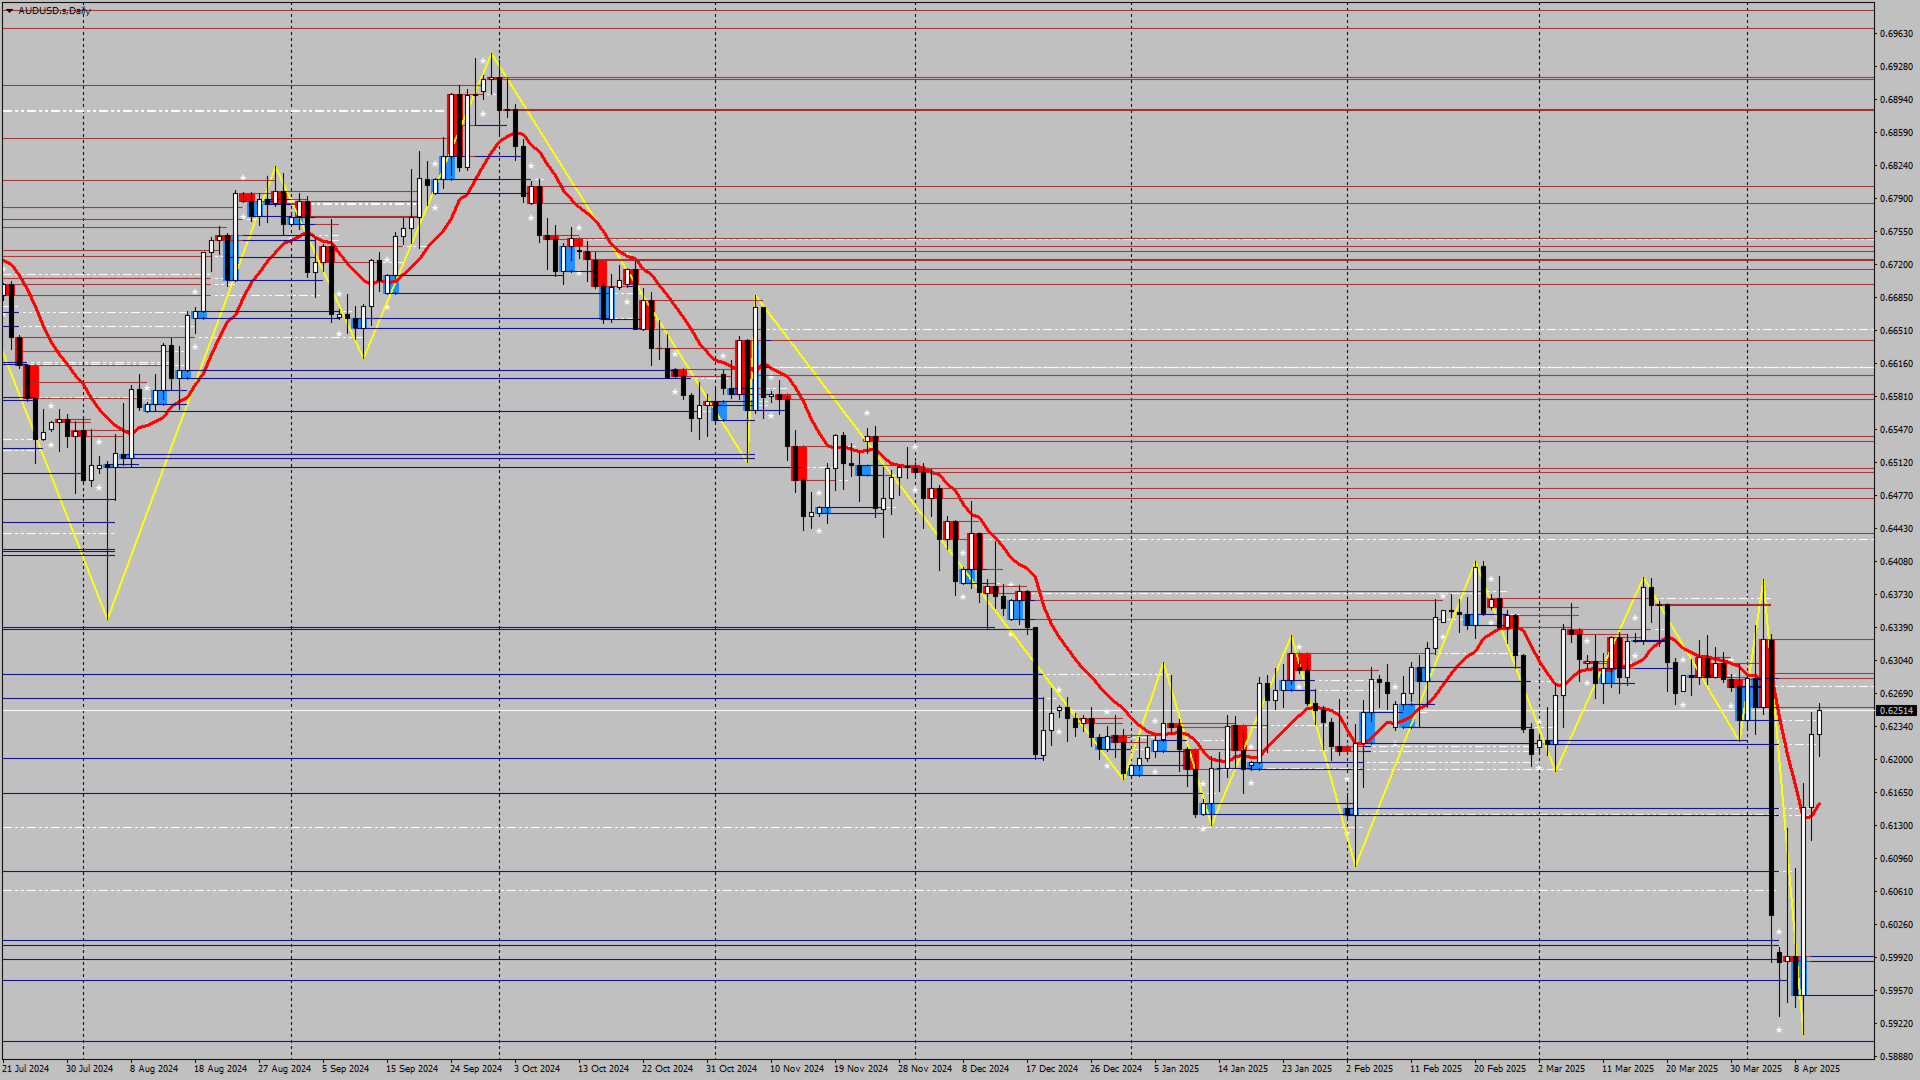
范围
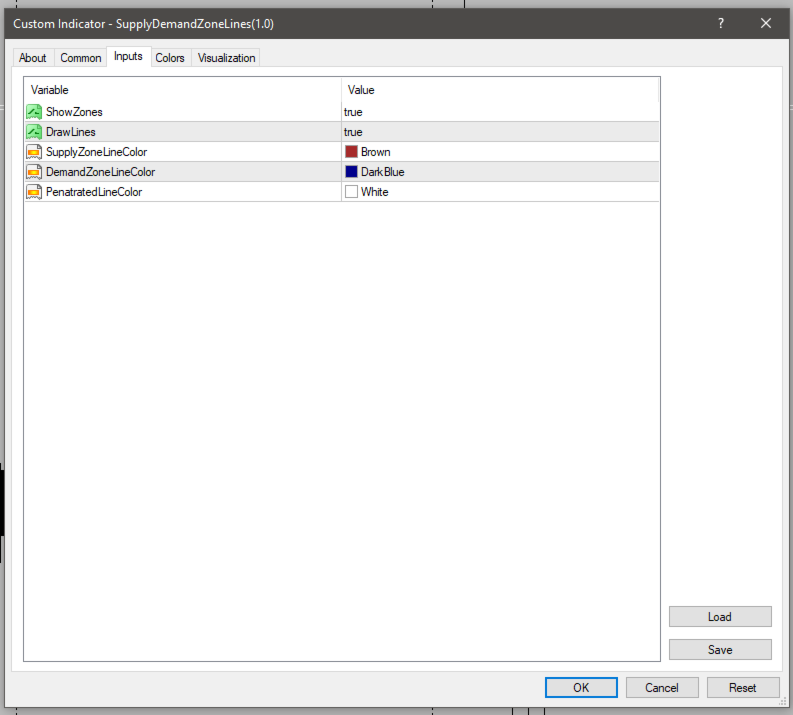
ShowZones:是否显示供求区域
DrawLines:是否显示关键价格
SupplyZoneLineColor:供给区价格线颜色
DemandZoneLineColor: 需求区价格线颜色
PenatratedLineColor:被击穿价格线颜色
执行
只需将指标附加到图表上即可。
请给我您宝贵的意见,让我改进指标。
如有问题,联系微信imlizard