Yellow Indicator Quant Atlas

Yellow Indicator by Quant Atlas

Creator: https://www.quant-atlas.com/

Yellow Indicator is a clean reversal focused trading tool designed to highlight potential turning points using momentum behavior and RSI structure.

The indicator looks for moments where momentum has moved through an important zone and begins to show signs of exhaustion. When conditions align, it plots dark yellow triangle signals directly on the chart.

Both bullish and bearish signals use the same dark yellow visual identity, giving the indicator a clear and recognizable appearance.

Signal Display

• Dark yellow upward triangle: potential bullish reversal area
• Dark yellow downward triangle: potential bearish reversal area

Yellow Indicator is designed for traders who want a simple visual tool to help identify possible momentum shifts without cluttering the chart.

Key Features

• Clean dark yellow signal markers
• Bullish and bearish reversal detection
• RSI based momentum framework
• Minimal chart design
• Works directly on the main price chart
• Suitable for multiple markets and timeframes
• Useful as a confirmation tool within a broader trading process

How to Use

  • A dark yellow upward triangle suggests that downside momentum may be weakening and that a potential bullish reversal area may be forming.
  • A dark yellow downward triangle suggests that upside momentum may be weakening and that a potential bearish reversal area may be forming.

Yellow Indicator can be combined with support and resistance, trend context, volatility analysis, price action, or other confirmation tools.

Important

Yellow Indicator is a decision support tool. It does not guarantee future market direction and should not be used as a standalone trading system. Traders should test it on their preferred symbols and timeframes before using it in live trading conditions.


推荐产品
AZ session scalper
Yurii Shvechikov
AZ session scalper A small but useful session indicator, designed primarily for scalping. Enable the session you plan to trade, watch the reaction of the M5/M15 candlesticks to the level of the previous trading session, and enter. We always look at the reaction of the current session to the previous one. For example, if you trade the Americas, enable the European session, and watch how one session takes away liquidity from another. Important: adjust the time to your broker's time zone in the i
FREE
Trading Sessions by Mahefa R is an indicator for MetaTrader 5 that visually identifies the four main trading sessions: New York, London, Tokyo, and Sydney . Designed to provide a clean, intuitive, and professional market view, it highlights the most active periods of the Forex market using smart visualization of session ranges , session-specific candle colors , and daily separators . Main Features: Automatic detection of the 4 major sessions New York London Tokyo Sydney Each session is fully c
FREE
Spread Hunter MT5
Dmitrii Kovalevskii
Spread Hunter MT5 – 当前和历史点差指标 用途 该指标在图表右上角以紧凑面板形式显示当前点差值(以点为单位)。将光标悬停在任何K线上时,会显示该K线的历史点差。 该工具对于策略对点差大小敏感的交易者来说不可或缺:剥头皮交易、新闻交易、高波动性工具交易。 主要功能 当前点差 持续显示在右上角。实时更新(每秒一次)。 历史点差 鼠标悬停在任何K线上时,会出现一个包含以下信息的弹出提示: K线时间 点差值(以点为单位) 提示显示的是该K线周期内的最小点差(经纪商历史数据存储的特性) 颜色指示 绿色 – 点差在正常范围内(≤ 设定阈值) 红色 – 点差过高(> 阈值) 阈值可由用户配置(默认为20点)。 解读 低点差(绿色)   – 有利的入场条件,尤其适用于剥头皮和日内交易。 高点差(红色)   – 建议暂缓交易或使用更宽的止损。 历史点差   – 帮助评估过去在你分析的点位上是否存在舒适的入场条件。 实现特点 适用于任何时间框架和交易品种。 实时显示当前点差。 悬停显示历史点差。 可配置背景,提高可读性。 不使用外部DLL库。 对终端性能影响极小。 配置参数 参数 描
FREE
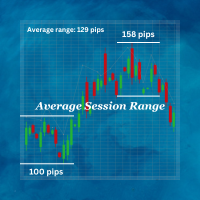
Average Session Range: Calculate and Average the Sessions High-Low Range of Specific Time Sessions Over Multiple Days. The Session Average Range is a sophisticated and precise tool designed to calculate the volatility of specific time sessions within the trading day. By meticulously analyzing the range between the high and low prices of a defined trading session over multiple days, this tool provides traders with a clear and actionable average range. **Note:** When the trading platform is closed
FREE
Multi Currency Strength Dashboard Mini (FREE) – Currency Strength Meter for MetaTrader 5 Multi Currency Strength Dashboard Mini 是一款适用于 MetaTrader 5 的免费指标,以清晰快读的仪表板形式实时显示 8 大主要货币 (USD、EUR、GBP、JPY、CHF、CAD、AUD、NZD)的相对强弱。 目标:在几秒内识别强势和弱势货币,帮助您构建有针对性的关注列表(例如,选择强势货币对弱势货币的交易对)。 2.00 版本新功能 全新视觉刷新 – TradingTips UI(深蓝面板、霓虹边框、蓝色标题栏)。 分区方框内的彩色强度条(绿 / 金 / 红)。 8 个货币每行显示趋势箭头(上 / 下 / 中性)。 面板拖放 – 抓取标题栏即可在图表上移动。 最小化按钮 – 紧凑模式不占用图表空间。 面板位置在 MT5 重启后自动保存。 主要功能 在单个面板中分析 8 大主要货币。 自动实时更新。 适用于所有时间周期(在所选时间周期上计算)。 兼容大多数经纪商(
FREE
Matrix Arrow Indicator Multi Timeframe Panel MT5 是一个免费的附加组件,是您的 Matrix Arrow Indicator MT5 的重要资产。它显示了当前 Matrix Arrow Indicator MT5 信号,用于 5 个用户自定义的时间范围和总共 16 个可修改的符号/工具。用户可以选择启用/禁用 Matrix Arrow Indicator MT5 包含的 10 个标准指标中的任何一个。所有 10 个标准指标属性也是可调整的,如 Matrix Arrow Indicator MT5 。 Matrix Arrow Indicator Multi Timeframe Panel MT5 还提供了更改它所附加的当前图表的选项,方法是单击 16 个可修改符号按钮中的任何一个。这将使您能够更快地在不同符号之间工作,并且不会再次错过交易机会。 如果您想使用这个免费的 Matrix Arrow Indicator Multi Timeframe Panel MT5 插件,您需要在此处单独购买 Matrix Arrow Indicato
FREE
DC Indicator
Lamont Simone Reynecke
The donchian channel indicator might just be the best fit for you Trading in derivative products such as futures, options, CFD's, forex and certificates contains significant risk. These products are not suitable for every investor. Investors could potentially lose all or more than the original investment. If anything, only money equal to personal risk capital should be used and can be lost without jeopardizing financial security or lifestyle. Partially or fully automated trading programs can
FREE
Moving Average Force
Lorenzo Marchesin
5 (2)
Scalp using the behavior of a short moving average, the indicator gives the slope and identifies the "hyper" moments. Operational advice: Use   M1   chart. Period 20 : open buy after two rising lows; sell after two max downhill; avoid countertrend openings; when the line goes flat put a stop at the opening price. Avoid actions in low volatility timeslots. When the curve that draws the min / max is very flat, it is better to postpone at least 15'. Period 50 : matches the trend, when it is at
FREE
TradeVision Pro
Ian Nganga Comba
TradeVisonPro Forex Analyzer Pro MT5 交易账户分析与监控仪表板 TradeVisonPro Forex Analyzer Pro 是一款专为 MetaTrader 5 用户设计的交易分析和账户监控解决方案。 本产品将 MT5 交易数据整理到结构化的网页仪表板中,使交易者能够查看账户信息、监控未平仓头寸、分析交易历史、跟踪策略、记录交易日志以及查看绩效统计数据。 TradeVisonPro Forex Analyzer Pro 旨在帮助交易者整理交易信息,并通过受支持的桌面和移动网页浏览器访问这些数据。 主要功能 • MT5 账户仪表板 • 未平仓头寸监控 • 交易历史分析 • 交易日历 • 策略跟踪 • 交易日志 • 账户绩效统计 • 绩效报告 • 交易通知 • 多账户支持 • 可分享的只读报告 MT5 账户仪表板 在一个结构化的仪表板中查看 MetaTrader 5 交易账户的重要信息。 可显示的信息包括: • 账户余额 • 净值 • 可用保证金 • 保证金水平 • 未平仓头寸 • 浮动盈亏 • 交易量 • 经纪商信息 • 账户信息 仪表板集中显示
FREE
Hello, This is an easy symbol change panel. The free version only can change major pairs which are "AUDUSD, EURUSD, GBPUSD, USDCHF, USDCAD, USDJPY, NZDUSD" The full version can add your symbols. FULL version here: https://www.mql5.com/en/market/product/71173?source=Site+Market+MT5+Indicator+New+Rating005#description Also, can change the TimeFrame as well. Symbols must be active on your Market Watch list. Parameters: ratio - change the size LineNumber - you can set that how many symbo
FREE
MTF WPR  Screener MT5 A compact multi-timeframe dashboard that converts Williams’ %R (WPR) into a clear, actionable signal: NOW: BUY/SELL with confidence % , plus the Best Entry TF suggestion and a simple volatility label . What you get NOW decision (every second): BUY / SELL + confidence % Best Entry TF: highlights the most suitable timeframe for entry in the current direction MTF table (optional): WPR values across timeframes in one panel (toggle “Details”) Two trade display modes: STRICT: sho
FREE
Multi-Timeframe Market Activity and Risk Dashboard TAGLINE Know when the market is calm, active, or dangerously volatile. PRODUCT OVERVIEW VolatilityGuard Navigator MT5 is a professional multi-timeframe market-activity dashboard for MetaTrader 5. It measures current volatility relative to the instrument's own recent baseline and classifies conditions as: - VERY LOW - LOW - NORMAL - HIGH - EXTREME The indicator is not designed to predict whether price will rise or fall. Its purpose is to s
FREE
Multi Stochastic Dashboard 基于随机指标的多货币扫描器。同时监控多达12个品种的所有时间周期 — 所有信息都在图表上的一个面板中显示。 适用对象 适合使用随机指标、厌倦了在数十个图表之间切换寻找入场点的交易者。面板一目了然地展示完整的市场全貌。 工作原理 图表上出现一个表格:纵轴为品种,横轴为时间周期。每个单元格显示当前随机指标值并按区域着色: •      绿色 — 振荡器处于超卖区域。颜色越亮,越深入区域。 •      红色 — 振荡器处于超买区域。颜色强度反映信号强度。 •      灰色 — 中性区域,等待中。 当同一品种的多个时间周期显示相同方向时 — 这就是值得分析的时机。 面板功能 面板通过Canvas绘制 — 无闪烁无延迟。三种配色方案:Dark、Medium、Light。字体大小可调。面板可拖动到屏幕任意位置。 点击品种名称 — 立即将当前图表切换至该品种。 多个副本 可以在同一图表上运行任意数量的副本,例如不同的随机指标设置并排显示。只需为每个副本设置唯一的Instance ID:第一个设为1,第二个设为2,以此类推。每个面板的位置单独保
FREE
Blahtech Moving Average MT5
Blahtech Limited
5 (3)
Blahtech Moving Average indicator is a multitimeframe version of the standard Moving Average indicator. It is also enhanced with customisable alerts, period breaks and other configuration options. The 50 day and 200 day moving averages are widely followed by investors and traders, with breaks above and below the MA lines considered to be signals of interest. Links [  Install  |  Update  |   Training   |   All Products  ] Feature Highlights Up to three timeframes Configurable calculation variabl
FREE
Moving Spread
Jose Maria Molina Sanchez
Moving Spread – 实时市场成本监控器 实时监控平均点差,避免在高成本时段交易。 该指标的作用是什么? Moving Spread 实时测量市场的 平均点差(以点数计) ,并显示其随时间的变化情况。对于希望了解何时入场成本过高(甚至在交易开始前就可能侵蚀利润)的交易者来说,这是一个必不可少的工具。 为什么这很重要? 高点差意味着您进出市场需要支付更多费用。该指标可帮助您识别这些时刻,并避免在成本过高的情况下进行交易。 工作原理 在单独窗口中 显示当前点差 ,红线代表平均值。 当点差超过预设阈值(例如 > 0)时,会 自动发出警报 。 非常适合剥头皮和日内交易者 ,因为它有助于避免因“滑点”(持续亏损)造成的隐藏损失。 真实案例 如附图所示,不同资产和时间周期下的点差行为各不相同: 黄金 (XAUUSD) 1分钟 非常稳定,只有两个主要数值。非常适合剥头皮。 白银 (XAGUSD) 1分钟 变化较多,但有清晰的模式。需要密切关注。 铂金 (XPTUSD) 1分钟 完全不稳定。不建议进行快速操作。 ️ 注意: 该模式会随时间周期而变化。例如,日线级别
FREE
CrosssX Indicator Strategy
M Abdullahfaiz Rahman
A buy signal can be seen on the dashboard when the previous signal is red and the next signal is green, then the SAR is green and the RSI is green. A Sell Signal can be seen on the dashboard when the previous Signal is green and the Signal after it is red, then the SAR is red and the RSI is red. Line function - shows on the chart the lines of Opening, Stop Loss, Take Profit. With this function, it is easy to create a new order and see its additional characteristics before opening.   TP and SL
FREE
Market Hours Pro
Musa Terrance Khosa
Market Hours Pro shows Tokyo, London, and New York trading sessions directly on your MT5 chart, including scheduled overlap periods. It’s designed to give you a clear view of global market timing so you can plan trades, spot high-activity periods, and align strategies with standard Forex hours. How It Works Displays scheduled session times visually on your chart. Highlights session overlaps for London/New York and Tokyo/London. Automatically adjusts times for your timezone or broker time. Shows
FREE
Overview of the Market Sessions Indicator The Market Sessions Indicator is a tool designed to help traders visualize the active trading hours of major global financial markets—specifically the Tokyo, London, and New York sessions. By clearly marking these time zones on the chart, the indicator allows users to identify the partitioning of major trading sessions. There are 3 regular trading sessions: - Tokyo Session - London Session - New York Session The indicator works from the H1 timeframe and
FREE
MultiTF Candle Delta Monitor — Multi-Timeframe Difference Panel (Visualizing candle changes as numeric values) Overview: Monitor candle differences across multiple timeframes in a compact numeric panel. Each row represents a timeframe, and each cell shows the recent close-to-close difference (pips/ticks). Blue = upward, Red = downward, Gray = no change. Since it uses label rendering only, it is lightweight and does not interfere with the chart. Key Features: - Multi-timeframe support (M1, M5,
FREE
Multi-Timeframe Reversal Confirmation Dashboard TAGLINE Detect when a reversal is forming—and when confirmation is becoming stronger. PRODUCT OVERVIEW ReversalRadar Navigator MT5 is a multi-factor reversal analysis dashboard for MetaTrader 5. It searches for a combination of technical conditions that may accompany bullish or bearish market reversals. Instead of declaring a reversal because one oscillator reaches an extreme, ReversalRadar Navigator MT5 uses a weighted confirmation model bas
FREE
Show Pips for MT5
Roman Podpora
4.48 (31)
对于那些总是想了解帐户当前情况的人来说,此信息指示器将很有用。 VERSION MT 4 -   More useful indicators 该指标显示诸如利润点数、百分比和货币等数据,以及当前货币对的点差以及柱在当前时间范围内收盘的时间。 有多种选项可用于将信息线放置在图表上: 价格右侧(运行在价格后面); 作为评论(在图表的左上角); 在屏幕的选定角落。 还可以选择信息分隔符: | / \ # 该指标易于使用且信息丰富。可以在设置中禁用不必要的信息项目。 设置 外观类型     - 信息行的显示类型。有以下三种选择: 跟随价格     - 遵循价格; 作为评论     - 作为评论; 在屏幕的选定角落     - 在屏幕的选定角落。 附件图角     - 如果您选择屏幕选定角的显示类型,则此项目允许您选择四个捕捉角之一; 显示利润?       - 该参数负责以存款货币显示利润; 以百分比显示利润?       - 该参数负责以百分比形式显示利润; 显示传播?       - 该参数负责显示当前点差; 显示酒吧关闭时间?       - 该参数负责显示柱关闭之前的时间; 文字颜
FREE
AZ ATR indicator (with volume correlation bonus) Standard ATR indicator, you can enable ignoring abnormally large candles. It is possible to change the location of the displayed text in 4 corners of the chart. You can change the calculation period (days ago). Bonus - the indicator has a correlation with volumes. Can be enabled to display a possible priority at the current moment in the market. What do the values ​​mean: Positive correlation (0.3 - 1.0): 0.3-0.7 - moderate connection
FREE
Mae Pla Green Pen Analysis Framework The Mae Pla Green Pen Analysis Framework is a multi-timeframe price action scanner for XAUUSD (Gold Spot) . It monitors all 9 timeframes simultaneously — M1, M5, M15, M30, H1, H4, D1, W1, and MN — and displays pattern detection results on a real-time dashboard drawn directly on the chart. The indicator is based on the Mae Pla Green Pen trading methodology, which uses structured price action patterns to identify potential trade setups. Pattern Detection Three
FREE
USDJPY Keltner Range M15 Strategy is a fully automated MetaTrader 5 strategy designed to capture structured breakout opportunities on USDJPY using daily directional confirmation, Keltner Channel reference levels, volatility-buffered pending STOP entries and simple fixed-risk management. The strategy is designed for USDJPY on the M15 timeframe. Its goal is to participate when the market shows directional intent through daily high or daily low behavior, while using Keltner Channel structure and
FREE
Strike Zone EA MT5
Matteo Schizzerotto
Strike Zone 是一款基于 OHLC 烛台图表模式的 EA 交易,所有回测均基于 10 年的 EA 活动。 回测使用固定参数:1 对、10,000 美元资本和 0.1 手入市量。 经过几天的测试,该 EA 交易在以下货币对和时间范围内被证明是有利可图的: 澳元CAD H4 NAS100 新西兰元 H1 美元兑加元 H1 回测并不能保证未来的利润,任何使用此工具的行为均由使用者承担全部责任。在将以下 EA 放入真实账户之前,必须在模拟账户上进行测试。 ooooooooooooooooooooooooooooooooooooooooooooooooooooooooooooooooooooooooooooooooooooooooooooooooooooooooooooooooooooooooooooooooooooooooo
FREE
Merkat DD
Tan Au Phuong
Merkat DD — MT5 上浮动回撤的您的看门狗 同时运行多个 EA、多种设置,却不太确定哪个真正安全?MerkatDD 正是填补这一空白的工具。 MerkatDD 为您做什么 就像一只站岗的猫鼬,总是用后腿站起来注视着地平线,MerkatDD 持续监控您账户**最严重的浮动回撤**——实时跟踪,按每个 EA、每种设置,完全自动。无需手动设置。 不用再猜测或只盯着利润曲线看,您将准确知道: 哪个设置真正表现稳健,哪个正在悄悄消耗风险。 它曾经达到的最差回撤,即使当时您没有盯着屏幕。 这些是真实、硬核的数据,帮助您合理控制风险,并选择真正值得长期信赖的设置——而不仅仅是回测中看起来不错的那些。 永不消失的数据 您的整个回撤历史记录都保存在本地计算机上。因此,无论您: 重启电脑, 关闭并重新打开 MT5, 还是暂时断开连接, MerkatDD 都会从中断处继续——完整历史记录完好无损,什么都不会丢失。可以连续跟踪数周或数月,而无需每次从零开始。 快速设置指南 将 MerkatDD 附加到图表时,您会看到三个输入字段。以下是它们的作用: **“Symbol allow-list” 和
FREE
Session Volatility Map
Strifor (Mauritius) Ltd
5 (5)
Session Volatility Map — 是一个在图表上显示主要交易时段(亚洲、欧洲、美国)的指标。 自动显示交易时段边界及其交汇区,这些区域通常波动性较高。 绘制每个时段的 High–Low 范围,帮助确定支撑和阻力位。 高亮显示当前活跃交易时段。 自动考虑夏令时/冬令时切换(欧洲/美国)。 适用人群 短线交易者 — 寻找高波动时段。 日内交易者 — 筛选“安静”和活跃时段。 新闻交易者 — 了解事件发生时对应的交易时段阶段。 使用 Session Volatility Map,你总能知道:市场是在区间内,还是准备启动冲击性行情。 设置 Time model (Platform/MT4/MT5) — 时间模式选择 Auto DST adjustment (market aware) — 自动夏令时调整 How many days to back (0 = today) — 显示天数 Color A — low volatility — 低波动颜色 Color B — high volatility — 高波动颜色 Font size
FREE
Aegis Meridian
Joshua Dunnink
上市优惠 — 前 名用户免费 (以换取真实评价与反馈)。之后价格随售出份数分阶段上调: $49 → $69 → $99 → $129 ,直至上市价 $149 。早期用户锁定最低价。始终提供 $30/月 租用及免费演示(策略测试器)。 Aegis Meridian 是一款用于 MetaTrader 5 的全自动 AUDCAD 自适应均值回归网格 EA,配备单一风险旋钮以及可选的高信心 TURBO 档位。以下所有数据均为策略测试器(回测)在真实 tick 上的结果,并非真实交易结果。过往表现不代表未来收益。 概述 Aegis Meridian 在 M15 周期交易 AUDCAD。它对统计上过度伸展的价格进行反向布局(基于线性回归通道的 z 值),用等手数的小型篮子对逆向走势进行均摊,并在价格回归均值时平掉整个篮子。内置的实时市场状态识别器会针对震荡、高波动和趋势三种状态重新调整选择性、网格间距和获利目标——在趋势中减少交易并加大间距,正是网格本会受损之时。 运行原理 入场:仅在伦敦/纽约时段对严重过度伸展的价格反向入场——高选择性是核心优势。 恢复:等手数篮子(非马丁——每一层手数相
Apex SYNC
Alex Amuyunzu Raymond
APEXSYNC TRADE COPIER PRO - THE INSTITUTIONAL-GRADE COPYING REVOLUTION ULTRA-LOW LATENCY | SMART RISK INTELLIGENCE | PROP-FIRM SAFE Tired of slow, basic copiers that risk your capital? Meet ApexSync Pro - the next-generation trade copier engineered to DOMINATE the MT4/MT5 ecosystem with institutional-grade performance, AI-driven risk management, and prop-firm certified safety protocols. WHY APEXSYNC PRO BEATS EVERYTHING ELSE Feature Old Copiers APEXSYNC PRO Speed 500ms+ (slow) <200ms   (blazing
FREE
A simple indicator showing the size of the spread at the current time, the maximum for the day and the maximum for the entire duration of the indicator. Daily statistics of the maximum spread are also displayed, indicating the time when this spread was fixed. The location of the display of the received information can be changed depending on your preferences and positioned anywhere on the screen. It is possible to output alerts about exceeding the size of the spread specified in the input pa
FREE
该产品的买家也购买
本产品已针对 2026 年市场进行更新,并针对最新 MT5 版本进行了优化。 价格更新通知: Smart Trend Trading System 目前价格为 $99 。 接下来的 30 次购买 后,价格将上涨至 $199 。 特别优惠: 购买 Smart Trend Trading System 后,请发送私信给我,即可免费领取 Smart Universal EA ,并将您的 Smart Trend 信号转换为自动交易。 Smart Trend Trading System 是一套完整的交易系统,具备不重绘、不回绘、不延迟的特点,专为希望获得更清晰信号、更准确趋势方向以及更有组织交易方式的交易者打造。 Online course , manual and [download presets] . 它将 10 多种交易工具 整合到一个系统中,包括趋势检测、反转区域、Smart Cloud、移动止损逻辑、支撑与阻力、K线着色、提醒以及多周期分析。 该系统旨在帮助您应对不同的市场环境: 趋势市场: 识别主要趋势,发现回调,跟随动能,并通过止损指导和移动止损选项寻找更清晰的入场机会。
Trend Sniper X
Sarvarbek Abduvoxobov
5 (6)
Trend Sniper X 是一款适用于 MetaTrader 5 的多时间周期趋势跟踪指标,帮助交易者以清晰、精确的方式识别趋势方向和潜在的反转点。 价格信息: 当前价格为促销价,随着未来更新和新功能的发布,价格可能会有所变动。 Code2Profit 频道 通过多时间框架分析掌握市场! 技术规格 平台 MetaTrader 5 指标类型 多时间周期趋势指标 运行时间周期 任何图表时间周期,可独立选择更高的时间周期 (M1–MN1) 主要交易品种 外汇、黄金 (XAUUSD) 及其他差价合约 (CFD) 推荐账户 任何账户类型 可视化 彩色趋势蜡烛 (买入/卖出/微弱/变化) + 买入/卖出箭头 附加模块 交易时段方框 (悉尼、东京、伦敦、纽约) 主要功能 多时间周期趋势分析: 直接在当前图表上投射更高时间周期的趋势方向,提供清晰的宏观视角。 弱势/不确定柱检测: 高亮显示趋势条件不明朗的柱线,让交易者避开震荡区域。 买入/卖出信号箭头: 在确认趋势变化后的柱线上自动绘制箭头,支持警报、推送和电子邮件通知。 一键开启/关闭面板: 图表上的按钮可切换指标,下拉菜单可立即切换分析时间周
SuperScalp Pro
Van Minh Nguyen
4.69 (29)
SuperScalp Pro – 专业多层共振剥头皮交易系统 SuperScalp Pro 是一款专业的多重共振剥头皮交易系统,旨在帮助交易者识别更高概率的交易机会,提供更清晰的入场确认、基于 ATR 的止损(Stop Loss)和止盈(Take Profit)水平,以及适用于 XAUUSD、BTCUSD 和主要外汇货币对的灵活信号过滤功能。 完整使用文档可在产品博客查看: [User Guide] 支持通过 SuperScalp Pro Auto Trader EA 进行自动交易: [Auto Trader] 基于 SuperScalp Pro 交易逻辑开发的黄金自动剥头皮 EA: [SuperScalp Gold] SuperScalp Pro 集成了 Supertrend、VWAP、EMA、RSI、ADX、成交量分析、布林带(Bollinger Bands)以及 MACD 背离分析,用于过滤低质量交易机会,减少虚假突破信号,并提高入场精准度。 SuperScalp Pro 专为 XAUUSD、BTCUSD 以及主要外汇货币对优化设计,通过基于 ATR 的波动率逻辑和规则化信
Welcome to ENTRY IN THE ZONE AND SMC MULTI TIMEFRAME Entry In The Zone and SMC Multi Timeframe is a professional trading indicator built on Smart Money Concepts (SMC) , combining market structure analysis with a No Repaint BUY / SELL signal system in a single indicator. It helps traders understand market structure more clearly, identify key price zones, and focus on higher-quality trading opportunities. By combining Multi-Timeframe Analysis , Points of Interest (POIs) , and real-time signals, th
SMC Intraday Formula
Kareem Abbas
5 (20)
让我们先坦诚一点。 没有任何一个指标可以单独让你实现盈利。如果有人告诉你可以,那他是在向你兜售一个梦想。任何显示完美买卖箭头的指标都可以被做得看起来毫无瑕疵——只需要放大历史中的某一段并截取成功交易的截图。我们不会这样做。 SMC Intraday Formula 是一个工具。 它为你读取市场结构,标记出概率最高的价格区域,并用简单直白的语言准确告诉你当前智能资金的行为轨迹。你仍然需要做决定。你仍然需要执行交易。但现在,你是带着精确性执行,而不是靠希望。 我们已经在黄金(XAUUSD)以及主要外汇货币对的日内剥头皮交易中使用该指标将近三年。这是我们在 M1、M5、M15 和 M30 上的日常主力工具。它之所以有效,是因为它不试图预测未来——它展示的是当前正在形成的高概率交易机会,并解释 为什么 。 它与其他所有指标有什么不同? 大多数交易指标只做一件事。移动平均线交叉。振荡指标触及某个水平。出现一个箭头。你进场交易。你亏损。你责怪指标。重复。 SMC Intraday Formula 将多个机构级概念整合为一个统一的市场解读: - 斐波那契共振引擎 不只是普通的斐波那契水平——该指标
Neuro Poseidon MT5
Daria Rezueva
4.8 (54)
Neuro Poseidon is a new indicator by Daria Rezueva. It combines precise trading signals with adaptive TP/SL levels - creating best possible trades as a result! Message me and get  Neuro Poseidon Assistant  as a gift to automize your trading process! What makes it stand out? 1. Proven profitability on all assets and timeframes 2. Only confirmed BUY and SELL signals present on the chart 3. Adaptive TP & SL levels generated by the software for each trade 4. Easy to understand - suitable for al
M1 Quantum MT5
Hamed Dehgani
4.56 (9)
使用 M1 Quantum 的实盘交易信号 : 信号 (交易由 Quantum Trade Assistant 自动 执行,并作为本产品 免费 提供。) 价格计划: 当前价格: $169 (早期用户优惠) 下一阶段计划价格: $189 计划零售价: $299 开发者提示: 购买后请联系我,以获取 最新推荐的参数设置文件(Set File) 、交易建议,以及加入 VIP 支持群组 ,与其他 M1 Quantum 用户交流经验。 常见问题 - 设置文件 - 安装指南 M1 Quantum 是一款专业的 M1 交易系统,提供快速且精准的交易信号,并内置止损(Stop Loss)、止盈(Take Profit)以及智能资金管理功能。 M1 Quantum 包含专业的资金管理系统,通过专注于 连续盈利交易 ,帮助交易者更快地增长账户资金。 M1 Quantum 指标 的主要特点 专为 M1 时间周期 和所有 主要货币对 设计 所有交易均配备止损和止盈 内置 资金管理功能 ,并指导交易者轻松执行交易计划 高胜率,高比例的 连续盈利交易 无重绘,无延迟 适合各种类型的交易者,简单易懂 要使用 M
Gold Entry Sniper
Tahir Mehmood
5 (16)
Gold Entry Sniper – 专业多周期ATR黄金交易仪表盘,适合黄金剥头皮与波段交易 Gold Entry Sniper 是一款先进的 MetaTrader 5 指标,旨在为 XAUUSD 及其他品种提供精准的 买/卖信号 。基于 ATR 移动止损逻辑 和 多周期分析仪表盘 ,适合剥头皮交易者与波段交易者,帮助识别 高概率黄金入场点 。 主要功能与优势 多周期信号分析 – 同时显示 M1、M5、M15 趋势方向。 基于ATR的动态止损 – 根据波动性自动调整。 专业图表仪表盘 – 展示信号状态、ATR水平、线性回归中线和交易方向。 清晰买卖标记 – 自动箭头与文字标签提示。 离场提示与交易管理 – 自动检测离场信号锁定利润。 全面自定义 – 调整仪表盘位置、颜色、字体及参数。 专为黄金优化 – 适用于 M1至M15 黄金剥头皮 ,也适合外汇、指数与加密货币。 为什么选择 Gold Entry Sniper? 为追求 快速、精准、可视化交易决策 的交易者打造,ATR 与多周期确认结合,帮助你抓住 最佳黄金入场点
Gann Made Easy MT5
Oleg Rodin
5 (8)
Gann Made Easy   是一个专业且易于使用的外汇交易系统,它基于使用先生理论的最佳交易原则。 W.D.江恩。该指标提供准确的买入和卖出信号,包括止损和获利水平。您甚至可以使用推送通知在旅途中进行交易。 购买后请联系我,即可免费获得交易指导和超棒的额外指标! 您可能已经多次听说过江恩交易方法。通常 Gann 的理论不仅对于新手交易者而且对于那些已经有一定交易经验的人来说都是非常复杂的东西。这是因为江恩的交易方法在理论上并不那么容易应用。我花了几年时间来完善这些知识,并将最好的原则应用到我的外汇指标中。 该指标非常易于应用。您所需要的只是将其附加到您的图表并遵循简单的交易建议。该指标不断进行市场分析工作并寻找交易机会。当它检测到一个好的入口点时,它会为您提供一个箭头信号。该指标还显示止损和获利水平。 换句话说,当您像先生一样进行交易时,该指标会为您提供最佳江恩建议。江恩亲自告诉你此时此刻该做什么。但最好的部分是您不需要了解任何有关江恩交易原则的知识,因为该指标会为您完成整个市场分析工作。
UZFX {SSS} 超短线智能信号 v4.0 MT5 是一款无重绘的高性能交易指标,专为在快速波动的市场中需要精准、实时信号的超短线交易者、日内交易者和波段交易者设计。该指标由 (UZFX-LABS) 开发,融合了价格行为分析、趋势确认和智能过滤技术,可在所有货币对和时间周期内生成高概率的买卖信号、预警信号以及趋势延续机会。 别再对交易犹豫不决了,开始遵循这一专为追求清晰、精准和纪律性市场执行的交易者设计的结构化信号系统吧。 我的建议* 最佳时间周期:15分钟及以上。 {H1} 是我的最爱。而且效果令人惊叹……!! 更新后的主要功能 • 自动买入和卖出信号检测 • 先进的反转识别逻辑 • 潜在市场反转前的早期预警信号 • 趋势延续确认信号 • 内置风险管理功能,包含入场点、止损点、TP1、TP2和TP3水平 • 完全可自定义的风险回报比 • 实时警报、声音提醒和移动端推送通知 • 带交易建议的专业信息面板 • 适用于所有MT5交易品种和时间周期 • 界面简洁、轻量且用户友好 为什么交易者选择 UZFX SSS? 大多数交易者亏损的原因在于入场过晚、平仓过早,或者缺乏明确的交
Divergence Bomber
Ihor Otkydach
4.9 (92)
购买该指标的每位用户将额外免费获得以下内容: 原创工具“Bomber Utility”,该工具会自动跟踪每一笔交易,设置止损和止盈点,并根据策略规则自动平仓; 适用于不同交易品种的指标设置文件(Set 文件); 三种不同风险模式下的 Bomber Utility 设置文件:“最低风险”、“平衡风险” 和 “观望策略”; 一套详细的 视频操作手册,帮助您快速完成安装、配置并开始使用本交易系统。 注意: 要获取以上所有赠品,请通过 MQL5 的私人消息系统联系卖家。 我为您介绍原创的自定义指标 “Divergence Bomber”(背离轰炸机),它是一套基于 MACD 背离交易策略 的“全功能”交易系统。 该技术指标的主要任务是识别 价格与 MACD 指标之间的背离,并发出交易信号(包括推送通知),指示未来价格可能的运动方向。平均而言,这些信号的准确率超过 98%。有关该指标如何工作的详细说明,请观看本页面上的视频演示。 该系统使用 止损订单 和 动态回撤平仓机制 来管理交易。 Divergence Bomber 指标的主要特点: 支持交易的品种: AUDCAD、AUDCHF、AUDSG
Entry Points Pro for MT5
Yury Orlov
4.5 (146)
传奇回归:Entry Points Pro 10。 这款传奇指标曾 3 年稳居 MQL5 Market 前三,如今全面重启。 数百条热情好评(两个版本合计 589 条),每天有数千名交易者用它交易,演示版下载 31,000+   MT4+MT5  次。 五年来我读过你们的每一条评价——在第 10 版里,我没有给出许诺,而是把答案直接做进了产品。指标作者自 1999 年入市, 珍视诚信、自己的声誉和自己的客户 。 Entry Points Pro 给出的入场信号严格不重绘。 而且这一次不再只是作者的一面之词,而是可验证的事实:确认信号只在 K 线收盘后标出,自动化测试记录到 零重绘 (在 EURUSD、XAUUSD 和 BTCUSD 上共 2,486,568 次不变量检查——0 次违规)。测试方法完全公开——您可以在策略测试器中自行复现。 购买后请务必第一时间给我发私信。 我会发给您 扩展版说明书《交易者圣经》 ——使用本指标交易的完整指南——并告诉您如何免费获得 赠品:市场扫描器 ,它能同时分析多个品种和多个时间周期,并在一个界面上显示 Entry Points Pro 此刻在哪里表现
Atomic Analyst MT5
Issam Kassas
4.36 (45)
本产品已针对 2026 年市场进行更新,并针对最新 MT5 版本进行了优化。 价格更新通知: Atomic Analyst 目前价格为 $99 。 接下来的 30 次购买 后,价格将上涨至 $199 。 特别优惠: 购买 Atomic Analyst 后,请发送私信给我,即可免费领取 Smart Universal EA ,并将您的 Atomic Analyst 信号转换为自动交易。 Atomic Analyst 是一款不重绘、不回绘、不延迟的 Price Action 交易指标,专为手动交易、清晰信号和 EA 自动化而设计。 User manual: settings, inputs and strategy.   &   User Manual PDF . 它分析价格行为、强度、动能、多周期方向和高级过滤器,帮助交易者减少噪音,避免弱势交易机会,并做出更有结构的交易决策。 该指标将复杂的市场计算转换为简单的视觉信号、彩色K线、趋势读数、止损水平和多个止盈区域,使交易者能够快速理解并应用于真实市场环境。 主要交易用途: 剥头皮和日内交易: 专为快速决策、清晰箭头、提醒、K线颜色和
Zoryk Gold
Reda El Koutbane
5 (2)
联系我获取推荐设置 首发名额有限 ZORYK — MetaTrader 5 专业 XAUUSD 黄金信号与交易计划系统 你一定经历过这种感觉。 你花时间分析黄金,等待入场,终于打开交易后,价格却立即向相反方向移动。你过早平仓,移动止损,或者因为犹豫几秒而错过机会。随后市场在没有你的情况下,准确到达你最初预期的目标。 问题并不总是方向错误。 真正的问题是不确定性。 你不知道真正的入场位置在哪里,不知道交易逻辑在什么位置失效,也不知道应该先保护较小的利润,还是继续等待更大的行情。你甚至不知道当前信号是否足够强,还是自己只是在勉强寻找一笔交易。 黄金移动速度非常快。没有明确计划的正确判断,也可能在几秒钟内变成错误决定。 ZORYK 正是为了解决这个问题而开发。 什么是 ZORYK ZORYK 是一套专门为 MetaTrader 5 和 XAUUSD M5 周期开发的完整黄金信号与交易计划系统。 它不是一个只显示 BUY 或 SELL 箭头,然后让你独自处理所有后续决定的普通指标。 每个确认信号都可以在图表上显示完整交易结构,包括入场位置、止损、第一止盈、主要止盈、
Quantum TrendPulse
Bogdan Ion Puscasu
5 (25)
介绍 Quantum TrendPulse   ,这是一款终极交易工具,它将 SuperTrend   、   RSI 和 Stochastic 的强大功能整合到一个综合指标中,以最大限度地发挥您的交易潜力。该指标专为追求精准和效率的交易者而设计,可帮助您自信地识别市场趋势、动量变化以及最佳进入和退出点。 主要特点: 超级趋势整合: 轻松跟随当前的市场趋势并乘上盈利浪潮。 RSI 精度: 检测超买和超卖水平,非常适合把握市场逆转时机,可用作 SuperTrend 的过滤器 随机精度: 利用随机振荡在波动的市场中寻找隐藏的机会, 用作超级趋势的过滤器 多时间范围分析: 从 M5 到 H1 或 H4,在不同时间范围内关注市场动态。 可定制的警报: 当您的自定义交易条件得到满足时收到通知,这样您就不会错过任何交易。 无论您是新手还是经验丰富的交易员,   Quantum TrendPulse 都能为您提供所需的优势,帮助您增强策略并自信地进行交易。借助这一强大的指标,将洞察力转化为利润 — 掌控您的交易! ***购买 Quantum TrendPulse,即可免费获得 Quantum Tr
GoldenX Entry MT5
Kareem Abbas
5 (14)
GoldenX Entry 是一款用于 MT5 的指标,包含自适应 Smart Entry Trend 算法、信号评分系统、市场状态识别器以及波动率过滤器。每个信号都包含计算得出的入场位、三个止盈位(TP1、TP2、TP3)以及止损位。它基于多个分析层构建,旨在适应不同市场条件,将多层分析系统与内置优化器及统计跟踪系统相结合。该指标基于风险收益比(RR)指标和历史交易行为提供量化分析。 开始使用非常简单——在所选时间周期上运行优化器,然后在图表上开始使用该指标。 核心功能 GoldenX Entry 将信号引擎与内置交易管理及历史统计跟踪整合在同一图表中: - 内置优化器: 优化器可在图表上单击运行。它通过两阶段搜索流程测试200种参数组合——先进行探索,再进行优化——并在完成后自动应用选定配置。结果会按时间周期缓存,因此当返回已优化的周期时,会立即恢复相同设置。 - 黄金品种自动周期识别: 将指标加载到任何 XAUUSD 图表(M1 到月线)。系统会自动识别当前周期并加载对应预设。共包含9个时间周期配置文件,专为黄金在标准周期上优化设计。切换周期时,参数会自动调整。 - 资金参考面
M1 Sniper MT5
Oleg Rodin
5 (4)
M1 SNIPER   是一款易于使用的交易指标系统。它是一个专为 M1 时间框架设计的箭头指标。该指标可以作为独立的系统在 M1 时间框架下进行剥头皮交易,也可以作为您现有交易系统的一部分使用。虽然该交易系统专为 M1 时间框架交易而设计,但它也可以用于其他时间框架。我最初设计此方法是为了交易 XAUUSD 和 BTCUSD。但我发现这种方法在其他市场交易中也同样有用。 指标信号既可以顺势交易,也可以逆势交易。我教授一种特殊的交易技巧,帮助您利用指标信号进行双向交易。该方法基于使用特殊的动态支撑位和阻力位区域。 购买后,您可以立即下载 M1 SNIPER 箭头指标。此外,我还为所有 M1 SNIPER 工具用户免费提供下方屏幕截图所示的 Apollo Dynamic SR 指标!这两个指标的组合可以帮助您更轻松、更准确地利用 M1 时间框架进行交易。 购买后请联系我,免费获取交易提示和奖励指标! 祝您交易成功!
Power Candles MT5
Daniel Stein
5 (9)
Power Candles V3 - 自我优化的强度指标 Power Candles V3 把货币与品种的强度直接转化为图表上可执行的交易方案。指标不再仅根据强度给K线着色,而是在后台持续运行实时自动优化,为您正面对的品种给出最佳 Stop Loss、Take Profit 与信号阈值。一键采用,Entry、Stop Loss、Take Profit 线就以精确价格绘制在图表上,提醒消息中直接包含方向。 本工具是 Stein Investments 生态系统的一部分 - 18+ 款工具,加上 Max,您的一对一 AI 交易导师。  随时在线,深入了解每一款指标,在您需要梳理思路的那一刻就在那里。  立即认识他: https://stein.investments 每根收盘K线运行 3,000+ 次交易模拟。9 种强度状态。2 种策略并行测试。一键采用最优配置。 为什么需要这个 大多数强度指标只给您一个数值,然后留下三个问题:相信哪个阈值、用哪个 Stop Loss、走哪个交易方向。Power Candles V3 在每根收盘K线上自动回答这些问题。结果就是一个完整的交易方案 -
Trend Catcher ind mt5
Ramil Minniakhmetov
5 (15)
趨勢捕捉指標 趨勢捕捉指標結合了作者獨有的客製化自適應趨勢分析指標,用於分析市場價格趨勢。它透過過濾掉短期噪音,並專注於潛在的動能強度、波動性擴張和價格結構行為,來識別真實的市場方向。此外,它還結合了平滑和趨勢過濾等客製化指標,例如移動平均線、相對強弱指標 (RSI) 和波動率過濾器。 您可以在這裡查看實際運行情況以及我的其他產品: https://www.mql5.com/en/users/mechanic/seller 請注意,我不會在 Telegram 上出售 EA 或任何設置,那是騙局。所有設定都可以在我的部落格上免費取得。 重要提示!購買後請立即聯繫我,以獲取使用說明和額外獎勵! 請注意,我不會在 Telegram 上出售 EA 或任何設置,那是騙局。所有設定都可以在我的部落格上免費取得。
Crystal Heikin Ashi Signals
Muhammad Jawad Shabir
5 (2)
Crystal Heikin Ashi Signals - Professional Trend & Signal Detection Indicator Advanced Heikin Ashi Visualization with Intelligent Signal System for Manual & Automated Trading Final Price: $149 ---------> Price goes up $10 after every 10 sales . Limited slots available — act fast . Overview Crystal Heikin Ashi Signals is a professional-grade MetaTrader 5 indicator that combines pure Heikin Ashi candle visualization with an advanced momentum-shift detection system. Designed for both manual traders
ARIPoint
Temirlan Kdyrkhan
1 (1)
ARIPoint is a powerful trading companion designed to generate high-probability entry signals with dynamic TP/SL/DP levels based on volatility. Built-in performance tracking shows win/loss stats, PP1/PP2 hits, and success rates all updated live. Key Features: Buy/Sell signals with adaptive volatility bands Real-time TP/SL/DP levels based on ATR Built-in MA Filter with optional ATR/StdDev volatility Performance stats panel (Success, Profit/Loss, PP1/PP2) Alerts via popup, sound, push, or email Cu
FX Power MT5 NG
Daniel Stein
5 (33)
FX Power:分析货币强度,助您做出更明智的交易决策 概述 FX Power 是一款专业工具,帮助您全面了解主要货币和黄金在任何市场条件下的真实强度。通过识别强势货币用于买入,弱势货币用于卖出, FX Power 简化了交易决策,并帮助您发现高概率的交易机会。不论您是想跟随趋势还是通过极端的 Delta 值预测反转,这款工具都能完美适应您的交易风格。别再盲目交易——用 FX Power 让您的交易更加智慧。 1. 为什么 FX Power 对交易者极具价值 实时货币和黄金强度分析 • FX Power 实时计算并显示主要货币和黄金的相对强度,助您全面了解市场动态。 • 监控领先或落后资产,轻松识别值得交易的货币对。 全面的多时间框架视图 • 跟踪短期、中期和长期时间框架的货币和黄金强度,以便将您的交易策略与市场趋势保持一致。 • 无论是快进快出的短线交易还是更长期的投资策略, FX Power 都能为您提供所需的信息。 Delta 动态分析用于趋势和反转 • 极端 Delta 值常常预示反转机会,而平缓的 Delta 变化则确认趋势延续。 • 使用 Delta 分析,轻
货币强度向导是一个非常强大的指标,为您提供成功交易的一体化解决方案。该指标使用多个时间范围内所有货币的数据来计算这个或那个外汇对的力量。此数据以易于使用的货币指数和货币电力线的形式表示,您可以使用它们来查看这种或那种货币的力量。 您所需要的只是将指标附加到您要交易的图表上,该指标将向您显示您交易的货币的真实强度。该指标还向您显示买卖量压力的极值,您可以在顺势交易时利用这些压力。该指标还显示了基于斐波那契的可能目标。该指标可用于各种交易时间范围。该指标支持各种货币对的交易。   该指标为您提供所有类型的警报,包括推送通知。 购买后请联系我。我将与您分享我的交易技巧,并免费为您提供丰厚的红利指标! 祝您交易愉快,获利丰厚!
Axiom Matrix
Issam Kassas
5 (4)
AXIOM MATRIX MT5 首发价格:$99 Axiom Matrix 现以 $99 的首发价格提供。 前 30 次购买完成后,价格将上涨至 $199。 购买后,请直接私信我,以获取使用说明并领取您的专属赠品奖励。 Axiom Matrix 是一款适用于 MetaTrader 5 的专业多品种、多时间周期市场扫描器和决策仪表板。 它会扫描您的 Market Watch,分析多个时间周期,读取多个证据引擎,比较最强的交易机会,并在一个清晰的矩阵仪表板中显示最佳 BUY、SELL、WAIT 或被阻止的状态。 我开发 Axiom Matrix,是因为我想要一个可以替我完成繁重市场扫描工作的工具。 我不想只单独检查 RSI。 然后单独检查 MACD。 然后检查移动平均线。 然后检查成交量。 然后检查波动率。 然后检查支撑和阻力。 然后还要手动在不同品种和时间周期之间切换,只为了建立一个交易思路。 我想要一个仪表板,可以扫描市场、比较证据、排序最佳机会,并告诉我现在最强的交易设置在哪里。 这就是 Axiom Matrix 背后的核心理念。 AXIOM MATRIX 的功能 Axiom Ma
Reversion King Indicator
Eugen-alexandru Zibileanu
5 (5)
全新王者降临 - 指标 + 订单管理提示(TP1 + TP2 + TP3)+ 可选 Telegram 信号发送器 INCLUDED(免费) (完整交易与信号系统) 我们最强的黄金 EA: Gold Slayer 该指标包含先进的交易策略、可自定义订单管理系统,以及结合 Envelope 扩展的均值回归系统,并通过 RSI 等多重智能确认过滤器进行验证,以捕捉高概率反转入场机会,提供 BUY 与 SELL 信号。 你不仅能够学习如何交易,还能学会如何高效管理多个仓位,并利用之前盈利的持仓来覆盖亏损交易。 专为 M5 周期打造并优化,在 BTCUSD 和 XAUUSD 上表现尤为出色,因为这些市场的流动性能够让信号更加干净、可靠。 该指标会自动生成清晰的多头(Long)与空头(Short)信号,同时基于 ATR 自动计算入场位、止损位和止盈位,让风险管理从一开始就融入系统之中。 多 TP 系统设有三个渐进式目标位,你可以在 TP1 锁定部分利润、在 TP2 继续持仓,并在更大的行情中将仓位持有至 TP3,而这正是平均风险回报比真正开始大放异彩的地方。 默认参数开箱即用,已经针对稳定表现进行
本产品已针对 2026 年市场进行更新,并针对最新 MT5 版本进行了优化。 价格更新通知: Smart Price Action Concepts 目前价格为 $200 。 接下来的 30 次购买 后,价格将上涨至 $299 。 特别优惠: 购买后,请发送私信给我,即可领取 免费赠品 + 礼物 。 首先需要强调的是,这款交易工具是不重绘、不回绘、不延迟的指标,因此非常适合专业交易使用。 Online course , and manual Smart Price Action Concepts 指标是一款非常强大的工具,适合新手和有经验的交易者使用。它将 20 多个实用指标整合到一个系统中,结合了 Inner Circle Trader Analysis 和 Smart Money Concepts Trading Strategies 等高级交易理念。该指标专注于 Smart Money Concepts,帮助交易者理解大型机构如何交易,并辅助预测其市场行为。 它特别擅长流动性分析,使交易者更容易理解机构交易逻辑。它也非常适合预测市场趋势并仔细分析价格走势。通过让交易与机构策略保
DayTrader PRO
Davit Beridze
DayTrader PRO DayTrader PRO 是一款先进的交易指标,它结合了约翰·埃勒斯 (John Ehlers) 的 Laguerre 滤波器与强大的自动优化引擎。该指标不依赖固定的参数,而是根据最新的市场状况自动搜寻最佳设置,帮助您在无需手动调整的情况下适应不断变化的市场波动。 该指标可生成清晰的买入 (BUY) 和卖出 (SELL) 信号,并提供根据当前市场波动率计算得出的自适应止损 (Stop Loss) 和止盈 (Take Profit) 水平。内置的趋势、效率系数 (Efficiency Ratio)、波动率和蜡烛图过滤功能,有助于剔除低质量的交易设置,从而提高信号的准确性。 实时性能面板会显示当前已优化的设置、利润因子 (Profit Factor)、胜率 (Win Rate)、回撤 (Drawdown) 以及其他交易统计数据。DayTrader PRO 还支持弹出窗口、推送、邮件和声音提醒,确保您不会错过任何交易机会。 主要功能 全自动参数优化 自适应买入与卖出信号 基于 ATR 的动态止损与止盈 支持每日、每周或每月重新优化 内置趋势与市场过滤功能 性能统
Smc Pro ToolKit
Talal N Z Aljarusha
5 (3)
SMC Pro ToolKit  is a professional chart-based Smart Money Concepts indicator for MetaTrader 5. It helps traders read market structure, identify key liquidity areas, organize trade context, and plan setups directly from the chart. This is not a simple buy/sell arrow indicator. It is a complete visual trading toolkit that combines Smart Money Concepts, multi-timeframe analysis, session context, setup planning, risk assistance, and professional dashboard tools in one clean workspace. Watch setup
成為突破者,隨著價格反轉,市場結構會改變利潤。 訂單突破者指示器可以識別趨勢或價格走勢何時接近枯竭並準備好逆轉。它會提醒您市場結構的變化,通常會在發生逆轉或重大回調時發生。 該指標使用專有計算來確定突破和價格動能。每當在可能的耗盡點附近形成新的高點時,指標就會繪製最後一個生成該高點的順序塊。然後,它將隨價格移動隨價格跟隨定單。然後,當價格轉向相反方向並突破該訂單塊時,它會提醒您,從而創建新的市場結構並開始趨勢或重大回調的可能逆轉。 訂單塊是在創建高/低之前的最後一個相反的彩色蠟燭,並且當價格跌破這些關鍵區域以下時,這表明趨勢可能會發生短期或長期反轉。 特徵 提醒您關鍵耗盡點的市場結構變化 價格接近耗盡水平時自動提取訂單塊 在一個方向繼續移動時,在價格後面跟踪定單,以提醒您最佳的反轉輸入 將顏色更改為純色塊,以顯示何時發生市場結構中斷。 適用於所有交易品種和時間範圍 內置集成的彈出窗口和電子郵件警報 策略和如何與定單破壞者指標進行交易 當斷路器塊發生時,您有兩個選擇。 看左邊!我們正在尋求供應/需求或支撐/阻力位嗎?市場結構轉變(逆轉)通常發生在價格重新測試舊水平或在該支撐或
Btmm state engine pro
Garry James Goodchild
5 (4)
BTMM State Engine Pro is a MetaTrader 5 indicator for traders who use the Beat The Market Maker approach: Asian session context, kill zone timing, level progression, peak formation detection, and a multi-pair scanner from a single chart. It combines cycle state logic with a built-in scanner dashboard so you do not need the same tool on many charts at once. What it does Draws the Asian session range; session times can follow broker server offset or be set in inputs. Tracks level progression (L
作者的更多信息
The Time Above Equilibrium Pattern identifies potential exhaustion points by measuring how long price remains above or below a dynamic equilibrium level. Creator:  https://www.quant-atlas.com/ The equilibrium line acts as a smoothed reference point for market balance. When price spends an extended period above this line, the indicator tracks the duration of that move and monitors whether upward support is beginning to weaken. A bearish exhaustion signal may appear when price has remained above e
FREE
Fibonacci Timing Indicator by Quant Atlas Creator:  https://www.quant-atlas.com/ Fibonacci Timing Indicator is a clean signal based trading tool designed to identify potential turning points through a timing sequence framework inspired by Fibonacci spacing. The indicator studies price behavior across selected historical reference points and looks for repeated directional pressure. When the sequence reaches completion, it plots a clear signal directly on the chart. Signal Display • Green upward t
FREE
Median is a clean price structure indicator designed to plot the rolling median of recent highs and lows directly on the chart. Creator:  https://www.quant-atlas.com/ The indicator calculates the 50th percentile of recent low prices and high prices over a selected lookback window. This creates two dynamic reference lines that can help traders read the central structure of recent price behavior. Signal Display • Purple line: rolling median of lows • Red line: rolling median of highs These lines
FREE
K's Synapse is a market structure indicator designed to provide a clear visual reading of bullish pressure, bearish pressure, and uncertainty directly on the price chart. Creator:  https://www.quant-atlas.com/ The indicator evaluates recent price structure across multiple reference points and converts the results into colored dots, rolling market surety percentages, and high intensity triangle signals. Dot Structure • Blue dots represent bullish price structure • Red dots represent bearish price
FREE
Orange Indicator by Quant Atlas Creator:  https://www.quant-atlas.com/ Orange Indicator is a clean reversal focused indicator for MetaTrader 5, designed to highlight potential turning points directly on the chart using simple orange buy and sell markers. The indicator focuses on moments where price may be transitioning out of short term exhaustion and into a possible reaction phase. When a bullish setup appears, an orange upward triangle is displayed below the candle. When a bearish setup appear
FREE
Blue Indicator by Quant Atlas Creator:  https://www.quant-atlas.com/ Blue Indicator is a clean reversal focused trading tool designed to detect potential turning points through a slope based momentum framework. The indicator studies the momentum of price slope and highlights moments where that momentum begins to move away from an extreme zone. When conditions align, it plots blue triangle signals directly on the chart. Both bullish and bearish signals use the same blue visual identity, giving th
FREE
Green Indicator by Quant Atlas Creator:  https://www.quant-atlas.com/ Green Indicator is a clean reversal focused trading tool designed to highlight potential turning points using momentum pressure and directional slope behavior. The indicator studies the relationship between momentum position and momentum direction. When market pressure reaches an extended condition and begins to shift, the indicator plots green triangle signals directly on the chart. Both bullish and bearish signals use the sa
FREE
Creator:  https://www.quant-atlas.com/ Freyja is a visual pattern based indicator designed to highlight potential exhaustion and reversal areas using a structured time and price framework. The indicator studies how price behaves across repeated timing sequences and marks areas where the market may be approaching a potential turning point. It is built to give traders a clean visual layer that can be added to their existing analysis process. Signal Categories • Blue triangles Low conviction patte
FREE
Red Indicator  by Quant Atlas Creator:  https://www.quant-atlas.com/ Red Indicator is a clean reversal focused tool designed to highlight moments where price may be moving away from an extreme condition and entering a potential turning zone. The indicator uses a price derived volatility framework to detect areas where market pressure may have become stretched. When conditions align, it plots red triangle signals directly on the chart. Both bullish and bearish signals use the same red visual iden
FREE
Violet Indicator  by Quant Atlas Creator:  https://www.quant-atlas.com/ Violet Indicator is a clean reversal focused trading tool designed to identify moments where price may be shifting away from an extended directional condition. The indicator uses a price derived trend framework to detect moments where market structure may be changing. When conditions align, it plots violet triangle signals directly on the chart. Both bullish and bearish signals use the same violet visual identity, giving the
FREE
Indigo Indicator by Quant Atlas Creator:  https://www.quant-atlas.com/ Indigo Indicator is a clean reversal focused trading tool designed to identify potential turning points through a price sequence framework. The indicator studies how price has behaved across multiple prior reference points and highlights moments where that sequence may be shifting. When conditions align, it plots indigo triangle signals directly on the chart. Both bullish and bearish signals use the same indigo visual identit
FREE
SwapGuard
Sofien Kaabar
Swap Guard Pro is a non directional MT5 dashboard designed to help traders understand overnight holding costs before they become a silent drag on performance. The indicator displays long and short swap values, estimated daily holding cost, triple swap day, next rollover timing, current spread, tick value, margin requirement, open exposure, accrued swap, floating PnL, and projected next rollover cost directly on the chart. It is built for traders who hold positions overnight, trade multi asset po
FREE
Trader Cockpit
Sofien Kaabar
Trader’s Cockpit is a simple non directional dashboard for MetaTrader 5 designed to give traders a quick, clear view of their trading environment directly on the chart. Creator:  https://www.quant-atlas.com/ The indicator does not generate buy or sell signals, does not predict market direction, and does not perform any trading action. Its purpose is to make the trader’s daily workflow easier by centralizing useful account, symbol, spread, session, and broker condition information in one compact
FREE
Vision:产品说明 Quant Atlas 的 Vision 是一款多组件反转信号指标,旨在识别流动性市场中的短期看涨和看跌衰竭点。该模型整合了多个独立的技术证据层,包括动量行为、均值回归压力、基于波动率的条件、趋势互动、时机结构,以及与移动平均线相关的确认因素。最终结果会直接转换为图表上的可视化信号强度标记。 该指标主要用于反转分析。它的目标是突出价格可能已经过度延伸、结构上变得脆弱,或正在接近潜在方向转换的区域。Vision 最适合作为决策辅助层,与价格行为、市场结构、蜡烛图行为、支撑与阻力、流动性区域,以及更广泛的趋势背景结合使用。 信号理念 Vision 不会以相同方式处理所有反转条件。每个信号都会根据其背后的证据数量和质量进行分类。 只有当模型的综合评分达到预设的信号强度区域时,信号才会生成。内部组件之间的一致性越强,信号分类的重要性就越高。 该指标使用三个实用的信号强度等级: 蓝色三角形:中等信号强度 蓝色三角形代表中等反转信号强度。 这些信号表示模型已经检测到有意义的看涨或看跌反转条件,但证据还不足以将其归类为高强度信号。 当模型检测到中等看涨反转倾向时,蓝色看涨三角
Reversal Indicator I   by Quant Atlas Creator:  https://www.quant-atlas.com/ Reversal Indicator I is a clean reversal focused indicator designed to help traders identify potential bullish and bearish turning points directly on the chart. The indicator highlights moments where the market may be approaching exhaustion and where a tactical reversal setup may be forming. Signals are displayed with simple visual triangles, making the tool easy to read without cluttering the chart. Key idea Markets of
Three Dimensional Reversal Indicator  by Quant Atlas Creator:  https://www.quant-atlas.com/ Three Dimensional Reversal Indicator is a clean and focused reversal tool designed to identify potential market turning points through a three dimensional view of price behavior. The model combines three key dimensions: • Time How long market pressure has remained one sided. • Price Where price is currently positioned relative to its recent behavior. • Price Derived Structure A transformed view of pric
Fibonacci Moving Average by Quant Atlas Fibonacci Moving Average is a visual trend structure indicator built around a layered Fibonacci based moving average framework. The indicator plots two dynamic average lines directly on the price chart, creating a clean view of how price behaves relative to broader trend structure. The lines automatically change color depending on the position of price, making market direction easier to read at a glance. Visual Logic • Blue line state: price is trading abo
The Rainbow Dragon Indicator by Quant Atlas Creator:  https://www.quant-atlas.com/ The Rainbow Dragon is a composite signal engine that aggregates the seven Rainbow indicators — Blue, Green, Indigo, Red, Violet, Yellow, and Orange — into a single confluence-based reading. Rather than relying on any one model, it treats each Rainbow component as an independent voter and fires only when enough of them agree, giving you a diversified, multi-method read on the market instead of a single point of vie
HorizonsFX Stability is a multi currency Expert Advisor for MetaTrader 5 designed to trade major FX pairs using a structured daily signal model. The system scans several major currency pairs, evaluates directional pressure, volatility behavior, and market structure conditions, then opens trades when the internal score reaches a valid setup. Creator:  https://www.quant-atlas.com/ The product is designed for traders who want a systematic FX robot with clear risk controls, multi pair diversificatio
Yubel Divergence Detection is a momentum exhaustion indicator for MetaTrader 5 designed to help traders identify potential directional turning points when price movement begins to lose internal strength. Creator:  https://www.quant-atlas.com/ The indicator focuses on divergence style behavior and momentum fatigue, highlighting moments where the market may be preparing for a reversal, continuation failure, or short term directional shift. It is built as a visual signal tool, giving traders a fast
Dynamic RSI Volatility Based Creator:  https://www.quant-atlas.com/ Dynamic RSI Volatility Based is an adaptive momentum indicator designed to adjust its RSI sensitivity according to changing market volatility. Instead of relying on one fixed RSI period at all times, the indicator adapts its internal lookback based on recent volatility conditions. When volatility changes, the RSI calculation becomes more responsive or smoother depending on the current market environment. This gives traders a mor
Euro Pulse is a MetaTrader 5 Expert Advisor designed specifically for EURUSD trading. The system focuses on short holding periods, controlled exposure, and structured trade selection instead of aggressive recovery methods or high risk position scaling. Creator:  https://www.quant-atlas.com/ The Expert Advisor is built for traders who want a focused EURUSD robot with simple risk behavior, clear execution logic, and a clean trading profile. It does not use martingale, grid trading, averaging down,
筛选:
无评论
回复评论