 MetaTrader 5
 专家
专家
 指标
指标
 程序库
程序库
 实用工具
实用工具
 窗口小部件
窗口小部件
 规则
规则
适用于MetaTrader 5的免费技术指标 - 25
 技术指标的信号外汇和股票市场的开仓交易和平仓交易起着至关重要的作用。指标的本质就是一种交易品种的数学转换,旨在预测未来的价格变化。
测试技术指标可以更有利于预测市场行为并从中获利。
技术指标的信号外汇和股票市场的开仓交易和平仓交易起着至关重要的作用。指标的本质就是一种交易品种的数学转换,旨在预测未来的价格变化。
测试技术指标可以更有利于预测市场行为并从中获利。 
Quantora Fair Value Gap Pro MT5 is a MetaTrader 5 indicator that detects bullish and bearish Fair Value Gap zones created by price imbalances. Detected zones are displayed on the chart and can be extended until the selected mitigation condition is met. The indicator tracks active, mitigated and fully filled zones according to its input settings. Fair Value Gap Detection Bullish and bearish Fair Value Gap detection Active, mitigated and fully filled zone tracking First Touch and Full Fill mitigat
FREE

ICONIC TRENDLINE 适用于 MetaTrader 5 标题: ICONIC TRENDLINE:带多周期(MTF)面板与提醒的高级趋势指标 简要说明 还在总是 太晚 识别趋势、并在震荡市里被 假信号 误导吗?MT5 指标 ICONIC TRENDLINE 正是为此而生。它将 智能 EMA 逻辑 与 ADX 趋势强度 结合,提供 清晰、提前、已过滤 的趋势信号。借助 动态趋势线 、 多周期仪表盘 和 即时推送通知 ,你的交易将比以往更 自信 、更 精准 。 指标关键特性 动态变色趋势线 在图表上绘制一条清晰的趋势线,并依据当前方向自动变色: 蓝色: 已确认上升趋势(多头)。 红色: 已确认下降趋势(空头)。 在 中性 阶段,趋势线保持 上一个颜色 ,以避免不必要、易误导的频繁变色(“拉锯/假突破”)。 基于 ADX 的智能趋势过滤(核心) 仅当关键 EMA( 9、21、50 ) 按正确顺序排列 且 ADX 达到 最低强度 (默认 > 20 )时才发出趋势信号。该过滤器能有效排除大多数假信号高发的 弱势/横盘 市场。 多周期(MTF)GUI 面板 一眼把握“大局观”!图表右侧
FREE

SMC Blue Shadow Signals SMC Blue Shadow Signals is an all-in-one technical analysis suite engineered for traders utilizing Smart Money Concepts (SMC). The indicator automates the identification of market structure, liquidity zones, and institutional order flow, providing a comprehensive visual framework for multi-timeframe market analysis. Technical Features 1. Advanced Market Structure Mapping The indicator utilizes automated structural logic to map price action in real-time: Break of Structure
FREE

The « Multi-Standard Dev Channel» indicator is based on the statistical concept of linear regression, with Gilbert Raff being the first to implement it as a technical analysis indicator. Basically, it is one of many ways of making future projections based on known past and current data; it also requires that the variables be linearly related, i.e., that changes in the variables remain stable, resulting in a straight line on the plane, hence the term «linear». Advanced users may rightly note th
FREE

ChopShield Pro — Smart Range Shield & Trend Hunter ChopShield Pro is a technical trend indicator that utilizes the dynamic momentum oscillator (Chande Momentum Oscillator — CMO) to automatically adapt its smoothing period to current market volatility. Unlike standard fixed-period moving averages (EMA, SMA), ChopShield Pro continuously measures market momentum: In the consolidation phase (ranging market / chop): As relative volatility decreases, the smoothing factor drops, and the indicator l
FREE

Pure SMC is a professional Smart Money Concepts (SMC) based trading indicator designed to help traders analyze institutional market behavior, liquidity movements, and price structure directly on the MetaTrader 5 platform. The indicator focuses on real market structure analysis instead of traditional lagging signals. It helps traders identify important institutional areas such as Break of Structure (BOS), Change of Character (CHoCH), Order Blocks, Fair Value Gaps (FVG), and Liquidity Zones. Main
FREE

该指标显示的信号买入和卖出。
时间栏:任意。
情侣:任何。
参数alertsMessage - 禁用和启用的消息框。
参数alertsSound - 关闭或开启声音。
参数箭头类型 - 选择射手的图标,
三是没有过滤的信号指示灯的复杂方式:
1)检查指标的方向更高级的时间表。 2)使用标准图表MACD。 3)使用的指标抛物线。
它应该也不会忘记利用资金管理和止损。 中国传统:
该指标显示的信号买入和卖出。
时间栏:任意。
情侣:任何。
参数alertsMessage - 禁用和启用的消息框。
参数alertsSound - 关闭或开启声音。
参数箭头类型 - 选择射手的图标
三是没有过滤的信号指示灯的复杂方式:
1)检查指标的方向更高级的时间表。 2)使用标准图表MACD。 3)使用的指标抛物线。
它应该也不会忘记利用资金管理和止损。
FREE

HTF Candles Nika 可将任意更高时间框架的完整K线直接叠加显示在MetaTrader 5的当前图表上,无需切换图表即可获得多时间框架视角。
主要功能
- 在当前图表上以矩形加影线的形式绘制高时间框架K线 - 支持标准K线和平均K线(Heiken Ashi)两种显示模式 - 实时倒计时,显示当前高时间框架K线距关闭的剩余时间 - 多头和空头K线颜色可自定义 - 自动或手动控制K线宽度 - 可配置影线宽度、字体、字号及文字位置偏移 - 适用于任何品种和时间框架组合 - 自动检测交易时段间隙并调整渲染 - 轻量级 — 仅使用图表对象,无指标缓冲区
输入参数
显示设置 - Max Lookback — 绘制的高时间框架K线数量(默认:500) - Timeframe — 要显示的高时间框架(默认:H1) - Bars Mode — K线或平均K线模式
颜色设置 - Up Color — 多头K线颜色(默认:DodgerBlue) - Down Color — 空头K线颜色(默认:Red) - Frame Color — 时间框架标签颜色(默认:Red) - Count
FREE

Session Breakout & Range Indicator
Overview A lightweight, clean utility indicator designed to plot the high and low of the Asian trading session while clearly dividing the Asian, London, and New York sessions on your MetaTrader 5 charts. Ideal for session breakout strategies, ICT concepts, and liquidity sweeps.
Key Features
Asian Session Range Box: Automatically calculates and highlights the exact High and Low formed during the Asian session.
Session Separators: Distinct visual dividers ma
FREE
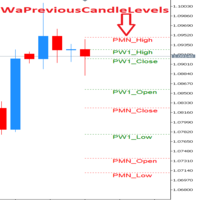
Previous Candle Levels MT5 shows the previous candle levels, it shows the previous candle Open High Low Close levels (OHLC Levels) in different time frame. It's designed to help the trader to analyse the market and pay attention to the previous candle levels in different time frame. We all know that the OHLC Levels in Monthly, Weekly and Daily are really strong and must of the time, the price strongly reacts at those levels. In the technical analysis, the user can use them as a support and res
FREE

The Weis Wave first takes the market volume and then organizes it with the price into Wave charts. It is the only software that will present the true picture of the market before you. If anyone of you, has watched an intraday price movement then you must know that it unfolds in a series of selling as well as buying waves-a procedures tearing down and building up. Wave analysis is an integral part of the trading method. The indicator helps to deal with today’s volatile market. Moreover, it works
FREE

OrderBlock Visual Smart Money Concepts — Clear Order Block Visualization OrderBlock Visual is a visual analysis indicator designed to help traders identify and monitor potential Bullish Order Blocks and Bearish Order Blocks directly on the MetaTrader chart. The indicator transforms Order Block concepts into clear chart zones, making it easier to observe potential areas of institutional price reaction and market structure. Key Features Bullish Order Block Detection Highlights potential bullish
FREE

受到2016年(05月份)ICT私人辅导课程在YouTube上的启发,我们的创新工具赋予交易者精准驾驭市场的能力。通过标记60、40和20天的周期,它有助于识别重要的市场变动,借鉴了ICT传授的智慧。 这个指标真正与众不同的地方在于它的前瞻能力,这一特点基于对历史数据的深入分析,提供宝贵的未来市场行为洞察。这种前瞻性方法赋予交易者做出明智决策所需的远见,为他们在当今充满活力的交易环境中提供了独特的优势。 此外,我们的指标提供了定制选项,允许交易者根据自己的特定偏好和交易策略进行调整。凭借这种高度的适应性,交易者可以自信地预测市场趋势,利用ICT的教导保持领先地位,并抓住有利可图的机会。 体验我们的指标的前瞻性和定制化能力,开始一段旅程,提升您的交易技能,实现您的财务目标
FREE

HubDynamicTrendLine — 枢轴通道趋势线指标 本指标基于左右各 N 根 K 线(默认 15)识别严格枢轴高点与低点,将同类枢轴依次连接,构建动态的通道上下边界。 核心功能 枢轴连线 :连续枢轴高点之间、枢轴低点之间用实线连接,形成可视化通道。 斜率投影 :当相邻两个同类型枢轴的价差 ≥ 200 周期 ATR 时,从最新枢轴按该段斜率向前投影(默认 70 根 K 线),用点线标示潜在的通道延伸方向。 突破标记 :若最新收盘价穿越活跃投影线,在对应 K 线旁标注 "Up"(上破)或 "Down"(下破)。 最新枢轴水平 :以水平虚线及价格标签持续追踪最近一个高点 / 低点的价位,辅助支撑阻力判断。 输入参数 参数 说明 默认 Pivot Length 枢轴左右回看 K 线数 15 Extend Length 投影长度(K 线数) 70 Ext. Style 投影线型 Dot High Color 枢轴高点颜色 Blue Low Color 枢轴低点颜色 Lime Show Levels 显示最新枢轴水平线 true Show Breakout 显示突破方向标签 tru
FREE
ZigZag Optimized 指标介绍 ZigZag Optimized 指标由 MetaQuotes Ltd. 开发,已更新至 2.00 版本,是 MetaTrader 5 平台上强大的技术分析工具。设计目的是通过连接价格的峰值和谷值来识别显著的price reversal,为交易者提供更高的准确性。 关键优势 精确的背离支持 : 帮助确定合理的价格区域,与 RSI 搭配使用时与背离算法高度兼容。 高级噪声过滤 : 利用 InpNeighborCount 和 InpThresholdRatio 检测异常值并调整价格以确保稳定性。 可定制参数 : 提供灵活的输入选项,如 InpDepth (12)、 InpDeviation (5) 和 InpBackstep (3),适用于个性化分析。 视觉增强 : 包含可选的 InpShowLabels 功能,在关键点显示价格标签。 高效性能 : 优化后的代码确保即使处理大数据集也能平稳运行。 应用 趋势分析 : 适合识别主要趋势和支撑/阻力位。 艾略特波浪分析 : 支持波形模式识别。 背离检测 : 提高基于背离的交易策略精度。 自动交易 :
FREE

LIVE TRADES CHARTS – MQL5 INDICATOR
DESCRIPTION Live Trades Charts is a MetaTrader 5 indicator that displays active trading positions directly on the chart.
The indicator reads open trades and shows basic trade and account information in real time.
It updates on every tick.
FUNCTIONS Displays open trades on chart
Per trade information: Symbol Lot size Direction (Buy or Sell) Floating profit or loss Trade duration
Account information: Total floating profit/loss Number of open trades Balanc
FREE

MQL5 Market Description - PragmAlgo Position Size Calculator PragmAlgo Position Size & Risk Architecture Calculator Category: Indicators / Utilities / Risk Management / Lot Size Calculation
Platform: MetaTrader 5 (MT5 Desktop)
Supported Assets: 100% Multi-Asset (Forex majors & crosses, Gold XAUUSD, US Indices US30 / NAS100, DAX GER40, Crypto BTCUSD / ETHUSD, and Commodities)
Timeframes: All Timeframes (M1 to Monthly — Optimized for scalping, day trading, and swing trading)
License: 100% Free (Es
FREE

CCI Advanced is an enhanced Commodity Channel Index indicator for MetaTrader 5. It keeps the classic CCI engine but adds a clearer visual interface, automatic buy/sell signals, a dynamic histogram, and strong-signal and divergence detection. Features Automatic signals: prints buy/sell cues from CCI behavior at the zero and extreme levels. Dynamic color histogram: shows momentum strength and direction at a glance. Divergence detection: highlights divergence between price and CCI as an early rever
FREE

上一日支撑与阻力 平台: MetaTrader 5
类型: 自定义指标
显示位置: 图表窗口(叠加) 功能: 根据前一天的最高价和最低价计算 支撑与阻力区域 。 使用滑动窗口 ( SampleWindowSize ) 分析近期价格区间。 当当前价格区间显著低于前高时,标记为 潜在支撑区 。 当价格区间高于前低时,标记为 潜在阻力区 。 输出 4 个结果: LDResistanceHigh – 阻力顶部 LDResistanceLow – 阻力底部 LDSupportHigh – 支撑顶部 LDSupportLow – 支撑底部 输入参数: SampleWindowSize (默认值:10)
用于识别小范围价格区间的K线数量。 输出值: LDResistanceHigh / LDResistanceLow 显示潜在的阻力区间。 LDSupportHigh / LDSupportLow 显示潜在的支撑区间。
FREE

POI Detector – Automatic Smart Money Points of Interest (POI) Structure Identifier The POI Detector is a MetaTrader 5 indicator developed for traders who use Smart Money Concepts (SMC) and Price Action methodologies. It automates the identification of relevant Points of Interest (POIs) on the chart through strict detection of the ABCD pattern with growing legs and C-Level breakout confirmation (DE extension). Key Features ABCD Pattern Detection Algorithm: Identifies complete structures where
FREE

OVERVIEW MAK Adaptive Momentum Bands is a high-performance trend-following indicator for MetaTrader 5 built to solve the most persistent challenge in technical analysis: filtering market noise from genuine price movement. Unlike standard Bollinger Bands or Keltner Channels that rely on fixed lookback periods, MAK Adaptive Momentum Bands uses the Kaufman Efficiency Ratio (ER) to continuously and automatically adjust its sensitivity to current market conditions. The engine speeds up during clean,
FREE

Advanced Sessions 是一款专业的 Forex 市场交易时段指标,专为追求精准、清晰视觉效果以及高性能 MetaTrader 5 体验的交易者开发。 该指标可自动识别主要市场交易时段:
• 亚洲
• 伦敦
• 纽约 交易时段会根据经纪商时区以及夏令时(DST)变化自动调整,确保始终与真实市场时间保持同步。 Advanced Sessions 专为日内交易设计,可清晰、有序地展示机构市场行为,帮助交易者分析区间、交易时段重叠、波动性以及高流动性时段。 主要功能:
• 自动检测经纪商 GMT 时区
• 自动夏令时(DST)调整
• 手动时区设置
• 机构级 Forex 交易时段
• 图表上的交易时段可视化标记
• 时段开盘线
• 区间与交易时段重叠显示
• 支持多时间周期
• 快捷键隐藏/显示交易时段
• 干净且专业的视觉设计 该指标经过专门优化,轻量、高效且稳定,可同时运行于多个图表而不会影响平台流畅性。 Advanced Sessions 为 Forex 市场交易时段提供清晰专业的可视化效果,帮助交易者精准识别交易日中最重要的时刻。
FREE

SmartWaterMark Essential 是一款适用于 MetaTrader 5 的轻量级水印指标。
它可以在图表中央显示清晰、简洁的交易品种水印,帮助您快速识别当前图表正在查看的交易品种。对于同时使用多个图表、多个品种或多个时间周期的交易者来说,这可以让工作区更加整洁,也能减少切换图表时的识别错误。
功能: - 居中的交易品种水印 - 可在基于时间的图表上选择显示时间周期 - 支持显示交易品种描述 - 提供基本的文字颜色、透明度和字体自定义
SmartWaterMark Essential 专为日常图表管理而设计,设置简单,视觉风格低调,不会干扰价格走势阅读,同时让图表信息更加清楚。
简洁、清晰,并且适合日常图表整理。适合日常使用。
FREE

趋势,趋势指标,动量,振荡器,直方图,趋势强度,市场流动,趋势确认,看涨,看跌,技术分析
Trend Flow Oscillator 是一个市场流动性与动量指标,旨在帮助交易者清晰、简洁、快速地识别价格走势的强度和方向。 在 M5 时间周期中效果尤为显著,因为该周期中市场流动变化更加频繁。 功能 识别买卖力量的变化与延续 显示价格运动的加速与减速 帮助确认顺势入场 以独立柱状图形式展示市场流动 作为方向性动量振荡指标使用 适用人群 主观交易者 短线和日内交易者(特别是 M5) 寻求流动性确认而非自动信号的交易者 趋势及回调交易者 喜欢简洁直观指标的用户 使用方法 推荐使用时间周期:M5 柱状图解读: 正值柱表示买方力量增强 负值柱表示卖方力量增强 柱体越大,动量越强 该指标可用于: 确认顺势交易入场 避免逆势交易 验证突破及趋势延续 建议结合以下方法使用: Price Action 支撑与阻力 市场结构 说明:该指标为确认工具,不应作为单一入场信号使用。 限制 不是交易机器人 不会自动开仓或平仓 不预测市场走势 不替代风险管理 不保证盈利 风险提示 金融市场交易具有高风险。
历史表
FREE

ATR Based Swing Trader Indicator Description The ATR Based Swing Trader Indicator is a sophisticated technical analysis tool designed for MetaTrader 5 (MT5) to assist swing traders in identifying potential buy and sell signals based on the Average True Range (ATR) and trend direction. Developed by Rahulkumar Kanani, this indicator leverages volatility and price movement to generate actionable trading signals, making it suitable for traders who aim to capture short- to medium-term price swings in
FREE

The indicator displays volume profiles based on the nesting principle. Profiles periods are pre-set so that each subsequent profile has a length twice as long as the length of the previous profile. In addition to profiles, the indicator displays volume clusters sorted by color, depending on the volume they contain.
Indicator operation features The indicator works on typical timeframes from M5 to MN, but for calculations uses historical data from smaller timeframes: M1 - for timeframes from M5
FREE

Stochastic RSI-RVI Fusion is a next-generation oscillator that goes beyond the standard Stochastic RSI. By combining the momentum precision of the Relative Strength Index (RSI) with the energy and volatility analysis of the Relative Vigor Index (RVI) , this indicator provides a smoother, more reliable oscillating signal for traders looking to filter out market noise. Standard oscillators often give false signals during choppy markets. This "Fusion" edition solves that by averaging market
FREE

This indicator was named “Multiple Moving Averages” because it can plot up to 10 different moving averages on the same chart, assigning each a color that creates a blurred effect, which significantly improves its visual appeal and ease of interpretation. The only limitation is the number of available moving averages of different types. In the case of ThinkScript, the documentation states that there are five different types of moving averages: simple, exponential, weighted, Wilder’s moving averag
FREE

ChartMarker
is a chart-window indicator for marking up your charts with trend lines and order blocks. You draw directly on the chart with mouse clicks instead of switching MetaTrader drawing tools on and off. ChartMarker keeps markup fast and consistent during review and live trading. One compact panel controls the active tool, visibility, cleanup, and backup. Drawings stay on the chart as standard objects you can still select and adjust in MetaTrader when needed. Main features Trend lines fro
FREE

Professional Trading Tools for Every Trader: https://www.mql5.com/en/users/royalcrescent777/seller
Hyper Flow is a Smart Money Concepts (SMC) indicator that maps institutional price action onto your chart and keeps every feature under your control through a built-in panel. It suits discretionary analysis on any symbol and timeframe, including Forex, gold and metals, indices, and cryptocurrencies.
The tool reads market structure in real time across two layers. Internal shifts and broader swin
FREE

产品简介 TD Sequential Pro 是一款专为 MT4 和 MT5 双平台设计的九转序列主图指标,基于经典的 Tom DeMark 序列理论深度开发。该指标通过统计连续 9 根 K 线的收盘价与 4 根前 K 线的比较关系,精准识别市场动能衰竭点。它能帮助交易者在趋势末端捕捉高概率的反转机会,并提供完善的序列跟踪、数字标记与多通道信号提醒功能。 核心功能 九转序列数字标记与 K 线染色 系统会自动统计上涨和下跌的连续计数,当计数达到 5 至 9 时,会在 K 线高低点附近标注对应数字。上涨序列 5-8 显示为紫色,9 显示为绿色;下跌序列 5-8 显示为青色,9 显示为红色。5-8 的数字标记采用回溯确认机制,仅当该轮序列最终走满 9 时才会显示,确保信号的有效性。 MT5 版本额外支持趋势 K 线染色功能 ,让序列进程通过颜色变化一目了然。 做多信号 Low 9 (低九) :当连续 9 根 K 线的收盘价均低于各自前 4 根 K 线的收盘价时触发。这代表空头动能已经极度衰竭,市场出现高概率的底部反转信号,是经典的左侧建仓或加仓时机。 TD Track Down
FREE

<h2>Candles Size Stats</h2><p><strong>Candles Size Stats</strong> 是一款轻量且强大的指标,可以测量并可视化每根 K 线的大小(High − Low 的幅度),以皮折为单位,帮助您即刻了解任意品种和周期上的价格波动性状况。</p><h3>功能介绍</h3><p>该指标在独立窗口中以彩色柱状图显示每根 K 线的完整幅度。当当前 K 线大于上一根时显示为绿色,小于时显示为深绿色,波动性的扩大与收缩一目了然。</p><p>在柱状图上方,可叠加最多五条统计参考线,基于所选长度的滚动回望计算:</p><ul><li><strong>平均値</strong> — 过去 N 根 K 线幅度的简单算术平均値</li><li><strong>中位数</strong> — 排序分布的中间値,对极端値不敏感</li><li><strong>P90 / P70 / P50</strong>(或任意自定义百分位数)— X% 的 K 线幅度低于此局常参考大小线</li></ul><h3>图表信息面板</h3><p>可选的悬浮面板实时显示最新已关闭 K
FREE

Market Structure Fractals The structure layer MetaTrader 5 was missing Most traders stare at candles and draw structure manually — imprecisely, inconsistently, and always too late. You know what a fractal high and low look like. The question is whether you can spot every one, mark it cleanly, and track it the moment price breaks through. You can't. Market Structure Fractals can.
MetaTrader 5 shows you price. It doesn't show you structure.
That gap — between a candle pattern and a confirmed bre
FREE

Price Action 6 Pattern Pro 是一款适用于 MetaTrader 5 的技术分析指标,可在图表上自动识别并显示六种经典 Price Action 价格行为形态。 该指标用于市场分析。它不会自动开仓、修改订单或平仓。信号基于已确认的价格结构生成,并可通过箭头、文字标签以及可选的形态结构图形直接显示在图表上。 指标支持以下六种形态: Inside Bar Breakout Outside Bar Pivot Point Reversal(PPR) Move-Congestion-Move(MCM) 1-2-3 Reversal 2B Reversal 所有信号均基于 已收盘 K 线 进行判断。 主要功能 一个指标内集成 6 种 Price Action 模型 分别识别多头和空头信号 基于已收盘 K 线确认信号 图表内交互式控制面板 每种形态可独立开启或关闭 全局 BULL / BEAR 方向过滤 Confluence 共振模式 每种形态的信号计数 显示最近一次检测到的信号 可选的形态结构可视化 三种标签显示模式:OFF、RECENT、ALL 弹窗、Push 和 Em
FREE

The SnR Volume Profile Indicator is a smart, adaptive market-structure tool designed to reveal where price truly reacts within the currently visible chart area . By combining support & resistance detection, volume profiling, and viewport awareness, the indicator delivers highly relevant, clutter-free insights that evolve dynamically with your chart. Viewport-Aware Intelligence Unlike traditional static indicators, this tool recalculates everything only within the visible bars on your chart. As y
FREE

ZST News Clock is a professional digital clock and economic news panel for MetaTrader 5. ZST News Clock is a professional digital clock and economic news panel for MetaTrader 5. The tool displays a clean digital clock directly on the chart, showing the exact time with hours, minutes, seconds, and visual microseconds. It is especially useful for traders who need to follow the market with better timing precision, mainly by watching the seconds counter directly on the chart. It also includes a col
FREE

Risk Reward Ratio Calculator - a free tool that tells you instantly whether a trade is worth taking. Enter your entry, stop-loss and take-profit prices and see the risk/reward ratio, potential loss and potential profit before you open the position. Successful traders only take trades with a favourable reward compared to risk. This calculator draws your entry, stop and target directly on the chart and shows the exact R:R multiple, so you can reject bad setups and size good ones correctly. Feature
FREE

Supertrend 趨勢指標 Supertrend 是一款用於判斷市場趨勢方向與趨勢轉換的技術指標,透過市場價格與波動幅度的變化,自動繪製趨勢線,協助交易者快速辨識目前市場偏多或偏空。 當市場趨勢發生改變時,指標會在圖表上顯示對應的 Buy / Sell 訊號 ,讓使用者更直觀地掌握可能的趨勢轉折位置。 此指標適合用於外匯、黃金、指數、加密貨幣等不同市場,也可搭配其他技術分析工具作為交易方向過濾、進場確認或趨勢追蹤使用。 主要功能包含: 自動判斷目前市場趨勢方向 顯示多頭與空頭 Supertrend 趨勢線 趨勢轉換時顯示 Buy / Sell 訊號 ATR 週期可自由調整 ATR 倍數可自由設定 支援不同價格計算來源 可自由開啟或關閉交易訊號 支援趨勢切換提醒 可自訂線條顏色與顯示方式 適用於不同商品與時間週期 Supertrend 可以單獨作為趨勢判斷工具,也可以搭配均線、支撐壓力、價格型態或其他交易策略使用,協助交易者更快速地辨識市場方向與趨勢變化。 注意:本指標僅提供市場分析與交易訊號參考,不代表任何獲利保證。實際交易前建議先進行充分測試,並搭配適當的資金與風險管理。
FREE

您是否曾经想过拥有一款能够扫描所有策略并同时显示该资产所有时间框架的买卖点的扫描仪? 这正是这款扫描仪所能做到的。该扫描仪旨在展示您在 Rule Plotter: 无需编程即可创建策略的策略生成器 中创建的买卖信号,并在此扫描仪中在不同的资产和时间框架上运行它们。 Rule Plotter的默认策略仅涉及牛市和熊市的蜡烛,这意味着如果您在Rule Plotter中没有绘制任何策略,该扫描仪将向您展示所选资产在所有时间框架上的蜡烛颜色,如果蜡烛为负则为红色,为正则为绿色。 创建您想要的任意策略 不要局限于默认策略,发挥您的创造力,构建传统策略,使用Metatrader中的所有可用指标。 或者,使用您喜欢的指标构建定制策略。 此扫描仪仅是Rule Plotter所提供的功能的冰山一角;它只是Rule Plotter的辅助工具。 然而,真正的魔力并不在这些工具上,因为它们只是为您 发挥创造力 的工具。 通过此扫描仪,您将全面了解您选择的所有资产的所有时间框架中您的策略的表现。 同时观察到所有指标同时发出信号将使您充满信心地进入操作,因为您将全面了解市场中其他参与者正在看到什么,从而大大降低错
FREE

欢迎使用 RSI Colored Candles,这是一个创新的指标,旨在通过将相对强弱指数(RSI)直接集成到您的价格图表中,来提升您的交易体验。与传统的 RSI 指标不同,RSI Colored Candles 使用四种颜色方案来表示 RSI 水平,直接显示在您的蜡烛图上,为您提供一目了然的有价值见解。 特点和优势: 节省空间设计: 告别杂乱的指标窗口!RSI Colored Candles 通过消除独立的 RSI 窗口的需求,节省宝贵的图表空间,为您提供更清晰和更简洁的交易体验。 超买和超卖区域的可视化表示: 在您的价格图表上轻松识别超买(由红色蜡烛表示)和超卖(由蓝色蜡烛表示)状态。这种视觉表示赋予您做出更好的交易决策并利用潜在的反转机会的能力。 增强的入场信号: 将颜色编码的蜡烛用作交易信号,蓝色蜡烛表示买入机会,红色蜡烛表示卖出机会。这种简单直接的方法简化了您的交易过程,并根据 RSI 条件提供清晰的入场点。 与供需区域的集成: 将 RSI Colored Candles 与供需分析相结合,进一步增强您的交易策略。通过在关键的供需区域识别 RSI 极端值,您可以最大程度地提
FREE
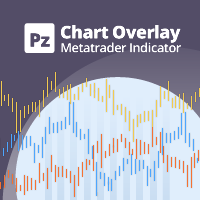
图表覆盖 指标在同一张图表上显示几种工具的价格走势,使您能够评估货币对相对彼此波动的差异。 [ 安装指南 | 更新指南 | 故障排除 | 常见问题 | 所有产品 ]
轻松找到超买或超卖的货币对 在同一图表上绘制最多六个货币对 必要时显示倒置符号 适应图表大小,缩放和时间表 自动价格水平计算 可定制的价格水平密度 可自定义的颜色和尺寸
什么是反向货币对? 反转货币对意味着显示两种货币之间的汇率,从而反转交易的主要货币。例如,如果要将EURUSD,GBPUSD和USDJPY绘制到同一覆盖图中,则有必要反转USDJPY以使价格反映反向汇率:JPYUSD。这样,日元/美元价格将与覆盖图的其他两个符号呈正相关关系移动,从而使图表更易于研究。
测试指标 该指标使用来自多个交易品种的价格数据绘制单个图表。由于MetaTrader 4测试仪(在撰写本文时)不支持多货币回溯测试,因此该指标无法回溯测试,因为它将不会收到来自其他本应覆盖的交易品种的报价。要测试它,请租用一个月。
输入 符号设置-键入要在覆盖图上显示的货币对或符号的名称。您需要至少输入其中之一,以便覆盖图具有两个货币对(本机和外
FREE

Enjoy the Free Candle Color indicator.
Kijun Sen is an element of Ichimoku Kinko Hyo Indicator, it's far too complicated for many traders hence they tend to be confused. We have simplified it so the Kijun Sen will change colors as it activates without the Tenkan Sen, Senkou Span, Up Kumo and Down Kumo. Customize to your period parameter and colors of your choice. Great for beginners and seasoned traders. Set your period and enjoy
GOOD LUCK and ALL THE BEST IN YOUR TRADING JOURNEY !!!!!
FREE

Fractals TrueFalse — это модифицированный индикатор фракталов, который расширяет классическую концепцию Билла Вильямса с помощью структурного анализа Price Action. Индикатор автоматически классифицирует каждый найденный экстремум на Истинный (True) и Ложный (False) .
——————————
• Фильтрация ложных сигналов: Анализирует внутреннюю структуру свечной формации по крайним барам паттерна.
• Наглядная визуализация:
• Голубые стрелки: Истинные фракталы (сильные уровни с подтвержденной структурой
FREE

Risk Line Calculator Risk Line Calculator 是一款简单轻量的 MetaTrader 5 风险和手数计算指标。 用户只需设置风险百分比,然后在图表上拖动 Stop Loss 线,指标就会根据当前价格与止损线之间的距离自动计算建议交易手数。 主要功能 可直接拖动的 Stop Loss 线 自动风险手数计算 用户自定义 Risk % 显示 Stop Loss 距离 显示账户货币风险金额 自动识别 BUY 或 SELL 方向 可使用 Balance、Equity 或 Free Margin 作为风险基础 读取当前交易品种的经纪商规格 自动考虑最小手数、最大手数和手数步长 支持外汇、贵金属、指数和 CFD 等品种 自动适应浅色和深色图表背景 简洁透明显示,不使用大型控制面板 使用方法 1. 在指标参数中设置所需的 Risk %。 2. 将红色 SL 线拖动到计划的止损位置。 3. 指标会立即更新建议手数和风险信息。 SL 在线位于当前价格下方时,方向显示为 BUY。 SL 在线位于当前价格上方时,方向显示为 SELL。 显示信息 RISK 1.00% LO
FREE

如果您在金融市场交易,那么您肯定知道点差有多重要——买入价(ask)和卖出价(bid)之间的差异会严重影响您的利润。 Spread Size 是一个简单但非常实用的指标,它直接在图表上显示当前点差。不再需要手动持续监控数据——一切尽在眼前! 为什么需要它?
点差不只是一个数字。它是您真实的资金。低点差意味着开仓和平仓的成本更低。高点差,尤其是在新闻发布或流动性低的时候,可能会“吞噬”您的一部分利润,甚至将盈利交易变成亏损交易。Spread Size 帮助您及时察觉这些情况。 它是如何工作的?
该指标以文本形式在图表上显示点差。但最方便的是,它会根据情况改变颜色: 绿色——点差低,可以安心交易。
红色——点差高,最好等待或重新检查条件。
颜色和触发阈值可以根据您的需求自定义。 还有什么用处?
节省时间——不需要频繁切换窗口。
帮助避免意外情况——例如,经纪商在新闻发布前突然扩大点差。
适合所有人:剥头皮交易者、日内交易者,甚至关注成本的投资者。 点差扩大的风险示例
假设您在正常时间以10点的点差开了一个EUR/USD的仓位。一切顺利,价格朝着您的方向移动。但突然发布了重要的美元新闻—
FREE

一条深达六层加权均线的线,它改变方向,而不是去穿越什么。Cascade WMA Trend MTF把六条加权移动均线串成一链,它们的周期像斐波那契数列那样增长,这让结果的平滑程度远远超过同样长度的单条均线所能达到的水平,而信号则取自成品线改变方向。任何图表上的任何上位时间周期,读取的只有已收盘的上位K线。它是免费的:没有试用期,没有锁定功能,没有升级页面。 六条加权移动均线串成一链,每一条都取自前一条的输出,而它们的周期由前两个相加得出。用出厂值三和五,就得到三、五、八、十三、二十一、三十四这一串。信号是成品线的方向改变,并没有什么去穿越什么。 六级加权造出一条极难被推动的线,这既是该方法的全部意义,也是它的全部代价。设置中的ATR周期只调整箭头画在距离它那根K线多远的位置,绝不触及转向本身。 图表上有什么 在价格窗口里绘制:按方向上色、跨越转向而不断开的级联线,以及方向改变那根K线上的BUY和SELL箭头。本产品没有通道,因此Styles选项卡提供的只有线条、它的粗细和箭头大小。 面板 价格图表上的画布面板,可拖动、可折叠、可关闭。它显示当前生效的时间周期,以及实际参与计算的设置数值
FREE

Green Red Sweep Candle by RWBTradeLab
A clean, non-repainting two-candle sweep detector for MetaTrader 5. It finds the moment a candle raids the far side of the one before it and then closes clean through the opposite side — the liquidity grab and the commitment, in the same candle. All from CLOSED candles only.
What This Indicator Does
Both candles of the pattern share the same colour. The second one first SWEEPS the far side of the first, and only then CLOSES beyond the opposite side, so i
FREE

VWAP Institutional Pro:真实价值地图 VWAP Institutional Pro 是识别市场公平价格的终极工具,让您能够参考与大型投资基金和高频算法相同的标准进行交易。该指标实时计算成交量加权平均价,揭示动态支撑和阻力的隐形水平,机构订单流通常在这些水平上做出精准反应。
配置参数指南 请使用 MetaTrader 面板中显示的相同名称调整您的策略:
TimeFrame VWap:定义锚定周期(日线、周线等),指标在此周期重新开始成交量和价格计算。 Show Line STD 1 a 5:用于激活或停用 5 条可用波动带的视觉开关。 STD 1 a 5:标准差带的自定义倍数;用于扩大或缩小机构超买和超卖区域。
视觉与操作解读 系统投影出一条中央平衡线 (VWAP) 和五个波动包络线。内线(STD 1 和 2)通常充当趋势延续区,而外线(STD 3 到 5)则标志着极端衰竭水平。当价格触及上轨或下轨并表现出拒收迹象时,会出现有效的反转信号,寻求回归中心价值。
优化与建议 资产:指数(纳斯达克、德指 DAX)、黄金 (XAUUSD) 和主要货币对。 时间周期
FREE
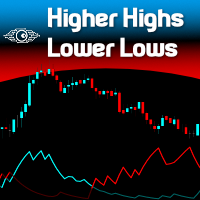
"Spotting emerging trends, defining correction periods, and anticipating reversals can benefit your trading in many ways..." So be it: Higher Highs & Lower Lows indicator. This is an indicator created by Vitali Apirine and presented to the public through the article "Time To Buy. Time to Sell - It's a Stochastic, Higher Highs & Lower Lows" in the Stocks & Commodities magazine . This is a Momentum indicator that helps determine the direction of a trend. Higher Highs and Lower Lows are two indicat
FREE

Advanced Gold Scalping Signal Indicator XAU M1 Trend Pro is a precision-built trend and signal indicator designed specifically for XAUUSD (Gold) on the M1 timeframe . It combines multi-layer filtering, volatility analysis, and smart scoring logic to deliver high-quality BUY and SELL signals while avoiding market noise. Built for traders who demand accuracy, speed, and consistency in fast-moving gold markets. Key Features Smart Buy & Sell Signals
Generates real-time alerts when high-probabili
FREE

Fractal3K Pro – 高精度顶底分型指标 简短描述:
Fractal3K Pro 是一款基于三K分型结构设计的专业交易指标,可自动识别市场顶分型和底分型,提供买卖信号的可视化提示,适合短线与中长线交易。 完整描述:
Fractal3K Pro 是一款专为捕捉市场关键反转点而开发的高精度顶底分型指标,基于三根K线分型结构,可自动识别顶分型(卖出信号)与底分型(买入信号)。指标提供可选严格模式(Strict Mode),有效过滤震荡市场的噪音,提高信号可靠性。同时支持D线触发模式,使信号在非重绘条件下更加稳定,适合结合EA自动交易使用。图表上使用红色和蓝色箭头直观显示买卖点,用户无需手动判断即可清晰捕捉交易机会。Fractal3K Pro 适用于黄金(XAUUSD)、外汇、指数以及加密货币市场,可帮助交易者优化入场与出场时机,提高交易决策的准确性与效率。该指标界面简洁,操作方便,适合新手和专业交易者使用,是一款功能全面、稳定可靠的专业交易工具。 功能亮点: 自动识别顶分型与底分型 可选严格模式,过滤震荡信号 可选D线触发模式,信号无重绘 图表上箭头提示买卖点 支持黄金、外汇、
FREE

Stop Switching Timeframes! Are you tired of constantly clicking back and forth between timeframes just to check key levels? Sniper Multi-SR is the ultimate multi-timeframe dashboard designed for traders who demand precision, clarity, and speed. This indicator plots critical Support and Resistance levels from your selected timeframes directly onto your active chart. It gives you a "Sniper's View" of the market, allowing you to identify institutional-grade levels at a glance without cluttering you
FREE
具有多时间框架支持、可自定义视觉信号和可配置警报系统的OsMA(MACD柱状图)指标。
自由职业编程服务、更新和其他TrueTL产品可在我的 MQL5主页 获取。
非常欢迎您的反馈和评价!
什么是OsMA? OsMA(移动平均振荡器)是MACD与其信号线之间的差值,也称为MACD柱状图。正值表示MACD位于信号线上方(看涨动量),负值表示MACD位于信号线下方(看跌动量)。零线穿越对应MACD/信号穿越,标志着潜在的趋势转变。增长的柱体显示动量增强,缩小的柱体显示动量减弱。 OsMA信号在零线穿越(趋势转变)、OsMA与价格之间出现背离以及检测到柱状图峰谷时生成。该指标帮助交易者高精度地测量动量运动的强度和方向。 功能特点: 带箭头和垂直线的视觉信号标记 三个独立信号缓冲区,具有可配置触发器 信号检测选项:方向变化、级别穿越、峰/谷 每个信号可配置警报(电子邮件、推送、声音、弹出窗口) 具有插值方法的多时间框架(MTF) 柱状图或折线图显示模式 多种颜色模式(单色、基于方向、基于级别) 通过iCustom访问缓冲区,可与专家顾问(EA)集成 输入参数: 基本设置: 快速EMA周期
FREE

Gatotkaca Support Resistance Trendline Indicator is a simple indicator that detects support, resistance and trendlines. It will helps you find breakout momentum based on lines calculated by this indicator. This is conceptually based on fractals, but with customizable periods. Compatible for any timeframes. You can customize how this indicator work by setting up the period input.
FREE
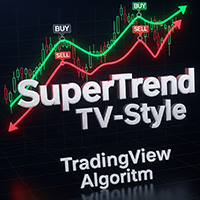
SuperTrend TV-Style replicates the classic SuperTrend indicator from TradingView, now available for MetaTrader. It uses ATR-based volatility to detect trend direction and plot dynamic buy/sell zones on the chart. Green line: uptrend Red line: downtrend Arrows: buy/sell signals at trend shifts Customizable source price (HL2, HLC3, etc.) and ATR method Simple, fast, and familiar - ideal for traders switching from TradingView or looking for a clean trend-following tool.
FREE

Short Description Yesterday H/L, Today H/L and ADR% on any chart. Color-coded gradient signals overextension at a glance. Full Description Mattrix Day Levels is a clean, lightweight indicator that displays the four key reference levels every day trader needs: Yesterday High and Low (YH, YL) Today High and Low (TH, TL) Average Daily Range percentage (ADR%) Drawn directly on the chart, the indicator marks the current trading day's progression against its historical range. The today range is shown
FREE

持 仓 监 控 面板 我在 自己 的 真实 交易 中 使用 这 款 指标。 我 不仅 希望 展示 交易 结果, 也 希望 让 大家 了解 我在 实际 市场 交易 中 使用 的 工具。 您 可以 在 MQL5 Signals 中 查看 我的 交易 历史、 未 平 仓 和 已 平 仓 交易, 以及 真实 交易 账户 的 统计 数据。 我的 真实 交易 账户: https://www.mql5.com/ru/signals/2385035?source=Site +Signals+My 这 款 指标 有 什么 用途? 当 同时 管理 同一 交易 品种 的 多个 仓 位 时, 了解 整体 持 仓 结构 非常 重要, 包括 Buy 和 Sell 的 总 手数、 净 敞口、 平均 价格, 以及 在 指定 亏损 限 额 下 可能 对应 的 价格 变动。 该 指标 将 这些 参数 整合 到 一个 信息 面板 中, 帮助 您 监 控 当前 持 仓 结构, 并 将 计算 出 的 价格 水平 与 当前 市场 价格 及 Equity 的 变化 进行 对比。 主要 功能 1. 计算 回 撤 价格 水平 指
FREE

If you heard about The Wyckoff Method, Volume Spread Analysis, etc... You are probably searching for the candlestick indicator that shows you the Volume spread all over the current bar, signaling every types of market status... You can control the several Market Levels with custom colors...
It is up to you to decide how to use it. Our job is provide you with the indicator...
If you like this indicator, all I am asking is a little Review (not a Comment, but a REVIEW! )... This will mean A LO
FREE
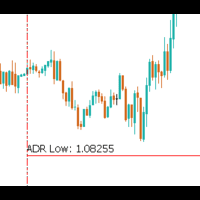
The Average Daily Range (ADR) is a powerful tool for traders, especially those focused on intraday and scalping strategies. It provides valuable insights into the expected price movement for the day and how price action is behaving relative to historical trends. The ADR indicator shows the following key information: Today's ADR : The typical range of price movement for the current trading day, based on historical data. 3x Today's ADR : Three times the current ADR, showing potential price moveme
FREE

用三种颜色查看每根K线的波动率对这个市场来说是低、中还是高。No repaint。
任何货币对、任何周期、任何市场。2分钟即可加载到您的图表。可在策略测试器(Strategy Tester)中免费测试。
Get more indicators here
Baselines, volatility filters and oscillators. No repaint.
为什么您需要它 同样的波幅在不同市场、不同时间含义不同。您看着最后一根K线,却无法判断它的波幅对当前这个市场来说是大还是小。手动设置的固定平均真实波幅(ATR)水平,一旦波动率变化就会过时。您在平静的市场和快速的市场里放同样的止损,市场会让您为这个差别付出代价。 您将获得 Fabii Atr Volatility Zones 按波动率区间给每根K线着色,让您不再凭肉眼判断行情的大小。 三个区间三种颜色,灰色代表低波动,黄色代表中波动,绿色代表高波动,一眼读懂市场。 区间来自市场自身历史的滚动百分位,您无需手动设置水平,同一套参数适用于任何货币对、指数、金属、加密货币或股票。 每根K线的波幅除以快慢两条ATR基准之和
FREE
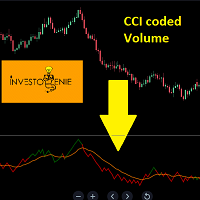
The Indicator is based on Commodity Channel Index (CCI) coded on Volume. The concept is to try and analyze the movement of Volume and Price in a certain direction
Concept:
If the Price of the indicator moves below the threshold price, it turns RED indicating the direction downwards is getting strong.
If the Price of the indicator moves above the threshold price, it turns GREEN indicating the direction upwards is getting strong.
The moving average acts as a great filter to decide entry/exit poi
FREE

MTF RSI Candles on Current Chart MT5 Non-repainting multi timeframe RSI candle colouring Overview
MTF RSI Candles colours the candles on your chart using the RSI of a higher timeframe.
You keep working on the timeframe you normally trade. In the background the indicator watches RSI on a higher timeframe you choose. When that higher timeframe closes a candle, the RSI is read once and the colour is set: • MTF candle RSI closed above the level – Current chart candles turn the Buy colour. •
FREE
This indicator provides a clear, at-a-glance dashboard for monitoring both the Relative Strength Index (RSI) and Stochastic Oscillator on any instrument or timeframe.
Whenever both RSI and Stochastic %K simultaneously exceed their respective overbought or oversold levels, the indicator displays an arrow signal in the indicator window.
These signals highlight strong momentum and can help traders quickly identify high-probability reversal zones. As with all my free tools, the arrow symbol can be e
FREE

The Stochastic RSI (StochRSI) is a technical indicator that combines the characteristics of the Relative Strength Index (RSI) with the Stochastic Oscillator, resulting in a more sensitive tool that generates a higher number of trading signals. Developed by Tushar Chande and Stanley Kroll, the indicator was designed to overcome a perceived limitation of the traditional RSI: the low frequency of overbought and oversold levels activation (commonly 80 and 20), especially in less volatile assets. Ho
FREE

Dow+ICT AI Visualizer | 连接AI大脑的钥匙 自动生成道氏拐点数据,让AI帮你分析市场——你的AI交易助理的数据接口
Dow+ICT AI Visualizer 不只是画线工具,更是“数据生成器”:
多品种支持,贵金属(XAU,XAG),原油(XBR,XTI),股指(US500,US100),外汇(EUR,GPD,CHF,JPY,AUD,CAD), 加密货币(BTC,ETH)
多周期支持,M5-M15-M30-H1-H4
自动生成道氏拐点数据(HH/HL/LL/LH序列)
自动整理K线数据(OHLC)
实时更新,保存到数据文件夹
TXT格式直接拷贝贴给AI 您的AI很聪明,但它需要有效的数据 ,
→ 你只需要在你的AI界面新开一个话题并贴入我们设计的提示词,
→ 然后不断更新最新的数据给它,你的AI就能基于道氏结构+ICT策略规则,分析出日内进场点,
这不是“看图说话”,这是“让AI真正理解市场”。
数据存放位置说明 :
您的MT5(桌面版)界面菜单"文件->数据文件夹" 或者快捷方式 "Ctrl+Shift+D"。打开后,继续进
FREE

This is a simple Volume Weighted Average Price (VWAP) indicator. Simply add it to the chart and adjust the vertical line that is used as start anchor point and it is done.
Volume Weighted Average Price (VWAP) is a trading benchmark that represents the average price a security has traded at throughout the day, based on both volume and price. It is calculated as the sum of price times volume for each trade, divided by total volume.
FREE

Fibo Zones Manual — Manual Fibonacci with Buy/SL/TP Zones
Fibo Zones Manual is a fully manual Fibonacci tool — drag the two points to your swing high/low, exactly like the native MT5 Fibonacci retracement. On top of it, the indicator draws three colored zones directly on the chart: entry zone (Buy/Sell), SL zone, and TP zone, each with the exact price displayed.
Key Features
• Manual placement, drag-and-drop like the native tool • Colored zones (entry, SL, TP), fully adjustable • Price and pe
FREE

Moving Average ATR Channel Experimental indicator that constructs a dynamic price channel around a Moving Average by applying Average True Range multiples. The channel consists of an inner and outer boundary on both the upper and lower side of the moving average, creating a visual “tunnel” that expands and contracts with market volatility. Default parameter values are completely untested and are not derived from any back-tested strategy, statistical study, or recommended trading system. They se
FREE

在图表上显示前一日最高价、最低价、收盘价、交易时段开盘跳空和开盘区间,适用于指数、黄金、外汇和加密货币。
描述: Session Levels Ultimate 在任何品种的图表上直接绘制日内交易者每天关注的价位。 - 前一日最高价、最低价和收盘价 - 交易时段开盘线(默认服务器时间 16:30,即 GMT+2 / GMT+3 服务器上的美股开盘) - 时段开盘跳空:以价格和日 ATR 倍数显示,向上为绿色,向下为红色 - 时段开盘区间(默认前 60 分钟),以方框显示 跳空超过设定大小时在开盘提醒,可选手机推送。 时间为经纪商服务器时间:美股 16:30,法兰克福或伦敦 10:00,东京 02:00(GMT+2 / GMT+3 服务器),或您交易的任何时段。适用于指数、黄金、外汇、加密货币和股票,H1 及以下周期。 自动交易美股开盘:Index Bender EA https://www.mql5.com/en/market/product/200096
FREE
MetaTrader市场是独有的自动交易和技术指标商店。
阅读MQL5.community用户备忘更多地了解我们提供给交易者的独特的服务:复制交易信号,自由职业者开发的自定义应用程序,通过支付系统完成的自动付款和MQL5云网络。
