 MetaTrader 5
 专家
 指标
 程序库
 实用工具
 窗口小部件
 规则
适用于MetaTrader 5的免费技术指标 - 50
 技术指标的信号外汇和股票市场的开仓交易和平仓交易起着至关重要的作用。指标的本质就是一种交易品种的数学转换,旨在预测未来的价格变化。
测试技术指标可以更有利于预测市场行为并从中获利。
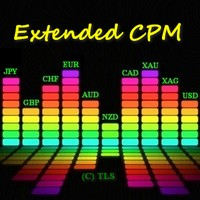
该算法基于货币功率计指标的思想。在此版本中,显示值的数量不受限制,其代码更加紧凑和快速,可以通过指标缓冲区获取当前柱的值。 指标显示的内容 :货币前的细条带和上方数字显示最近 N 小时的相对强弱指数(N 在变量“小时”的参数中设置),较宽的条带显示每日指数。您在输入参数中指定的使用该货币的货币对越多(假设您的经纪商为这些货币对提供报价),该指数的权重就越大(但要小心“非主要”或外来货币对,它们可以扭曲整体画面)。例如,如果您只指定了 EURUSD,则欧元的相对指数将仅基于此对计算,如果您添加 EURGBP,则欧元指数将基于两个对计算并获得更加权的值。 如何使用数据 :在没有重要新闻的情况下,指数值越低/越高,技术修正或趋势延续的可能性就越大。
FREE

Stochastic Signal Pro MTF – L'Indicateur Ultime pour des Signaux Précis et Multi-Timeframes ! Pourquoi Choisir Stochastic Signal Pro MTF ? Stochastic Signal Pro MTF est un indicateur professionnel et innovant conçu pour les traders qui recherchent des signaux fiables basés sur l'indicateur Stochastique, validés sur plusieurs timeframes . Que vous soyez un scalper, day trader ou swing trader , cet outil vous offre une analyse complète et visuelle pour prendre des décisions éclairées.
FREE

Wormhole 时间框架指标对于 MetaTrader 5 (MT5) 不仅仅是另一个交易工具——它是您在金融市场中的竞争优势。它专为初学者和专业交易者设计,Wormhole 改变了您分析数据和做出决策的方式,确保您始终领先一步。 为什么您需要(免费)Wormhole 指标 超越竞争对手: 能够在同一图表上同时查看两个时间框架意味着您总是领先一步。再也不用在图表之间切换,一切所需尽在眼前。 解锁隐藏的机会: 通过改变传统的时间框架,发现其他交易者忽略的模式,将 5 分钟图表的边界从 00:00 到 00:05 调整为 00:01 到 00:06。这些微小的变化可能揭示独特的市场动态。 获得可操作的洞察: 使用精确的工具检测趋势、反转和支撑/阻力水平,Wormhole 为您提供信心,使您能够做出明智的交易决策。 经过验证的创新 Wormhole 并非凭空猜测,而是先进研究的成果: 使用机器学习分析市场低效性。 识别零售交易群体,揭示隐藏的市场动态。 这些见解推动了该指标的开发,体现了专业级策略。 Wormhole 如何赋能您 更快的决策: 实时数据使您领先市场动态。 终极多样性: 无论
FREE

UZFX 现代K线计时器数字时钟 v1.0
专为MetaTrader 5设计的、具备现代数字界面的专业倒计时器
UZFX现代K线计时器数字时钟将提升您的交易体验。这款简洁、精准且功能强大的指标专为重视图表清晰度与专业性的严肃交易者设计。
主要功能: 精准K线倒计时:实时显示当前K线收盘前的剩余时间,采用大号易读的数字格式(时:分)。 动态进度条:通过色彩编码的警报直观展示K线进展,随着K线接近结束,颜色将从绿色变为橙色,最终变为红色。 全面的市场信息:一目了然地显示当前交易品种、时间周期和实时点差。 浮动盈亏面板:监控并显示持仓的总浮动盈亏,采用清晰的正负色标区分。 专业日期显示:完整的工作日和日期信息,提升图表可读性。 现代且可自定义的用户界面:七种优雅主题,包括 UZFX 标志、青柠、水蓝、金、棕、灰和石板灰。 灵活定位:支持将时钟放置于左上、顶部中央、右上、左下或右下位置,并可调节 X 和 Y 偏移量。 性能优化:轻量级代码确保运行流畅,专业排版呈现高端视觉效果。 该指标非常适合短线交易者、日内交易者以及任何需要精准时间点来执行基于K线策略的交易者。简洁现代的设计确保其能完
FREE

Cobalt 高级支撑与阻力 (S&R) 指标 您的专业支撑/阻力位与突破辅助工具,在不干扰图表的情况下精准捕捉最佳价格走势。 您是否厌倦了那些在图表上充斥着凌乱垂直线的复杂指标? Cobalt Advanced S&R 采用 Bill Williams 经典的碎形 (Fractal) 逻辑,自动识别最关键的支撑位和阻力位。其“经典点状”设计让您在参考历史价位时不会感到视觉疲劳,并能与其他指标完美协同工作。 与普通 S&R 工具不同,这款由 Cobaltsw 研发的指标拥有经过优化的系统架构,不仅不会过度占用 CPU,还内置了“交易量过滤器” (Volume Filter) 以防止虚假突破 (Whipsaws)。 核心功能 清爽经典的视觉效果: 将支撑和阻力位显示为优雅的点(菱形),而不是切开屏幕的连续线。让您在实时行情中更清晰地观察历史 S&R 密集区,告别视觉噪声。 高性能引擎: 不同于每个 Tick 都要扫描完整历史记录的冗余代码,本指标的优化架构仅计算新进入的数据。这确保了零 CPU 过载,即使同时开启多个图表也能流畅运行。 智能交易量过滤器 (Smart Volu
FREE

BarionQuant MACD Color Lite displays a custom four-color MACD histogram that makes momentum shifts easy to read at a glance. DIF and DEF lines are included; divergence detection is reserved for the paid Divergence Pro edition. HOW IT WORKS DIF = Fast EMA(12) minus Slow EMA(26) DEF = Smoothed signal line of DIF Energy = (DIF − DEF) × 2, split into four histogram colors: Above zero, lengthening → red (momentum building) Above zero, shortening → aqua (momentum fading) Below zero, lengthening → gree
FREE
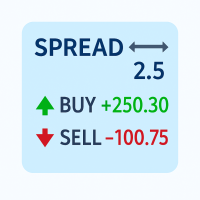
Track your spread and all position PnLs (Buy & Sell) in real-time – stay in control of your trades at a glance!
Features: Real-time spread display (in pips) Total Buy position PnL Total Sell position PnL Clean, non-intrusive display layout Works with all symbols and timeframes Perfect for: Scalpers needing quick spread awareness Day traders monitoring long/short performance Risk managers optimizing exposure No need to switch tabs or rely on external tools — everything you need is visible at
FREE

KS 双线超短线指标 (KS Double Line Scalp)
这是一个融合了双重移动平均线的指标,主要设计用于在低时间周期图表上进行超短线交易(Scalping)。它结合了两种平滑技术:
KS TEMA(三重指数移动平均线)
KSMA
其目标是通过同时显示这两条线,提供一种清晰且低滞后的趋势方向与动量视图;这使得交易者能够在两条线发生交互时,识别出高胜率的超短线交易入场机会。
核心组件
组件 | 类型 | 默认值 | 用途
TEMA 周期 | 三重指数移动平均线 (Triple EMA) | 9 | 快速、灵敏的趋势线,有效降低滞后性
KSMA 周期 | 基于 ALMA | 9 | 平滑、锐利的趋势线
Offset(偏移量) | ALMA 参数 | 0.85 | 控制平滑度(接近 1 时更平滑)与灵敏度(接近 0 时更灵敏)之间的平衡
Sigma(标准差) | ALMA 参数 | 6.0 | 控制指标的“锐利度”/高斯滤波器的宽度
主要特性
1. 双线系统
蓝色线 (TEMA):响应更灵敏,对价格变化的反应速度更快。
宝蓝色线 (KSMA):得益于 A
FREE

UZFX FTMO Guardian PRO 是一款专业的 MetaTrader 5 账户监控指标,旨在帮助交易者安全地完成 FTMO 挑战,并自信地管理受托账户。
与专家顾问不同,该工具不会执行、修改或平仓交易。它作为实时交易助手,在您进行手动交易时持续监控您的账户,并计算每一项重要的 FTMO 规则。
仪表盘将所有关键账户统计数据集中展示,包括余额、净值、浮动盈亏、已平仓盈利、日盈利、总盈利、当前回撤、剩余回撤、盈利目标进度、交易天数以及整体挑战健康状况。
该指标自动支持:
FTMO 两步标准模式 FTMO 两步波动模式 FTMO 一步挑战模式 它持续计算:
日回撤 最大回撤 静态回撤 追踪回撤(1步挑战) 盈利目标进度 剩余所需盈利 剩余每日亏损容许值 剩余最大回撤 已完成交易日 当前挑战状态 智能预警系统会在违规发生前提供实时通知。当交易者接近每日回撤限额、最大回撤限额、盈利目标或出现危险的浮亏时,系统会发出警报,使其能在违反挑战规则前采取行动。
仪表盘还提供了重要 FTMO 交易条件的快速参考,包括:
新闻交易规则 周末持仓规则 隔夜持仓规则 一致性要求 当前挑
FREE

GOLD SecScope AI is an ultra‑lightweight, real‑time micro‑analysis tool designed exclusively for GOLD (XAUUSD). It internally generates 1‑second candles and displays an AI‑calculated micro‑momentum score inside a compact floating window.
The window can be freely dragged by double‑clicking, allowing you to place it anywhere on your chart.
This tool does not perform automated trading or generate signals. It is a visual assistant designed for scalpers.
--------------------------------------
FREE

RiskCockpit - real-time risk advisor for prop-firm and funded accounts (FundedNext, FTMO, E8, The5ers, MyFundedFX) and personal/demo accounts. It is an INDICATOR (an advisor): it shows and proposes; it never opens, modifies or closes a trade.
THE PROBLEM IT SOLVES
Funded accounts are rarely lost to a bad strategy - they are lost to a single careless click: one lot too big, a stop-loss left off, a trade inside a news window, a daily-loss line crossed by accident. The rules sit in a PDF; your ris
FREE

CandleScope Pro Demo – Candlestick Pattern Indicator CandleScope Pro Demo is a powerful and easy-to-use indicator for MetaTrader 5 that automatically detects and labels the most popular candlestick patterns directly on your chart. This tool is designed to help traders of all levels quickly identify key reversal and continuation signals, improving decision-making and trading accuracy. Key Features: Automatic Detection: Instantly scans and highlights the following candlestick patterns: Doji Spin
FREE

The TrendOscillator Indicator is an upgraded version of the traditional Stochastic Oscillator. It comprises two lines: %K and %D. The %K line represents the current market position. In contrast, the %D line is a moving average of the %K line used to generate signals and identify potential entry or exit points. The good thing is the indicator works on all timeframes like the traditional Stochastic. However, to avoid any false signals, applying the indicator on longer timeframes is better
FREE

Zigzag Indicator For RSI, To easily identify the highs and lows of the rsi signal. It is easier to observe divergent and convergent signals. Default setting: InpRsi =14 //Rsi Period InpDepth =12; // Depth InpDeviation =5; // Deviation InpBackstep =3; // Back Step
If you want open Exness account try this link : https://one.exness-track.com/a/teg5teg5 Dev buy taphu: Ha Van Tan - hatatrata - Trader's profile - MQL5 community Email: tan.ha@outlook.com
FREE

Product name: Varynex RSI RegimePulse Matrix
Short marketing headline: Adaptive RSI momentum context with trend regime, volatility-aware zones and confirmed divergence mapping.
Overview: Varynex RSI RegimePulse Matrix is a professional momentum-context indicator for MetaTrader 5. It is built around RSI, but it does not behave like a basic overbought/oversold oscillator or a simple arrow signal tool. The indicator combines smoothed RSI momentum, an RSI signal line, adaptive volatility zones, t
FREE

Below is a fully rewritten, compliant description ready to paste into your MQL5 listing.
---
### Product Description (Copy & Paste)
**SMC Fair Value Gap (FVG) Scanner with Displacement Engine** is a MetaTrader 5 technical indicator designed to identify, filter, and track imbalances using Smart Money Concepts (SMC) price-delivery mechanics.
Standard FVG tools plot every minor gap across all market conditions, creating excessive noise during consolidation. This indicator introduces a multi-
FREE
The indicator looks for the "Fifth dimension" trade signals and marks them on the chart. A detailed description of the chart patterns that generate the trade signals can be found in Chapter 8 "The Balance Line Trades" in the book Williams' "New Trading Dimensions". Signal levels with indication of the position entry or stop loss placement price are indicated directly on the chart. This feature creates additional convenience for the trader when placing pending orders. A solid horizontal line is d
FREE

Hi there! Since I am starting commercial and non-commercial product publishing I would highly appreciate: If you like this product, please rate it. That will help to promote not only this product, but indirectly another ones. So, such promotion will help to make some money from commercial products. Thus, I will have opportunity to fund my another directions of trading researches like bot development using mql4 and mql5 programming languages as well as python written products like crypto bots. If
FREE

The indicator shows your profit and loss (PnL) for the current day right on your trading chart. Anchored at the top-right corner, it displays "PnL: [amount]"—green if you’re up, red if you’re down, white if it’s zero. Every time you close a trade, it updates instantly, adding up your profits, commissions, and swaps from all buys and sells trades since midnight. No fuss, no extra charts—just real-time feedback on how your day’s going.
FREE
SizeInPips Indicator – Visualize Candle Size with Ease!
Unlock the power of price action analysis with the SizeInPips Indicator ! This simple yet powerful tool is designed for traders who want to quickly measure and visualize the size of each candle (bar) in pips, helping you make informed trading decisions with confidence. Whether you're a beginner or an experienced trader, SizeInPips is the perfect addition to your MetaTrader 5 toolkit.
What Does It Do? The SizeInPips Indicator calculates
FREE

A dynamic Fibonacci trend envelope indicator for identifying structured pullback zones inside active market trends. Golden Pocket Indicator by Pricewerk is a MetaTrader 5 indicator designed to help traders analyze trend direction, pullback depth and important Fibonacci retracement zones directly on the chart.Instead of manually drawing static Fibonacci levels, the indicator builds a dynamic ATR-based trend envelope and calculates key Fibonacci levels inside the current trend structure.The main f
FREE

http://www.tradepositive.lat
ALGO Smart Flow Structure Indicator The ALGO Smart Flow Structure Indicator is designed for serious traders who use objective Market structure. Forget noise and slow indicators; this tool provides you with a crystal-clear, unambiguous view of structural breakouts across all timeframes. Based on the rigorous rules of the ALGO Smart Flow methodology, the indicator filters out internal structure and only shows you the Major Structural Points (Swing Points) , ensuri
FREE
Purpose DG DayInfo is a free indicator that shows information about: Day's maximum prices; Day's minimum prices; Day's percentual variations; Daily candle direction (Up, Down or Flat); Candle timer; This way, DG DayInfo helps you to see day's maximum and minimum, check day's percentual variation and time left to close candle.
Key features Designed to be simple to use, with a few parameters Works in ALL pairs Works within ALL time frames*
Main Indicator Parameters Days - Set to how many days yo
FREE
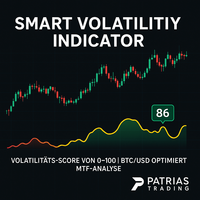
Smart Volatility Indicator – Precise Volatility Detection for MetaTrader 5 The Smart Volatility Indicator is an innovative tool for accurately measuring market volatility – specifically developed for MetaTrader 5. It combines candle range, wick ratios, and smart filtering logic into a clear, scalable volatility score from 0 to 100 . Perfect for traders who want to respond to breakouts, trend dynamics, or consolidating markets – manually or via Expert Advisors (EAs). Key Features Smart Volatility
FREE
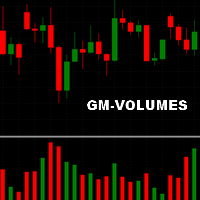
A simple volume indicator according to the color of the candle!
- Custom background!
- Supports Volume by Ticks or Real Volume.
The original Metatrader Volume indicator does not show the colors of the bar according to the color of the Candle, it only changes color when the volume of a candle is greater than the previous one, this sometimes creates confusion for beginners and does not know the real reason for the color change.
Free indicator, support may take a while to respond!
FREE

本指标绘制 力度指数(Force Index) —— 即每根 K 线的价格变动乘以其成交量 —— 并将其置于自适应的标准差通道之中。价格本身只能告诉您市场移动了,而力度指数告诉您推动这次移动付出了多大的力气。 成交量稀薄下的大幅价格变动,与成交量沉重下的小幅变动,是截然不同的两件事,即便 K 线看起来相似。力度指数把两者合并为一个数值来加以区分,而通道则将这个数值放入该品种自身近期表现的背景中。 工作原理 对每根 K 线而言,原始力度指数等于当前收盘价与前一根收盘价之差,再乘以该 K 线的成交量。收盘走高时为正值,走低时为负值,其大小则随成交量而缩放。默认使用 Tick 成交量;当经纪商提供真实成交量时会自动采用。 随后,该原始序列会按您选择的周期与均线算法进行平滑处理。平滑在这里十分关键:未经平滑的力度指数噪声极大,而您所选的周期决定了您观察的是短期力度,还是一段长得多的波动。 接着在平滑后的序列上计算 20 周期基准线及其标准差,上下通道按所选的标准差倍数绘制。由于通道由序列自身的变动性构建,因此在力度变得不稳定时扩张,在其趋于平稳时收缩。 通道为何重要 力度指数随成交量缩放,因此
FREE
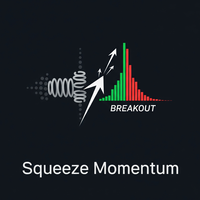
1. Introduction The Squeeze Momentum Plus is a powerful technical analysis tool designed to help traders identify periods of low market volatility (the "squeeze" phase) and assess the direction and strength of price momentum . This indicator combines the principles of Bollinger Bands and Keltner Channels to detect changes in market volatility, along with a momentum oscillator to measure buying/selling pressure. 2. Key Components of the Indicator The Squeeze Momentum Plus is displayed in a separa
FREE

Support Resistance Channel MT5 The Support Resistance Channel MT5 indicator plots dynamic support and resistance levels based on a configurable lookback period, displaying them as green and red lines respectively. It optionally shows goldenrod-colored arrows when price touches these levels, indicating potential trend changes (not explicit buy/sell signals) , along with customizable "RES" and "SUP" labels. With adjustable parameters like lookback period, arrow size, and label offset, it offers t
FREE
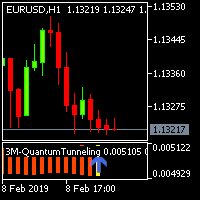
There is a science, named Quantitative Finance, that allows to study the financial derivative pricing models using the methods of theoretical and mathematical physics.
Lately I came across a paper that describes a new indicator for technical analysis that combines ideas from quantum physics and brings them to finance. I got interested in it and decided I would teach how to implement indicators based on a scientific papers in MQL5.
The original Moving Mini-Max paper [2] is written by Z.K. Silaga
FREE

KMF EMA Zone is a trend visualization and pullback signal indicator built by Kingdom Minded Financier (KMF).
HOW IT WORKS: The indicator draws a colored zone between EMA 20 and EMA 50 on your chart. When the market is in an uptrend, the zone fills GREEN. When the market is in a downtrend, the zone fills RED. This gives you instant visual clarity on market direction at a glance.
ENTRY SIGNALS: - Green up arrow: Bullish pullback signal - price pulled back into the EMA zone in an uptrend and a b
FREE
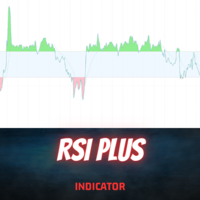
Introduction
The RSI Plus is an innovative technical analysis tool designed to measure the strength and direction of the market trend. Unlike the traditional RSI indicator, the RSI Plus boasts a distinctive ability to adapt and respond to market volatility, while still minimizing the effects of minor, short-term market fluctuations.
Signal
Buy when the RSI plus has been in the oversold (red) zone some time and it crosses above the 20 level on previous candle close
Sell when the RSI plus ha
FREE
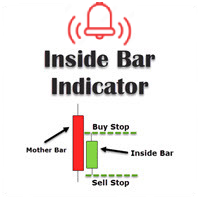
This inside bar indicator MT5 is suitable if you are doing inside bar trading. So what this MT5 inside bar indicator does is identifies inside bars for you as they form on your charts. Inside bar is a famous trading pattern in which the bar carry higher low and lower high compared with the previous bar, also known as mother bar. With, a lesser time frame like the 1 hour chart, daily inside bar chart will sometimes appears to be similar to a triangle pattern.
Inputs Settings for MA; AlertOn
FREE

ADR ST Patterns Strategy is a modification of the classical ADR indicator. This simple indicator corresponds to the parameters specified in the ST Patterns Strategy ( https://stpatterns.com/ ) . Structural Target Patterns represents the market consistently divided into components. No trend lines, geometric proportions of the model itself, trading volume, or open market interest are needed for the formation of ST Patterns . They are easily recognized and built only on the basis of breaking
FREE

Fusion Range MTF The Ultimate Multi-Timeframe Confluence Cockpit. Introduction The biggest challenge for any trader is not finding a signal, but confirming its validity across multiple timeframes. Fusion Range MTF is an advanced structural analysis dashboard that merges the power of the ZigZag (Classic & PSAR modes) with a high-end Visual Gauge System for 10 simultaneous timeframes (from Monthly down to 15M). How Does It Work? The indicator calculates an "Institutional Range" in real
FREE

AE-VWAP with Rejection Bands for Daily/ Weekly / Monthly AE-VWAP is a professional custom indicator that helps you evaluate the fair price of an instrument based on trading volume. The calculation is based on VWAP (Volume Weighted Average Price), a volume—weighted average price that is widely used in intraday and medium-term analysis.
Unlike regular moving averages, VWAP takes into account not only the price, but also the volume, giving more weight to those levels where the main trading activi
FREE
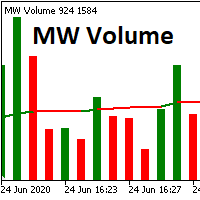
The Martinware Volume indicator plots a colored moving average over volume bars. The coloring uses three colors and can be done in different ways choosable by the user and is applied both to the average as to the volume bars.
Three types of coloring are possible: None: no coloring is done Increasing or decreasing: changes the color depending on the current value being bigger or lesser than the previous one Volume relative to average: colors vary if the current volume is bigger or lesser then
FREE

>> Announcements Channel << DiverX is a powerful and versatile divergence indicator developed for the MetaTrader 5 platform. It detects both Regular and Hidden Divergences based on five popular technical indicators: RSI (Relative Strength Index) , RVI (Relative Vigor Index) , Stochastic Oscillator, CCI (Commodity Channel Index) , and MACD (Moving Average Convergence Divergence) and ATR Plus (author’s proprietary indicator, product page >> ) . The indicator plots results directly on the main c
FREE

True Move A/D
资金流层面的解读。一条线。三个组合信号。 标准 Chaikin 累积/派发线只使用一个因素 —— 收盘价位于K线波幅内的位置。True Move A/D 使用三个因素,并按其实际可靠性加权。 复合公式: K = 0.10 × 价格流 + 0.10 × 中点偏差 + 0.70 × 收盘-收盘方向 将 70% 的权重赋予收盘-收盘动量是经过深思熟虑的。一根K线收盘价相对于开盘价的位置,是跨K线最真实方向性承诺的最一致信号。两个K线内部成分增添细节,而不会淹没主要信号。 所有数据均按前一根K线的加权平均价进行标准化 —— 使该指标跨品种、跨时间框架保持一致,防止大波幅K线仅凭规模就主导结果。 与现有 A/D 指标的区别: 标准 Chaikin A/D 完全忽略收盘-收盘关系
OBV 仅使用方向,无幅度
PVT 使用百分比变化,但无K线内部位置
True Move A/D 将三者结合为单一原则性复合指标 背离是主要信号。当 True Move A/D 上升而价格横盘或下跌时,真实的买方压力正在积聚。当该线走平而价格创出新高时,信念正在图表确认之前消退。 与
FREE

Full Description Overview
The Quad Hull Moving Average Trend Visualizer is a sophisticated trend-following tool that plots four independent Hull Moving Average (HMA) lines on a single chart. The Hull Moving Average is world-renowned in the trading community for its unique ability to reduce price lag while simultaneously increasing smoothness, making it superior to traditional SMAs or EMAs. By using four distinct periods, this indicator allows traders to see the "Big Picture" and the "Immed
FREE

GomerAI REGIME – 市场环境分类 价格: $0 平台: MetaTrader 5 类型:市场条件指标(非自动化) 概述 本指标属于 GomerAI Market Research Framework ,是一套用于研究市场结构和交易环境的分析工具。 每个指标都专注于市场行为的某一个方面,帮助交易者和自动化交易系统更好地理解当前市场条件。 GomerAI REGIME 通过三个维度来评估当前市场条件:趋势强度、波动率和区间行为。该指标不会生成交易信号,也不会执行交易操作,而是分析这些维度之间的相互作用,以判断当前市场处于安静、趋势中还是极端状态。 它的目标是在交易者和专家顾问应用具体策略逻辑之前,帮助他们理解自己所处的市场环境类型。安静状态通常对应较低波动率和区间震荡,趋势状态通常对应方向性运动和较健康的波动率,而极端状态则可能意味着波动率激增、潜在衰竭或不稳定的过渡阶段。 GomerAI REGIME 不会开仓、修改或平仓。它通过评估市场状态和分类行为,帮助交易者和自动化系统判断当前环境更适合均值回归、趋势跟随、突破策略,还是需要采取更防御性的决策方式。 重要信息 该指标分
FREE
This is the demo version of "All Harmonics 26" indicator . "All Harmonics 26" searches for 26 types of harmonic patterns and outputs them in a convenient way. You can check out the documentation here . This demo version has the following limitations: The indicator searches only for one type of harmonic patterns out of 26:- Gartley. The indicator outputs new patterns with a lag of 10 bars.
FREE

The multi-timeframe indicator of the levels of the Pivot Points. Every closed daily period has its own so-called reference point - Pivot Point, which sets the levels for smaller intraday timeframes for the following day. The Pivot Points indicators existing in the codes have no method of showing the dynamics of the pivot point changes on the historical data of the price chart. Pivot Point calculation formula. Pivot=(High + Low + Close) /3 High — the maximum of the previous day; Low — the minimum
FREE
================ // Average period ma_Sma, // Simple moving average ma_Ema, // Exponential moving average ma_Smma, // Smoothed MA ma_Lwma // Linear weighted MA =============== // Average method // Turn alerts on? // Alert on current bar? // Display messageas on alerts? // Play sound on alerts?
FREE

Multitimeframe Ma Atr is a MetaTrader 5 indicator that displays ATR and a moving average of ATR in a separate indicator window.
The indicator can calculate ATR from the current chart timeframe or from a selected higher or lower timeframe. This allows traders to monitor ATR context from one chart. For example, a trader can view an M5 chart while displaying H1 ATR and H1 ATR moving average.
Main features: - Multitimeframe ATR source - Adjustable ATR timeframe - Adjustable ATR period - Adjustabl
FREE

Hi Traders, Info Panel with PnL Coloring is a compact yet powerful on-chart dashboard for MT5.
It delivers real-time insights into Buy/Sell volume, symbol-based PnL, overall account performance, margin status, and detailed candle metrics.
With dynamic color-coding and a live candle countdown, this panel helps you monitor your essential trading information and market conditions instantly so that you can make decisions with greater clarity and precision. Abbreviations (current candle information)
FREE
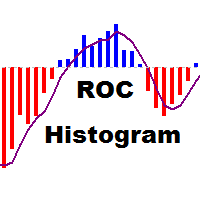
The indicator displays the value of ROC (Rate of change) from the selected price or moving average as a histogram. You can plot the moving average ROC values for smoothing indicator.
Displayed Data ExtROC - rate of change ExtMAROC - smoothing line
Parameters You can change the price, on which the indicator is calculated.
Inputs InpMAPeriod - in case you want to calculate the moving average ROC, enter averaging period. Enter 1 for the calculation of the specified prices. InpMAMethod - smoothin
FREE

ED Multi-Timeframe Market Bias Dashboard ED Multi-Timeframe Market Bias Dashboard is designed to give traders a fast and clear overview of market direction across multiple timeframes without having to continuously switch between charts. The dashboard analyzes market bias from M1, M5, M15, M30, H1, H4 and D1 , displaying each timeframe as either BULLISH or BEARISH . Market direction is determined using the relationship between the 20 EMA and 50 EMA , providing a simple and consistent method of id
FREE

Close-Open A/D (CO A/D): A Cumulative Volume-Efficiency Line for Accumulation/Distribution Analysis CO A/D is a cumulative Accumulation/Distribution-style indicator built around a simple question On-Balance Volume and Chaikin A/D don't directly ask: how efficiently did each bar convert its own volume into open-to-close travel? Formula CO_raw = (Close − Open) / (High − Low) Volume = Log(TickVolume + 1) [or raw volume — selectable] CO A/D = Previous CO A/D + (CO_raw × Volume) Where OBV assigns ful
FREE

AR Enterprises – Market Structure Sniper v1.03 Professional Smart Money Concept (SMC) Indicator
Market Structure Sniper v1.5 is a precision trading indicator designed to identify clean structure shifts, trend direction, and high-probability entry zones using Smart Money Concepts.
Built for traders who want clarity, not noise.
️ HOW IT WORKS
This indicator analyzes price using market structure logic:
1. Structure Detection Identifies HH (Higher High) HL (Higher Low) LH (Lower High
FREE

你的模拟账户在骗你。 在模拟账户上,订单会按你要求的价格精确成交。真实账户却不是这样。新闻时点差扩大,佣金不断累积,滑点悄悄吞掉每笔交易的一部分——而这些在 MetaTrader 的历史记录中都不明显。 TravaRisco Real Cost Monitor 直接在图表上告诉你,交易这个品种实际要花多少钱。 显示内容 1. 点差 当前点差:以点数、价格以及参考手数对应的金额表示 平均点差:近期、当前小时和总体 点差异常偏高时变为红色 2. 每笔交易成本(开仓+平仓) 平均点差成本 每笔交易佣金(根据你的历史自动计算,或手动设置) 平均滑点:请求价格与成交价格之差,基于你自己的订单测量 以账户货币计的每笔交易总成本 “价格需要朝你有利的方向移动 X 点才能保本” 3. 最近 N 天 交易次数和交易手数 佣金、隔夜利息、费用和估算滑点 扣除成本前的结果和净结果 “成本吃掉了你毛利润的 X%” 4. 按小时的点差热力图 24 个方格,每个对应一个服务器小时:绿色 = 便宜,红色 = 昂贵 鼠标悬停可查看数值 数据会被保存,指标运行越久越准确 5. 高点差提醒 当点差超过平均值的 X 倍时提
FREE

New candlestick alert, the alert appears according to the timeframe it is placed on. The indicator works on any asset, the alert can be silenced at any time, without the need to remove the indicator from the graph. It's great for those who can't keep an eye on the chart all the time. You can use this tool at work, college or anywhere else. It is also possible to receive signals directly on your cell phone by connecting to the metatrader. Aurélio Machado.
FREE

Indicator Update: HH LL Ultimate Multi-TF V.0 I am excited to announce a major update to the HH LL Breakout Indicator. This version is more robust, flexible, and tailored for professional price action trading.
What’s New in V6.0? Customizable Timeframes: You can now toggle individual timeframes ON/OFF. Focus only on the levels that matter to your strategy.
M15 Integration: Replaced M30 with M15 (21-period lookback) for better intraday precision and entry timing.
High TF Structural Level
FREE

Smart Confluence Radar 分析三个独立指标以寻找共振需要时间。要获得多时间框架叠加、提醒和交易时段过滤功能,请参阅 Smart Confluence Radar Advanced 。 Smart Confluence Radar 将 ATR 扩展、成交量动能和变化率组合成直接叠加在蜡烛图上的单一可视层。 显示内容: 彩色蜡烛: 亮色 = 高共振(得分 ≥70)。暗色 = 中等共振。灰色 = 低动能。 动能线: 直接绘制在图表上。蓝色 = 买方压力,红色 = 卖方压力,灰色 = 中性。 Bar 标签(+/-): 仅显示在高共振的已收盘 Bar 上。看涨 Bar 下方显示 "+",看跌 Bar 上方显示 "-"。 Bar 倒计时: 右上角显示当前时间周期和剩余秒数。 适用于:
黄金(XAUUSD)、主要外汇对和指数的日内交易。M5 至 H4。 不具备的功能: 不自动生成买卖信号。
不预测未来价格走势。
仅可视化共振数据,决策权完全属于您。 设置: 附加到图表后,根据需要调整周期参数即可使用。 您的反馈有助于未来更新。请访问我的主页。
FREE
Do you want to see the most relevant supports and resistances at a glance? Tired of tracing the levels by hand? Multi Levels Detector is an indicator for MetaTrader that will draw supports and resistances according to the parameters entered, and also offers the possibility of executing an alert every time the price reaches any of its levels.
SETTINGS UsePercentage: Allows you to configure whether the distances between levels will be measured in points, or by a percentage of the asset.
TimeFram
FREE

Quantum Observation Engine
Quantum Observation Engine is a MetaTrader 5 indicator designed for visual market observation and manual decision support.
The indicator helps traders read current market conditions through a clean panel and structure-based visual information. It does not open, modify, or close trades. It is not an Expert Advisor and it does not provide automatic trading execution.
Overview
Quantum Observation Engine focuses on market state analysis. It observes recent candle beha
FREE

This is a High-Precision Session Range Indicator designed for MetaTrader 5. It is built to help traders identify institutional liquidity zones and breakout opportunities by visualizing the "Big Three" trading sessions: Asia (Tokyo), London, and New York. Key Features: Visual Liquidity Boxes: It automatically draws shaded rectangles over the High-Low range of each session, making it easy to see where price consolidated or expanded. Intraday Price Extensions: It can project the High/Low levels of
FREE

Euro Session Open 是一款适用于 MetaTrader 5 的指标,用于在图表上显示欧洲交易时段的开盘价格。 我在真实账户交易中使用自己开发的工具。您可以在 MQL5 Signals 上查看我的交易历史、已开仓和已平仓交易以及账户统计数据。 我的真实交易账户: https://www.mql5.com/ru/signals/2385035?source=Site 该指标有助于跟踪欧洲交易时段的开盘价位,并将其作为分析日内价格走势的参考。 /////////////////////////////////////////////////////////////////////////////////////
欧洲交易时段的开始时间需要在指标设置中手动设置,并根据您的经纪商交易服务器时间进行调整。
FREE

Price tells a story, but volume tells the truth. Volume Truth is a visual analysis tool that reads the relationship between price and volume to reveal what institutions are doing behind the move — accumulating, distributing, or stepping aside. It does not just plot volume bars; it interprets them. [b]The four price/volume states[/b] Price up + volume up = institutional accumulation (bullish conviction) Price up + volume down = weak rally, no conviction, prone to reverse Price down + volume up =
FREE

SmartRSI Pro – 智能交易者的智能RSI信号指标
SmartRSI Pro 是一款基于RSI的下一代指标,旨在为交易者提供清晰、可靠且可操作的买入/卖出信号,直接显示在图表上。该工具基于流行的相对强弱指数(RSI),加入了智能逻辑以过滤市场噪音,减少错误信号——适合初学者和高级交易者。 主要功能:
自动买入/卖出箭头
基于自定义RSI阈值,清晰可见的上下箭头(无重绘)。 带重置逻辑的智能信号过滤器
仅在RSI重置时激活信号,避免过度交易和噪音。 可定制的RSI参数
选择RSI周期、水平,甚至时间框架——根据您的策略调整。 极简设计
无杂乱、无干扰——只有精准的箭头信号和一个干净的标签。 适用于所有符号和时间框架
完美支持外汇、指数、金属、加密货币等——从M1到日线。 工作原理:
买入信号:当RSI跌破买入水平(例如30)时触发。 卖出信号:当RSI突破卖出水平(例如75)时触发。 ️ 重置逻辑:确保只有在RSI回归至重置水平之后才产生新的信号。 箭头位置:可自定义箭头偏移以适配您的图表风格。 ️ 输入参数: 参数
FREE
The ATR (Average True Range) Indicator is a powerful tool designed to measure market volatility. This indicator provides accurate data on price movement ranges, helping traders manage risk more effectively and make well-informed trading decisions. Based on the widely-used ATR indicator, it’s suitable for both professional and beginner traders to analyze market volatility. The ATR Indicator allows you to track the current price movement range and use this information to set stop-losses, select en
FREE

Points Candles Osw
这是一个专业的波动率指标,旨在以点数为单位量化蜡烛图的精确行程。通过独立窗口中的动态直方图,它允许交易者可视化动量和价格强度,立即识别波动峰值和关键运动水平。
参数指南(输入菜单) Show Points Candles Bullish:激活看涨蜡烛图对应数据的显示。 Show Points Candles Bearish:激活看跌蜡烛图对应数据的显示。 视觉解读与水平解读 该指标使用彩色直方图来表示市场方向和规模:
蓝色直方图:表示收盘价高于开盘价的蜡烛(看涨)。 红色直方图:表示收盘价低于开盘价的蜡烛(看跌)。 参考水平(100, 500, 1000):该指标集成了自动水平,作为检测超过通常平均水平的高强度运动或波动爆发的参考点。 主要功能 真实行程计算:测量开盘价和收盘价之间的点数距离,从而在不受干扰的情况下了解蜡烛实体的真实大小。 方向过滤:提供仅监控一种类型蜡烛(仅看涨或仅看跌)的灵活性,以适应特定的趋势或逆势策略。 动态缩放:根据用户的显示偏好自动配置水平面板,始终保持对波动率的视觉控制。
别忘了查看我的其他指标,如果这个指标
FREE

Custom Panel allows you to gather all kind of important information and display it as one handy table in the upper right corner of the chart.
You can choose the contents of the panel yourself. Every row will show your own customized condition or value. Every column shows a different timeframe. The panel may contain up to 10 rows and up to 8 columns. Sample usage Row : Price > EMA(30)
Mode : YES_NO
Meaning : is current price above EMA(30)
Row : Ask < Bands[L]
Mode : YES_NO
Meaning : is current a
FREE

Clear Signal AI — No‑Repaint Trend Confirmation + Trend Dashboard Clear Signal AI is a trend confirmation indicator built for fast, confident decisions. It combines confirmed on‑chart signals (designed to avoid repainting behaviour), SAR trend structure, multi‑timeframe alignment (M15/H1/H4) and a live confidence score — with a clean dashboard and optional alerts. Product overview Clear Signal AI is designed for traders who want clarity, structure and consistency. It provides: Confirmed trend ar
FREE

MT4 version Overview The Lowess Channel indicator is a smoothed trend-following tool designed to help traders identify the direction of the trend , detect flat or ranging markets , and spot breakouts from consolidation zones. It creates a central smoothed line with upper and lower channel boundaries, adapting to market noise while maintaining clarity. How It Works The indicator builds a channel around a smoothed price line. The central line reflects the current trend. The upper and lower bounda
FREE

One clean trend line that follows the lows while the trend holds, and flips above price only when the move truly turns. No repaint. Any pair, any timeframe. Every flip is final on bar close. Try it free on your own charts in the Strategy Tester.
>> Get more free indicators here
Baseline, volatility, oscillators & more — free and premium.
No repainting. No guessing. Just clean signals.
THE PROBLEM Most trend lines flip too early. A classic SSL channel rides two simple moving averages,
FREE

Il WaveForce Indicatorsu un sistema di doppia envelope esponenziale e smussamento dinamico, WaveForce separa matematicamente l'energia rialzista e ribassista, tracciando due curve (Bull e Bear) e una linea di segnale centrale. Questo consente al trader di percepire con chiarezza quale delle due forze stia guidando il mercato. Caratteristiche principali: Calcola la pressione rialzista e ribassista separatamente Include una linea di segnale EMA adattiva per confermare inversioni Oscillatore fluid
FREE

Directional Impulse
一个公式。每根K线。瞬间可读。 大多数指标告诉你价格在哪里或移动速度有多快。Directional Impulse 告诉你的是另一回事:这根K线谁赢了,赢了多少。 基于原创公式 — X = (2C − H − L) × (H − L) 与 X = (C − O) × (H − L) — 它将方向性偏差乘以K线的完整波幅,而不是像该谱系中所有先前指标那样将其归一化消除。结果是每根K线的有符号能量度量,同时捕捉了信念与波动性。有符号平方根变换将输出缩放到线性价格单位,使K线的完整分布变得可读,而非被一两个异常走势主导。 Combo 版本同时绘制两层: 中点锚定(宽柱)—— 当内部压力转变时最先翻转。最先发现看涨或看跌K线内部正在形成的拉锯。
开盘锚定(窄柱)—— 仅当K线实体反转时才翻转。确认完全接管。
共识模式 —— 将两个锚定叠加为单柱,在一致时放大,在 contested K线时压缩至接近零。 你以前看不到、现在能看到的: 一根带有长上影线的看涨K线显示为看跌 —— 因为卖方在收盘前将价格推回至波幅中点下方
衰减的脉冲柱(同方向、缩小尺寸
FREE

Input Menu: * Backtest Start * Market Session * Signal Trigger Type * Take Profit (Pips) * Stop Loss (Pips) * Spread test manual and Live Spread * Simulation Timeframe (M5/M15/H1) * Show Dashboard * Notification Alert * Push Notification * Telegram Notfication
Dashborad Menu: * Show Backtest Start * Show Trigger Active * Show Live Spread or Manual Spread Test * Total Trade / Closed Trade * Success Rate * Hit Take Profit * Hit Stop Loss * Gross P/L * Float Profit * Float Loss * Net Profit (Clos
FREE

Simple Risk Manager Lot Size Calculator FREE - Money Management Tool
Enter your Risk % per trade and Stop Loss in pips - the indicator calculates the correct Lot Size based on your account balance. Displays Balance, Risk in $ and recommended Lot.
Essential for proper money management and consistent trading.
FREE, No DLL, Lightweight.
FEATURES: Calculates Lot Size automatically from Balance and Risk % Shows Risk amount in $ Input SL in pips and Risk % Works on Forex, Gold, Crypto, In
FREE
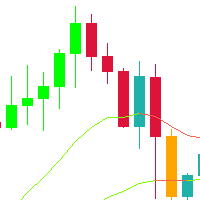
This indicator is a very simple indicator that draws candlesticks on a chart. However, it is possible to draw not only on the main chart but also on several sub-charts. In addition,it is possible to draw different symbols and timeframes from the main chart. features. 1. any symbols 2. any timeframes 3. two candle type(normal and heikin ashi) 4. many candle colors(intersection with ma_1) 5. pivot line (ver1.2) In case of positive candle, FULL : change color if low is over ma_1 PARTIAL :
FREE
MetaTrader 市场 - 在您的交易程序端可以直接使用为交易者提供的自动交易和技术指标。
MQL5.community 支付系统 提供给MQL5.com 网站所有已注册用户用于MetaTrade服务方面的事务。您可以使用WebMoney,PayPal 或银行卡进行存取款。
