 MetaTrader 5
 Experts
 Indicateurs
 Bibliothèque
 Utilitaires
 Widgets
 Règles
Regardez les tutoriels vidéo de Market sur YouTube
Comment acheter un robot de trading ou un indicateur
Exécutez votre EA sur
hébergement virtuel
hébergement virtuel
Test un indicateur/robot de trading avant d'acheter
Vous voulez gagner de l'argent sur Market ?
Comment présenter un produit pour qu'il se vende bien
Indicateurs techniques gratuits pour MetaTrader 5 - 56
 Les signaux provenant des indicateurs techniques jouent un rôle crucial dans l'ouverture et la clôture des transactions sur les marchés boursiers et les marchés forex. L'essence des indicateurs est une transformation mathématique du prix d'un symbole financier visant à prévoir les changements de prix futurs. Testez les indicateurs techniques pour mieux prédire le comportement du marché et en tirer profit.

ATR Long Box Anchor MT5 ATR Long Box Anchor MT5 is a visual risk-reward indicator for MetaTrader 5, specifically designed for planning long setups. The indicator creates an ATR-based long box directly on the chart, including entry, stop-loss zone, take-profit zone, and optional risk-reward information. The indicator works with a freely movable anchor point. This anchor defines the desired entry price and the candle whose ATR value is used for the calculation. This allows a long setup to be plann
FREE

Il s'agit d'un indicateur de type tableau de bord multi-symboles pour MetaTrader 5, offrant une vue d'ensemble en temps réel de l'orientation du marché (biais) et de la situation par rapport aux bornes de prix (range) pour un maximum de 20 symboles simultanément. Une version « Pro » incluant des fonctionnalités de notification est disponible sur le MQL5 Store.
Caractéristiques principales :
S'applique à n'importe quel graphique — Fonctionne indépendamment du symbole du graphique hôte.
Tableau
FREE

Exhaustion Count MTF compte. Il ne prédit pas la direction et il ne vous dit pas dans quel sens intervenir. Il répond à une seule question : ce mouvement dure-t-il depuis assez longtemps pour être en train de manquer de participants ? Deux phases indépendantes tournent sur le graphique, un setup et un compte à rebours. Chacune a ses propres règles, ses propres conditions d’annulation et sa propre place dans les tampons qu’un Expert Advisor peut lire. Le setup Neuf clôtures consécutives du même c
FREE

CORVUX RADAR - Moniteur de Conditions de Marché et de Trading Moniteur observationnel des conditions de marché pour MetaTrader 5. [ Guía de instalación | Guide de Mise à Jour | Dépannage | FAQ | Tous les Produits ] Aperçu CORVUX RADAR est un indicateur observationnel qui offre une visibilité en temps réel sur les conditions de trading sur MetaTrader 5. Il surveille la volatilité, le comportement du spread, le risque du compte et le contexte de session, en les présentant dans un panneau horizonta
FREE

Tout trader connaît ce rituel : ouvrir les paramètres de l'indicateur, changer un chiffre, cliquer sur OK, scruter le graphique, se dire que ce n'est pas ça, rouvrir les paramètres, tout remettre comme avant. CCI Live Tuner met fin à cela. C'est un Commodity Channel Index que vous réglez directement sur le graphique, en direct . Un petit panneau se pose sur votre graphique, avec des curseurs pour la période du CCI et pour les deux lignes de niveau. Déplacez un curseur et l'indicateur se recalcul
FREE

For support, visit cc.inni.cc where you will also find our Knowledge library and FAQ. PATHFINDER TREND is a complex, yet easy to manage trend indicator. It has various features that can aid in your decision making and boost your performance accuracy. Patfhinder Trend is a visually comfortable and user friendly tool that you should keep on your trading desk.
Key features Signal Detection & Trend Analysis Visually clear and decisive Early indication of signal direction with arrows Confirmed si
FREE
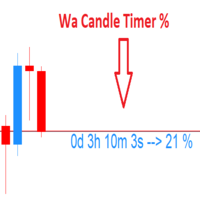
Wa Candle Timer Percentage MT5 est un indicateur qui montre à l'utilisateur combien de temps il reste avant l'ouverture de la prochaine bougie. Le pourcentage d'évolution de la bougie actuelle est aussi montré sur l'écran. L'utilisateur peut configurer le pourcentage auquel le candle timer changera de couleur. Voici les paramètres: 1 - Le pourcentage auquel le candle timer changera de couleur. 2 - couleur de la minuterie de la bougie, quand le pourcentage d'évolution de la bougie actuelle est E
FREE
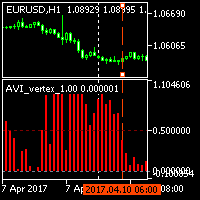
The indicator displays trend slowdown or possible end of trend and price reversal. The indicator has no parameters. When red bars appear and when they become shorter, we can talk about the approaching end of the downtrend. When green bars become shorter, we can expect the approaching end of the uptrend.
FREE

MSX Heikin Ashi Advanced Overview MSX Heikin Ashi Advanced is a MetaTrader 5 indicator designed to provide a smoothed visual representation of price movement using a modified Heikin Ashi calculation. The indicator applies Heikin Ashi calculations to user-selected price sources and displays color-based candles that may assist with trend observation and market structure analysis. Features • Modified Heikin Ashi candle calculation • Real-time candle updates • Multiple applied price options • Color
FREE

======================================================== BUY/SELL VOLUME MOMENTUM DASHBOARD - MQL5/MT5 MARKET DESCRIPTION (formatting: **bold** = Bold button; lines with • = bullet list; UPPERCASE = heading) ========================================================
OVERVIEW ------------------------------------------------------- **Buy/Sell Volume Momentum Dashboard** reads buying vs selling volume momentum and presents it as a clear on-chart dashboard, so you can see which side is driving the m
FREE
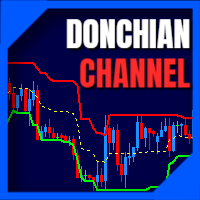
The donchian channel indicator might just be the best fit for you
Trading in derivative products such as futures, options, CFD's, forex and certificates contains significant risk. These products are not suitable for every investor. Investors could potentially lose all or more than the original investment. If anything, only money equal to personal risk capital should be used and can be lost without jeopardizing financial security or lifestyle. Partially or fully automated trading programs can
FREE

Support zones are created from confirmed pivot lows with positive volume conditions, while resistance zones are created from confirmed pivot highs with negative volume conditions. The visual boxes are color-coded to make analysis easier: green zones represent potential support areas, and red zones represent potential resistance areas. The indicator also includes hold signals and breakout labels. Hold markers help traders observe when price reacts from a zone, while breakout labels show when a su
FREE

Zone Alerts by iXOpay - MT5 Indicator What it is Indicator that marks price zones and sends alerts when the price touches, breaks, exits, or retests those zones. Neutral, informative tool. No promises of profit. How to use Attach to any symbol and timeframe. Set the zone boundaries and enable the desired events. Optionally enable trend/volatility filters. Receive alerts and manage your plan. Inputs EMA_Period (20/50/100/200) - optional trend filter Stoch_K , Stoch_D , Stoch_Smooth - confirmation
FREE

MACD and Price Structure Confluence Indicator The indicator is based on the principles of the MACD in its formula , combined with price structure, support, and resistance levels identified on the D1 (Daily) timeframe . The regions identified by the system are represented by dashed lines extending across the entire chart , allowing users to visually monitor important levels within the market structure. The system's studies and analysis were primarily conducted using the M30 (30-minute) timeframe
FREE
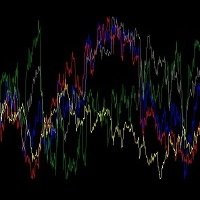
An indicator for analyzing different currency pairs simultaneously Forex is a complex market that requires several currency pairs to be analyzed simultaneously Determine the number of currency pairs yourself Determine the currency pair you want to analyze to analyze 4 of the most important and similar currency pairs at the same time. For direct and simple analysis, some currency pairs have changed (EURUSD>>>USDEUR) Do not doubt that to succeed in this market, you must analyze several currency pa
FREE

HELIOS BULLION CONFLUENCE RSI + EMA 50 / EMA 200 Signal Indicator for XAUUSD
Helios Bullion Confluence is a professional Gold trading indicator created for traders who prefer selective signals supported by both long-term trend structure and momentum confirmation.
The system combines a Gold-focused price calculation engine with EMA 50 / EMA 200 trend alignment, RSI momentum filtering, ATR-based Entry / Stop Loss / Take Profit zones, can
FREE

MT4 version Overview The Lowess Channel indicator is a smoothed trend-following tool designed to help traders identify the direction of the trend , detect flat or ranging markets , and spot breakouts from consolidation zones. It creates a central smoothed line with upper and lower channel boundaries, adapting to market noise while maintaining clarity. How It Works The indicator builds a channel around a smoothed price line. The central line reflects the current trend. The upper and lower bounda
FREE
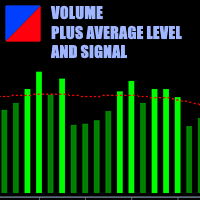
This is a volume indicator with the addition of a threshold level that can be set to a fixed value chosen personally or obtained from the average of the volume values themselves. The type of averaging method can be selected in the input parameters.
The input parameters are easy to interpret but let's examine them:
1 - Volume type Here you can select the type of volume you want to see represented and there are 2 choices, either TICK volume or REAL volume. Keep in mind that for forex, for examp
FREE

Sentimento de Mercado é um indicador que usa os dados do nosso principal indicador: Market Strength Radar.: https://www.mql5.com/pt/market/product/114568?source=Site +Profile+Seller Ele imprime um gráfico de linhas que deve ser comparado com o gráfico de preço para entendermos o sentimento do mercado. As divergencias são pontos importantes de inflexão. As convergências mostram força da tendência atual.
FREE

Indicador Monte Carlo Simulation Indicador faz uma regressão linear nos preços de fechamento do ativo escolhido e gera uma simulação de Monte Carlo de N preços aleatórios para definir 3 níveis de sobrecompra e 3 níveis de sobrevenda. O primeiro processo é a Regressão Linear dos preços de fechamento do ativo, no qual é regido pela equação: Y = aX + b + R Onde Y é o valor do ativo escolhido, X é o tempo, a é a inclinação da reta, b é a intersecção da reta e R é o resíduo. O resí
FREE

Tout trader connaît le rituel : ouvrir les propriétés de l'indicateur, changer un chiffre, cliquer sur OK, plisser les yeux devant le graphique, se dire que ce n'est pas ça, et rouvrir les propriétés. Le Force Index n'a qu'un seul chiffre à régler — la période —, mais ce simple aller-retour dans la boîte de dialogue vous coûte toujours le même cycle de tâtonnement dès que vous voulez comparer 13 à 2 ou à 100 sur votre propre symbole. Force Index Live Tuner met fin à cela. C'est un Force Index qu
FREE

Drawdown Floor rend visible la ligne invisible. Un compte financé ou de challenge meurt à l'instant précis où l'equity touche un plancher qui suit votre sommet, se réinitialise chaque jour, ou reste figé sous votre solde de départ. Votre prop firm ne trace jamais cette ligne. Cet outil, si. Ce qu'il affiche Un tracé en direct de l'equity face au plancher dans une fenêtre séparée : votre equity de trading confrontée à un maximum de trois planchers (drawdown maximal trailing ou statique, et le pla
FREE
Supertrend with CCI Indicator for MQL5 – Short Description The Supertrend with CCI Indicator is a powerful trend-following tool that combines Supertrend for trend direction and CCI for momentum confirmation. This combination helps reduce false signals and improves trade accuracy. Supertrend identifies uptrends and downtrends based on volatility.
CCI Filter ensures signals align with market momentum.
Customizable Settings for ATR, CCI period, and alert options.
Alerts & Notifications via
FREE
Cet indicateur est la version convertie pour MetaTrader 5 de l'indicateur TradingView "ATR Based Trendlines - JD" créé par Duyck. Fonctionnement :
L'indicateur trace automatiquement et continuellement des lignes de tendance basées non seulement sur le prix, mais aussi sur la volatilité mesurée par l'ATR. Ainsi, l'angle des lignes de tendance est déterminé par (un pourcentage de) l'ATR. L'angle des lignes suit les variations de prix, dictées par la valeur ATR au moment où le point pivot est détec
FREE

This MQL5 script is a Dynamic Support & Resistance (S/R) Investigator. It functions as a real-time analytical tool that identifies key price levels and mathematically evaluates their "durability" based on historical interactions. Unlike static indicators, it uses a custom Graphical User Interface (GUI) to provide a live dashboard of market structure. 1. Level Detection Logic The indicator scans the most recent InpPeriod (lookback) of bars to identify the absolute highest peak (Resistance) and t
FREE

The indicator is based on Robert Miner's methodology described in his book "High probability trading strategies" and displays signals along with momentum of 2 timeframes. A Stochastic oscillator is used as a momentum indicator.
The settings speak for themselves period_1 is the current timeframe, 'current' period_2 is indicated - the senior timeframe is 4 or 5 times larger than the current one. For example, if the current one is 5 minutes, then the older one will be 20 minutes The rest of the s
FREE
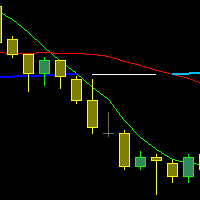
The indicator draws three Moving Averages. Two short ones cross a long one.
At the same time, the long MA changes color: If both short MAs are above the long one - first color; If both short MAs are below the long one - second color; If the two short MAs are on opposite sides of the long one - third color. All three MAs are based on closing prices with a smoothing method of "simple."
cross MA cross 3 MA cross three Moving Average across Moving cross Moving crossing MA crossing MA across MA
FREE

The indicator averages the price using one of four methods: Simple Exponential Linear Weighted Smoothed Tema Dema None Then filters the result through the RSI values.
This results in a line drawn that approximates the trend change in the RSI peak zones. The last three screenshots show two indicators on a single chart with RSI high and low prices and the rest of the default parameters.
The up color (red) for the high prices is set to None, while the down color (blue) for the low prices is set to
FREE
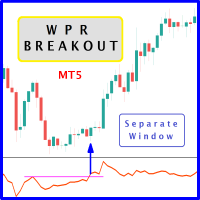
The likelihood of farther price movement increases when Larry Williams Percentage Range oscillator "WPR" breaks through its historical resistance levels in conjunction with prices breakout of resistance levels. It's strongly encouraged to confirm price breakout with oscillator breakout since they have comparable effects to price breaking support and resistance levels; similar perception is applied to short trades. Concept is based on find swing levels which based on number of bars by each side t
FREE

El indicador técnico conocido como Líneas de Tendencia Perfecta . Este indicador es una herramienta valiosa en el análisis técnico y se utiliza para mejorar la toma de decisiones en el trading. Aquí tienes una descripción paso a paso de cómo funciona y cómo puede ser utilizado por los traders: Identificación de Tendencias : Las líneas de tendencia perfecta se dibujan conectando dos o más puntos de precio en un gráfico, revelando así la dirección general del mercado. Una línea ascendente indica
FREE
Server Timer
Version: 1.2 The Server Time Clock Indicator is a lightweight and visually appealing tool for displaying the server's current date and time directly on the chart. This indicator updates dynamically every second and provides the following features: Customizable Appearance : Adjust font color, background color, and font size to match your chart's theme. Day and Time Display : Shows the current day, date, and time in an easy-to-read format ( Day{MM/DD} HH:MM:SS ). No Performance Over
FREE

A very useful Price Action point is the previous day Closing VWAP. We call it Big Players Last Fight . This indicator will draw a line showing on your chart what was the last VWAP price of the previous trading session. Simple and effective. As an additional bonus, this indicator saves the VWAP value on the Public Terminal Variables, so you EA could read easily its value! Just for the "Prefix + Symbol name" on the variables list and you will see!
SETTINGS How many past days back do you want to s
FREE

Trend flow ICT helps you quickly assess the strength and direction of the trend on the chart. *Note: Free indicator included - https://www.mql5.com/en/market/product/149447
Configuration guide Score: The length of the scoring window. Smaller → more sensitive, prone to noise. Larger → smoother, less signals. ATR: ATR period to standardize fluctuations. Trend threshold: Threshold to confirm a trend. Strong trend: Strong trend threshold. Min Body (x ATR): Minimum candle body to confirm a breakou
FREE
Tired of adjusting the indicator settings losing precious time? Tired of the uncertainty regarding their efficiency? Afraid of the uncertainty in their profitability? Then the indicator ACI (automatically calibrateable indicator) is designed exactly for you. Launching it, you can easily solve these three issues just performing the simplest action: clicking a single Calibrate button. To achieve the highest efficiency, you should perform another additional action: move the power slider to the maxi
FREE

Short Market Description (recommended) Market Periods Synchronizer highlights higher-timeframe (HTF) sessions directly on your current chart, so you can trade the lower timeframe with full higher-timeframe context. Draws vertical lines for each HTF bar (e.g., H1 on an M5 chart) Optional body fill (green for bullish, red for bearish) for each HTF candle Optional Open/Close markers with labels to spot key reference levels fast Optional minor-timeframe dividers (e.g., M30 & M15) only inside each
FREE

Multi-Symbol Chase Mirror lit uniquement l'historique de trading déjà clôturé du compte et compte une seule chose : sur combien de symboles différents des positions ont été ouvertes. L'outil ne prédit rien et ne conseille rien. Chaque chiffre du panneau correspond à quelque chose qui s'est déjà produit sur ce compte.
Comment les chiffres sont construits : il lit jusqu'à 31 jours de transactions clôturées sur tous les symboles et tous les numéros magiques - la vue porte sur le compte entier, pas
FREE

The FXmans Position Calculator is a high-precision trading tool designed for algorithmic risk management. Below is an explanation of its core components and functions in English: 1. Risk Management Engine The indicator calculates your position size based on the specific risk you are willing to take per trade. Risk Mode: You can toggle between Percent (a fixed percentage of your account balance) or Fixed USD (a static dollar amount). R/R Ratio: This determines where your Take Profit (TP) level
FREE
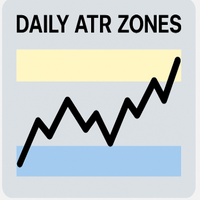
Daily ATR Zones – Precision Intraday Range Mapping Daily ATR Zones is a clear tool that plots intraday high/low targets using the Average True Range (ATR) of the previous days. These zones help traders anticipate potential price extremes , identify liquidity pockets , and define reversal or breakout levels — all based on objective volatility data. Key Features: Flat Zone Logic — Based on Open ± ATR , not bands around price
Custom Zone Thickness — Adjustable via ATR ratio ( ZoneHeightRatio )
FREE

This is a simple and lightweight indicator that displays the live spread of the trading instrument on the top left corner of the screen. It is built to be lightweight, performant and react to real time price feed. The spread is the difference between the Ask and Bid price of the trading instrument. This is the cost that the user needs to pay for immediate execution. It is crucial to know and track the spread to be aware of costs involved. In the standard accounts, the spread is the only cost you
FREE

Indicateur de Détection de Chandeliers By Mahefa R. Description générale Candle Detector est un indicateur technique avancé pour MetaTrader 5 , conçu pour détecter automatiquement et mettre en évidence les principaux patterns de chandeliers japonais directement sur le graphique des prix .
Il permet aux traders d’identifier rapidement les configurations de retournement ou de continuation du marché, sans surcharge visuelle. L’indicateur recolore uniquement les bougies correspondant au pattern
FREE
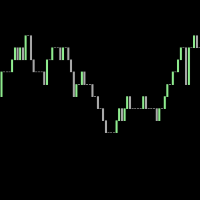
This is a tick indicator which compares the current bid price with the previous bid directly before it, and draws candles based on a comparison of the current ticks. It does not use historical ticks. Everything happens in real time, data moves from right to left, and the newest data arrives at the right. A trend line can be added which points in the direction of the price shifts.
FREE
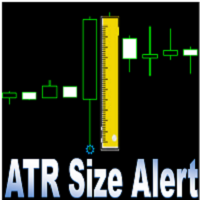
Indicador baseado no ATR (Avarage True Range) que exibe o tamanho em pips ou pontos do ativo. O indicador ATR SIZE ALERT dispara um alerta caso o preço atinja o numero de pips pre definido pelo usuário: Input: Periodo (periodo do indicador ATR) Pips (tamanho do movimento esperado) Alert (alerta sonoro) Além do alerta sonoro, o indicador também possui alerta visual.
FREE
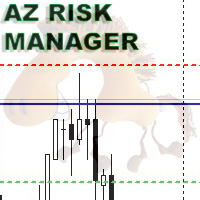
A simple indicator for calculating risk and automatically calculating the take profit line. In the settings, you enter the desired risk to profit ratio, the indicator will automatically calculate the volume for entry and show where to set the take-profit line to maintain the proportion. The risk is calculated based on your balance data. The information panel can be moved around the screen. The stop-loss line can also be moved, this will recalculate the entry volume and the take-profit position.
FREE

Trend Entropy – Adaptive Chaos & Order Detector
Entropy is the scientific measure of disorder or uncertainty in a system. In physics, it shows how energy disperses and why systems move toward chaos. In information theory, it measures unpredictability in data. Low entropy means order and predictability, while high entropy reflects randomness, complexity, and reduced clarity of outcomes.
Trend Entropy is a next‑generation trading indicator designed for MetaTrader 5. Unlike conventional oscillat
FREE

LIMINAL DEE — Dynamic Exhaustion Engine for MetaTrader 5 LIMINAL DEE is a momentum exhaustion indicator that detects when a directional price move is running out of energy — before price confirms the reversal. Rather than using fixed take profits, DEE scores exhaustion in real time on a normalised 0–100 scale and signals the optimal exit window while profit is still at its peak. DEE combines three proprietary sub-measurements: Body Decay Index (BDI) — whether consecutive expansion candles are sh
FREE
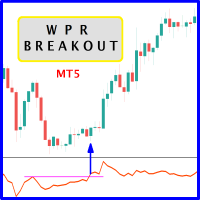
The likelihood of farther price movement increases when Larry Williams Percentage Range oscillator "WPR" breaks through its historical resistance levels in conjunction with prices breakout of resistance levels. It's strongly encouraged to confirm price breakout with oscillator breakout since they have comparable effects to price breaking support and resistance levels; similar perception is applied to short trades. Concept is based on find swing levels which based on number of bars by each side t
FREE
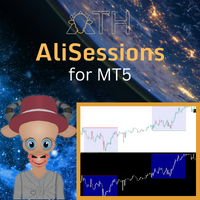
AliSession Highlight is an indicator that highlights a specific period of time according to your preferences. It can help you gain a clear vision of price movements into a specific session, the range of a session, and also to easily identify the high and low of the session. You can use it on any currency pairs, indices, and any timeframes. Settings: Start Hour: Set the hour to initiate the session highlight. Start Min: Set the minute for the start of the session highlight. End Hour: Specify the
FREE

SwingStrength Pro – Swing High & Low Strength Scoring for MT5 Not every swing high or low is equal. Some are formed by a sharp rejection on heavy volume and hold for weeks; others are minor pauses that break at the first retest. SwingStrength Pro finds every swing high and swing low that price has not yet closed through, scores each one from 0 to 100, and shows you the strongest resistance and support directly on your chart. How it works Finds swings. The indicator scans the chosen timeframe for
FREE

Detecting Stop Hunts at Key Levels Smart Money Stop Hunt Detector is a powerful visual analysis tool designed to identify potential "stop hunt" zones orchestrated by large market participants. The indicator automatically displays significant price levels on the chart and signals when price "stops out" positions beyond these levels with a swift subsequent reversal. Core Concept Large market players (Smart Money) often intentionally push price beyond key support/resistance levels (round numbe
FREE
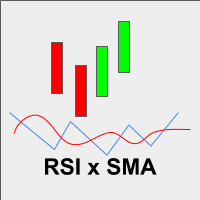
Esse indicador é a combinação do RSI (IFR) com Média Móvel Simples aplicada o RSI em um único indicador para facilitar a criação de alguma estratégia. Fiz esse indicador para que um único indicador contenha os buffer necessários para implementar alguma EA.
Descrição dos Buffers para o EA,
Buffer 0 -> Valor do RSI Buffer 1 -> Valor da média móvel aplicada ao RSI
FREE

Une seule ligne de tendance nette qui suit les creux tant que la tendance tient, et bascule au-dessus du prix seulement quand le mouvement se retourne vraiment. No repaint. Sur toute paire, tout timeframe. Chaque bascule est définitive à la clôture de la bougie. Essayez-la gratuitement sur vos propres graphiques dans le Strategy Tester.
LE PROBLÈME La plupart des lignes de tendance basculent trop tôt. Un SSL channel classique repose sur deux moyennes mobiles simples : il change de côté
FREE

CustomRSI50 - Indicateur RSI Personnalisé avec Niveau 50 Description CustomRSI50 est un indicateur technique personnalisé basé sur le populaire Relative Strength Index (RSI). Cet indicateur offre une visualisation claire et personnalisable du RSI, avec un accent particulier sur le niveau 50, crucial pour de nombreux traders dans l'analyse du momentum. Caractéristiques Principales Période RSI configurable Niveau de référence 50 mis en évidence Type de prix appliqué personnalisable Affichage dans
FREE

OVERVIEW Sierra Capital Multi-Timeframe ATR puts the daily Average True Range (ATR) of the chart symbol into a compact panel on your chart. Several ATR periods sit side by side, together with today’s range so far, so you can see at a glance whether today is quiet or active compared with recent days. It is a display tool. It draws nothing on the price chart, gives no signals or alerts, and does not open or manage trades.
WHAT YOU SEE A small panel in a corner of the chart (top right by default)
FREE
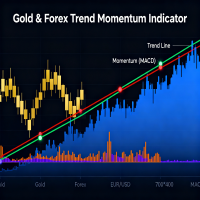
Overview QuantumEdge Oscillator is a professional-grade trading indicator that combines advanced momentum analysis with sophisticated trend detection algorithms. This 30-day trial version provides full access to all features, allowing you to thoroughly test its capabilities in live market conditions before making a purchase decision. Key Features Dual-Signal System : Combines RSI moving average with smoothed ATR-based volatility bands Multi-Timeframe Analysis : Built-in support for higher timefr
FREE

Description The Profit and Loss Indicator by Creative Tech Solutions is a robust and comprehensive tool designed to help traders monitor their trading performance in real-time. This indicator provides detailed metrics on profits and drawdowns, ensuring traders are always informed about their trading activities and performance. With customisable alerts and display settings, this indicator is an essential tool for any serious trader. Features Real-Time Metrics : Monitor profit and drawdown percent
FREE

Draggable Timer with sound — a clean, lightweight countdown to the close of the current candle. Drag it anywhere on your chart with the mouse and never miss a bar close again. Built for discretionary traders who want one clear number on the chart, with no clutter and no lag. Features: - Live countdown to the close of the current timeframe's candle - Fully draggable — place it wherever you want on the chart - Color states: the number turns orange under 30 seconds and red under 10 seconds - Option
FREE

パラボリックのデータをもとにトレンドの方向性を1分足から月足まで表示します。 1分足から 月足 まで表示されているので今どの方向に価格が動いているのかがすぐに分かります。
更新はティク毎ではなくディフォルトでは1秒毎、もちろん変更も可能なのでチャートの表示が遅くなるようなことはありません。
機能:
どの通貨でも表示可能になります。
アイコンの色を指定することが可能になります。
表示位置(X軸、Y軸)が変更可能 になります。
表示位置 (左上 、 右上 、 左下 、 右下) が 指定 が可能 になります。
フォント を指定することが可能になります。
フォントサイズ が 変更可能 になります。
アイコンのサイズ が 変更可能 になります。
週足、 月足 の非表示 が 可能 になります。
FREE

Introducing the Professional Indicator ARKA – Candle Close Time
Do you want to always know the exact remaining time for the current candle to close? Or do you want to instantly see the real-time broker spread right on your chart without any extra calculations?
The ARKA – Candle Close Time indicator is designed exactly for this purpose: a simple yet extremely powerful tool for traders who value clarity, precision, and speed in their trading.
Key Features:
Displays the exact time re
FREE

Description L'indicateur Bid/Ask Spread Signal est un outil avancé conçu pour les traders utilisant MetaTrader 5 (MT5) qui souhaitent surveiller et réagir efficacement aux variations du spread Bid/Ask. Il offre une visualisation claire du spread actuel, de sa moyenne mobile, et des niveaux d'alerte personnalisables, permettant ainsi une meilleure prise de décision et une gestion des risques optimisée.
Caractéristiques Principales • Visualisation du Spread en Temps Réel : Affiche le spread Bid
FREE
One of the basic needs of every trader is to have a checklist to enter every position. Of course, using pen and paper may not be convenient forever. With this indicator, you can have a small checklist next to the screen for each of your charts and use it for better use in your trades.
By pressing the r button, you can return everything to the original state.
MT4 Version
This indicator will have many updates and special settings will be added to it.
You can contact us via Instagram, Telegram, Wh
FREE

Position Risk Calculator MT5
Description Position Risk Calculator MT5 is free. Drag the Entry, Stop Loss and Take Profit lines on the chart and read the lot size for the risk you chose. Lot, risk, R:R and margin sit in one floating panel.
Lot size from your risk - Risk as a percent of the account or as a fixed amount. Account size from balance, equity or a number you type. - Lot rounding: down (never above your risk), to the nearest step, or up. If rounding puts you over your risk, the risk t
FREE
Here's a clearer, more organized description for the indicator: An enhanced ATR Bands indicator that provides flexible, configurable price bands based on Average True Range (ATR). While traditional ATR-based indicators often have limitations in their configurability and functionality, this version offers comprehensive features for both stop-loss and take-profit level calculations. Key Features: Configurable source price (close, high, low) for ATR band calculations Adjustable scaling factors wit
FREE

El indicador técnico Non Lag MA (Non-Lagged Moving Average) es una variante de la media móvil que busca reducir el retraso inherente a las medias móviles tradicionales.
Pros: - Menos retraso: Al estar diseñado para reducir el retraso, el Non Lag MA puede proporcionar señales más rápidas que las medias móviles tradicionales. - Tendencias claras: Las líneas del Non Lag MA muestran claramente las tendencias alcistas y bajistas, lo que facilita la interpretación de la dirección del mercado. - Pers
FREE

The Trend Strength Meter Core is a powerful on-chart dashboard designed to give you an instant, clear reading of the current market momentum . By combining the data from Moving Averages, RSI, and MACD, it calculates a highly accurate Trend Score (0 to 100), ensuring you always trade on the right side of the market . Key Features Advanced Confluence Algorithm: Calculates a dynamic score by analyzing price position relative to MA, RSI overbought/oversold zones, and MACD signal crossovers . Enhanc
FREE

TITLE / OPENING PARAGRAPH: Spread Monitor displays your broker's live spread directly on the chart — updated every tick, color-coded by status, with an optional alert when the spread gets too wide. Know before you trade whether the spread is normal or dangerous. HOW IT WORKS: The indicator reads the current spread every tick and shows it as a colored panel on your chart: LOW — spread is within your normal range (green)
MID — spread is elevated, trade with caution (yellow)
HIGH — spread
FREE

AdnanEdge is a technical signal indicator for MetaTrader 5. It analyzes market conditions using five independent strategies and displays BUY or SELL arrows on the chart when a valid signal appears. The indicator is read-only and does not place trades. The built-in dashboard shows the current signal direction, strategy name, quality score, market regime, and relative volume. An adaptive mode automatically selects the best strategy for current conditions. Key Features Five signal strategies: MA C
FREE
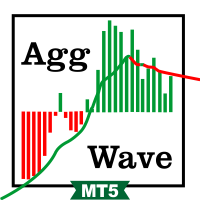
This indicator sums up the difference between the sells aggression and the buys aggression that occurred in each Candle, graphically plotting the waves of accumulation of the aggression volumes. Through these waves an exponential average is calculated that indicates the direction of the business flow.
Note: This indicator DOES NOT WORK for Brokers and/or Markets WITHOUT the type of aggression (BUY or SELL). Be sure to try our Professional version with configurable features and alerts: Agre
FREE

Price Compression Indicator Based on Financial Volume Levels This indicator was developed to identify price compression regions associated with relevant financial volume levels , using horizontal lines on the chart to highlight areas that may present greater market interest. The system monitors price behavior within these regions, considering different possibilities such as continuation, breakouts, rejections, and potential false breakouts . Therefore, the horizontal lines represent areas for st
FREE

The Moving Averages On-Off let you control the indicator using the keyboard or a button . You can choose if you want the indicator always shown or always hided while switching among different time frames or financial instruments . ---> This indicator is part of Combo Indicator OnOff
It's possible to setup three Moving Averages : Short , Medium , Long
Input You can customize the price type used for calculation : close, open, high, low, median price, typical price, weighted It's
FREE

TideMarks Basic — Hauts et Bas des Sessions (NY, Londres, Tokyo) Ceci est la version gratuite de TideMarks. Elle affiche les plus hauts et plus bas du jour pour les sessions de Tokyo, Londres et New York sans aucune configuration requise — il suffit de l'ajouter au graphique et ça fonctionne. La version complète ajoute : Boutons de contrôle sur le graphique par session Lignes de range Ouverture-Fermeture Coloration des bougies avec repères directionnels Deux sessions supplémentaires entièrement
FREE
Le MetaTrader Market est un site simple et pratique où les développeurs peuvent vendre leurs applications de trading.
Nous vous aiderons à publier votre produit et vous expliquerons comment préparer la description de votre produit pour le marché. Toutes les applications de Market sont protégées par un cryptage et ne peuvent être exécutées que sur l'ordinateur de l'acheteur. La copie illégale est impossible.

Vous manquez des opportunités de trading :
- Applications de trading gratuites
- Plus de 8 000 signaux à copier
- Actualités économiques pour explorer les marchés financiers
Inscription
Se connecter
Vous acceptez la politique du site Web et les conditions d'utilisation
Si vous n'avez pas de compte, veuillez vous inscrire