 MetaTrader 5
 Experts
 Indicadores
 Bibliotecas
 Utilitários
 Widgets
 Regras
Conheça o Mercado MQL5 no YouTube, assista aos vídeos tutoriais
Como comprar um robô de negociação ou indicador?
Execute seu EA na
hospedagem virtual
hospedagem virtual
Teste indicadores/robôs de negociação antes de comprá-los
Quer ganhar dinheiro no Mercado?
Como apresentar um produto para o consumidor final?
Indicadores Técnicos Grátis para MetaTrader 5 - 56
 É com base nos sinais de indicadores técnicos que se aplicam as decisões para abertura ou fechamento de uma transação nos mercados de ações e Forex. A essência dos indicadores reside na previsão de mudanças de preço, com base na conversão matemática de preço e/ou volumes de um instrumento financeiro.
Teste os indicadores técnicos para prever melhor o comportamento do mercado e lucrar com isso.

The indicator averages the price using one of four methods: Simple Exponential Linear Weighted Smoothed Tema Dema None Then filters the result through the RSI values.
This results in a line drawn that approximates the trend change in the RSI peak zones. The last three screenshots show two indicators on a single chart with RSI high and low prices and the rest of the default parameters.
The up color (red) for the high prices is set to None, while the down color (blue) for the low prices is set to
FREE

This indicator automatically draws key weekly and monthly price levels on your chart. All lines end at Sunday 23:59 of the current week. Levels and Default Settings Level Color Style Width Start Point Friday High Red Solid 2 Exact high candle Friday Low Red Solid 2 Exact low candle Friday Close Green Solid 2 23:00 (adjustable) Opening Range High Blue Solid 2 Mon-Tue high candle Opening Range Low Blue Solid 2 Mon-Tue low candle Previous Week High Light Gray DashDotDot 1 Exact high candle Previou
FREE

Most candles say very little. A few say a great deal. Candle Strength makes the difference visible without you measuring anything. It colours every candle by how much of its move is body relative to current volatility: strength = |close - open| / ATR A candle with a large body relative to ATR is a committed move: one side took control and held it into the close. A candle with a small body is indecision, no matter how far the wicks travelled. How to read it Blue - strong bullish candle, body at
FREE

The indicator makes calculations based on data obtained from one of seven (7) moving averages and colors the chart.
Simple moving averages are those that have only one important calculation parameter - the period.
The shift in the indicator is not used.
There is a shift trick setting, it is used to smooth the result of calculations. You can see the changes if you reduce this parameter to 1 (minimum value).
shift trick must always be less than the period value.
Available averages:
MA Simpl
FREE

Short Description On-chart strength analysis for currency and custom baskets: leg breakdown, coherence, pip sum, volatility-scaled state and activity. Full Description
manual -> https://mattrix8x.com/BasketStrength
Mattrix Basket Strength is an on-chart panel for synthetic basket charts and FX pairs.
It breaks a basket into its legs, sorts them strongest first and shows how broad the current move is - whether a currency is moving across the board or a single pair is doing the work. WHERE IT
FREE

Fractals TrueFalse — это модифицированный индикатор фракталов, который расширяет классическую концепцию Билла Вильямса с помощью структурного анализа Price Action. Индикатор автоматически классифицирует каждый найденный экстремум на Истинный (True) и Ложный (False) .
——————————
• Фильтрация ложных сигналов: Анализирует внутреннюю структуру свечной формации по крайним барам паттерна.
• Наглядная визуализация:
• Голубые стрелки: Истинные фракталы (сильные уровни с подтвержденной структурой
FREE

Multi-Timeframe Range Trading is a MetaTrader 5 indicator for range trading. It identifies the price oscillation zone and marks the top (resistance) and bottom (support) so you can trade swings inside the range, with higher-timeframe context. Features Automatic range detection: defines the range from recent highs and lows and draws the top and bottom bands. Built-in range bias: price tends to be pushed down from the top and up from the bottom while the range holds. Multi-timeframe context: confi
FREE
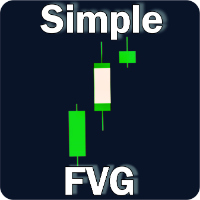
Simple Fair Value Gap Unlock the power of fair value gaps with this simple and precise, easy to use indicator designed to identify and visualize market inefficiencies
Simple Fair Value Gap is an mt5 indicator which paints the center of a fair value gap candle with a different color. A Fair Value Gap (FVG) is a three candle formation in which the middle candle does not get completely overlapped by the left and right candle. i.e The difference between the high and low of either left or right cand
FREE
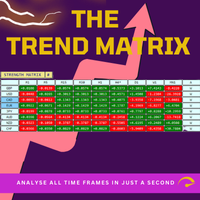
Trend Teller é uma ferramenta de painel poderosa e intuitiva projetada para oferecer uma visão panorâmica da tendência do mercado em todos os principais pares de moedas e em todos os timeframes — de M1 a MN1.
Criada por traders para traders, esta ferramenta elimina o achismo na análise de tendências e ajuda você a se manter alinhado com a direção geral do mercado. A maioria dos iniciantes tem dificuldade em identificar a direção do mercado — algo que até mesmo traders experientes erram de vez em
FREE

O HiperCube Tornado está aqui! Código de desconto de 20% na Darwinex Zero: DWZ2328770MGM_20 O HiperCube Tornado é um indicador simples, mas eficaz, que o ajuda a identificar quando um novo touro ou energia de urso está próximo.
Fácil de usar Cores personalizadas Indicador separado do Windows O TEMA é utilizado para fazer calcs Períodos personalizados Método Personalizado O chat GPT e IA costumavam ser desenvolvidos Estratégia Espere a TI+ atravessar o TI- Isto significa, sinal para comprar
Ag
FREE

Session Highlighter and Killzones draws clean colored boxes for the Asia, London and New York trading sessions, plus optional London and New York killzone windows. Time of day is a large part of context in forex, and seeing each session range on the chart explains a lot of what price is doing. Each session box marks the high and the low of that session for the last several days, and the boxes sit behind the candles so the chart stays readable. The session hours are set in server time and are ful
FREE

This is a dedicated trading auxiliary tool for the MT5 platform, with the core function of automatic counting and labeling of candlesticks within a custom trading session . It adapts to overnight trading scenarios and broker time differences (summer/winter time), features a lightweight design and flexible configuration, and eliminates manual candlestick counting to improve chart analysis efficiency. Core Features Customize the opening and closing time of the trading session in Beijing Time, sup
FREE

Free until ...
The MACD Indicator is a MetaTrader 5 tool that helps traders analyze market trends and momentum. It shows three components in a separate window below the price chart: the MACD Line, Signal Line, and Histogram. What It Shows: MACD Line (Blue): Tracks the difference between a fast and slow moving average. Signal Line (Orange): A smoothed average of the MACD Line. Histogram (Bars): Shows the gap between MACD and Signal Lines with colors: Dark Green : Rising momentum above zero. Lig
FREE

>> Announcements Channel << DiverX is a powerful and versatile divergence indicator developed for the MetaTrader 5 platform. It detects both Regular and Hidden Divergences based on five popular technical indicators: RSI (Relative Strength Index) , RVI (Relative Vigor Index) , Stochastic Oscillator, CCI (Commodity Channel Index) , and MACD (Moving Average Convergence Divergence) and ATR Plus (author’s proprietary indicator, product page >> ) . The indicator plots results directly on the main c
FREE

Ultimate Multi-Timeframe Pattern Scanner Dashboard is a high-performance, advanced technical tool designed to automatically scan and identify 14 of the most powerful candlestick patterns simultaneously across multiple currency pairs and timeframes. Built with a highly optimized, timer-driven architecture, this dashboard updates seamlessly without causing platform lag or freezing, making it the perfect scanner for active traders who want to monitor the entire market from a single chart. ️ IMPORT
FREE

MT4 version Overview The Lowess Channel indicator is a smoothed trend-following tool designed to help traders identify the direction of the trend , detect flat or ranging markets , and spot breakouts from consolidation zones. It creates a central smoothed line with upper and lower channel boundaries, adapting to market noise while maintaining clarity. How It Works The indicator builds a channel around a smoothed price line. The central line reflects the current trend. The upper and lower bounda
FREE
ZigZag Reversal Detector Signals This is a technical indicator based on the ZigZag principle, designed to automatically detect market reversal points and generate clear buy and sell signals. Customizable Parameters ️: Level : Determines the sensitivity of the ZigZag to price changes. Ecart : Sets the minimum distance between two ZigZag points. Rebond : Adjusts the confirmation threshold for a reversal. Alerts & Notifications : Enable or disable according to your needs. Pe
FREE

Volumes ******************* Volumes для платформы секундных графиков Micro . ********************* Секундный график на порядок увеличит точность ваших входов и выходов. Секундный период , в привычном формате, позволит увидеть то, что ранее было скрыто. Бесплатные индикаторы, дополнят визуальную картину, что, в совокупности выведет вашу торговлю на новый уровень. Идеально подходит как скальперам, так и трейдерам торгующим внутри дня. Индикатор Volumes для платформы Micro. Входные парам
FREE
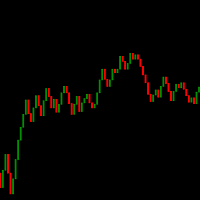
Candle de Volume Coiote O Candle de Volume Coiote é um indicador que mede a variação do volume no tempo, seu corpo é pela variação do volume anterior pelo volume atual, sua direção pelo fechamento do preço.
1. identificado um topo no indicador Candle de Volume Coiote (marcado o fechamento do preço).
2. identificado um fundo no indicador Candle de Volume Coiote (marcado o fechamento do preço).
3. fundo 3 igual fundo 2 no indicador Candle de Volume Coiote, preço no 3 é diferente de fundo 2.
P
FREE
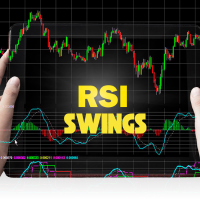
O indicador RSI Swings é uma ferramenta poderosa projetada para o MetaTrader 5 (MT5) que combina os princípios do Índice de Força Relativa (RSI) com os níveis de preços altos e baixos para aprimorar as decisões de negociação. Este indicador inovador ajuda os traders a identificar pontos de reversão potenciais no mercado, analisando as oscilações de preços em conjunto com as leituras do RSI. Características Principais Análise de Altos e Baixos : O indicador RSI Swings foca nos altos e baixos
FREE
O indicador RSI Channel Binary é uma ferramenta especializada projetada para o comércio de opções binárias, aproveitando o poder do Índice de Força Relativa (RSI) . O RSI é um oscilador de momentum que varia de 0 a 100 , ajudando os traders a identificar condições de sobrecompra e sobrevenda no mercado. No indicador RSI Channel Binary, os seguintes sinais-chave são utilizados: Sinal de Compra (CALL) : Uma opção CALL é indicada quando o RSI ultrapassa o nível de 30 . Esse movimento suge
FREE

Descubra os segredos que os grandes players não querem que você veja. Alguma vez você já se perguntou se as "baleias" do mercado sempre entram no mesmo horário e na mesma direção? Este indicador te mostra. Ele não fornece sinais de entrada, mas revela padrões históricos de movimento por hora ou dia que normalmente passariam despercebidos. Por exemplo, você pode descobrir que às quintas-feiras, às 15:00 , o EURUSD tem 80% de probabilidade de se mover para cima . É ideal para traders que desejam c
FREE
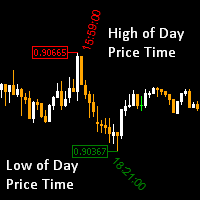
High of the Day and Low of the day Time and Price Fractal Studies is an indicator that will help you identify certain patterns that tend to repeat themseleves at certail times of the day or at certain prices.
It is used to study Daily Highs ad Lows in relation to time and price.
You will get to answer certail questions like:
At what time of day does this market usually turn around. At what price does the market turn. Is it at round numbers etc
FREE
Hi Traders, Info Panel with PnL Coloring is a compact yet powerful on-chart dashboard for MT5.
It delivers real-time insights into Buy/Sell volume, symbol-based PnL, overall account performance, margin status, and detailed candle metrics.
With dynamic color-coding and a live candle countdown, this panel helps you monitor your essential trading information and market conditions instantly so that you can make decisions with greater clarity and precision. Abbreviations (current candle information)
FREE

Plus Color Candles — Candles coloridos para MetaTrader 5 O Plus Color Candles exibe candles coloridos automaticamente de acordo com a direção de cada período. Os candles de alta, nos quais o fechamento é igual ou superior à abertura, são apresentados em verde. Os candles de baixa, nos quais o fechamento é inferior à abertura, são apresentados em rosa. O indicador preserva as informações completas de abertura, máxima, mínima e fechamento, oferecendo uma visualização limpa e direta do comportamen
FREE

Laguerre RSI Advanced Suite for MetaTrader 5 Take your technical analysis beyond standard oscillators with the Laguerre RSI Advanced Suite . Based on the work of John F. Ehlers, the Laguerre Relative Strength Index (RSI) is designed to provide superior smoothness and faster response times compared to the conventional Welles Wilder RSI. While the standard Laguerre RSI is a powerful tool, our Advanced Suite transforms it into a complete trading cockpit. It equips traders with a precision calcul
FREE

Multi-RSI: 4 RSI in 1 for Comprehensive and Fast Market Analysis Analyze market strength and momentum like a professional. Multi-RSI combines four distinct RSI indicators into a single window, providing a clear view of market dynamics across multiple timeframes. Each RSI features a configurable period to adapt to your specific trading strategies and styles. Key Features 4 RSI in one indicator: Track multiple timeframes simultaneously. Fully customizable periods: Individually adjust each RSI to f
FREE

Todo trader conhece o ritual: abrir as propriedades do indicador, mudar um número, clicar em OK, olhar torto para o gráfico, concluir que não é bem isso e abrir as propriedades de novo. Nas Bollinger Bands, o número que mais importa — o multiplicador do desvio — é justamente aquele com que ninguém experimenta, porque cada tentativa custa mais uma ida à janela de configuração. O Bollinger Live Tuner acaba com isso. Ele é um indicador Bollinger Bands completo que você ajusta direto no gráfico, ao
FREE

Close-Open A/D (CO A/D): A Cumulative Volume-Efficiency Line for Accumulation/Distribution Analysis CO A/D is a cumulative Accumulation/Distribution-style indicator built around a simple question On-Balance Volume and Chaikin A/D don't directly ask: how efficiently did each bar convert its own volume into open-to-close travel? Formula CO_raw = (Close − Open) / (High − Low) Volume = Log(TickVolume + 1) [or raw volume — selectable] CO A/D = Previous CO A/D + (CO_raw × Volume) Where OBV assigns ful
FREE

This indicator will show a vertical representation of the volume distribution within a selected user range.
This is a free version of the full product. It is limited to use on a week old data or older. Find the full product at https://www.mql5.com/en/market/product/42234 .
Main features: This Indicator will create an image that will allow viewing the tick volume per price level in a graphical form. The indicator will work on any range size in any time-frame, limited only by your computer mem
FREE

Algorion ScanMaster – Fusion Horizon Professional Multi-Symbol Confluence Scanner for MetaTrader 5 Algorion ScanMaster – Fusion Horizon is a professional multi-symbol market scanner for MetaTrader 5 that continuously monitors your watchlist and identifies the strongest trading opportunities using a proprietary 4-Factor Fusion Engine . Instead of manually switching between dozens of charts, ScanMaster analyzes multiple symbols and multiple timeframes simultaneously, ranks them by overall confluen
FREE

The Moving Averages On-Off let you control the indicator using the keyboard or a button . You can choose if you want the indicator always shown or always hided while switching among different time frames or financial instruments . ---> This indicator is part of Combo Indicator OnOff
It's possible to setup three Moving Averages : Short , Medium , Long
Input You can customize the price type used for calculation : close, open, high, low, median price, typical price, weighted It's
FREE

O Confluence Engine constrói zonas de confluência SMC com pontuação no seu gráfico. Em vez de mostrar um único tipo de sinal, ele agrupa sinais Smart Money independentes — varreduras de liquidez e níveis institucionais de tempos gráficos superiores — em zonas de preço e mostra exatamente quantos fatores coincidem em cada uma.
Ele responde à pergunta que todo trader SMC realmente faz: quantos sinais independentes concordam neste nível agora?
Como funciona:
Detecta varreduras de liquidez sobre
FREE

General Description Candle Countdown is a visual indicator for MetaTrader 5 that displays the time remaining until the current candle closes in real-time. The indicator presents information panels attached to Bid and Ask lines, showing countdown timers, current candle type, and other useful information. Key Features 1. Candle Time Display Countdown Timer : Time until candle close in MM:SS format Elapsed Time : Time since candle opening Percentage Completion : Real-time percentage of candle c
FREE

BTMM Session StopHunt Reversal Reentry Indicator (Demo)
This is a fully functional demo version of the BTMM Session StopHunt Reversal Reentry Indicator for MetaTrader 5.
The demo allows traders to experience the complete indicator logic in real market conditions before purchasing the full version.
What the Demo Includes
Full session visualization (Asian, Brinks, New York) Automatic Asian range (High / Low) and range size (R) Stop-hunt (liquidity sweep) reversal detection Entry, Sto
FREE

Swap Cost Per Position puts your open positions in one table for tonight's rollover, in money. I built it for the trader who holds overnight, to see the charge ahead beside the swap already recorded and, where the swap is quoted in points, the number of nights of positive carry the round turn takes to recover. WHAT IT SHOWS One row per open position, priced for tonight: the charge uses that position's volume, and positions beyond the row limit you set are counted on the last line. Two numbers, t
FREE

Your feedback is very valuable to us. By sharing your experience, you help us improve and provide you with better service. Thank you!
PIPnova Candle Signals: Catch the Clearest Reversal Signals in the Market! PIPnova Candle Signals is a professional MetaTrader 5 indicator designed to instantly detect critical moments in price action—namely, potential trend reversals and points of indecision. It reliably catches the most powerful and trustworthy candle patterns, Pinbars and Dojis, with custo
FREE

MAD Bands (Moving Average Deviation Bands) MAD Bands are intended to be used when you want to visually check the behavior of price volatility in relation to a moving average.
MAD_Bands (MQL5 version) parameter description This document explains the MT4 parameter input screen for each setting item (input parameter). Group: Main (basic settings) Period Default : 20 Explanation : The number of candlesticks used to calculate the moving average (Mid) and band width. The larger the value
FREE
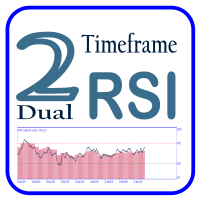
Dual Time Frame RSI with Custom Alerts & Visuals Dual Time Frame RSI is an advanced RSI (Relative Strength Index) indicator designed for traders who want to monitor multiple timeframes simultaneously and customize alerts and visuals for better trading decisions. This tool allows you to combine two RSI readings from different timeframes, helping you identify stronger trends and overbought/oversold conditions across multiple time horizons. Key Features: Two Timeframes : The lower timeframe is alwa
FREE

TrueUSD Candles is a multi-currency analytical indicator for MetaTrader 5 that plots a real-time candlestick chart of the US Dollar (USD) in a separate window and uses macro-triangulation to separate genuine US economic momentum from European market movements. The primary goal of this indicator is to eliminate the structural flaw of the classic US Dollar Index ( DXY ), which is weighted 57.6% toward the Euro (and 77.3% toward European currencies overall). Because of this heavy imbalance, any is
FREE
Moving Average Color - Indicador Inteligente para MT5 Descrição Geral O Moving Average Color é um indicador avançado que combina média móvel tradicional com sistema visual inteligente de cores. O indicador muda automaticamente as cores da média móvel e das velas (candlesticks) baseado na posição do preço em relação à média, oferecendo uma análise visual clara e instantânea da tendência do mercado. Principais Características Funcionalidades Principais: Média Móvel Configurável : Suporte a
FREE

The Previous High Low Levels indicator displays the high and low of the previous candle from a selected higher timeframe. This helps traders identify key support and resistance zones while trading on lower timeframes. Features:
Plots the previous high and low from a higher timeframe
Works on all timeframes and instruments
Helps identify strong support and resistance levels
Lightweight and does not repaint How to Use: Select a higher timeframe (e.g., H1, H4, D1) in the settings. T
FREE

BinaWin NoTouch is an indicator that sends an alert signal when the trade is in the right position to wait for the breakdown of a side market.
It is specially designed to trade under the “No Touch” strategy of the Binary.Com platform with synthetic indexes N.10, N.25, N.50, N.75 and N.100
Similarly, trading can be done with the conventional CALL and PUT strategy of any Binary Options platform.
Requirements to use the indicator:
1. Have an account at Binary.Com
2. Configure the Binary.Com d
FREE

Red Indicator by Quant Atlas Creator: https://www.quant-atlas.com/ Red Indicator is a clean reversal focused tool designed to highlight moments where price may be moving away from an extreme condition and entering a potential turning zone. The indicator uses a price derived volatility framework to detect areas where market pressure may have become stretched. When conditions align, it plots red triangle signals directly on the chart. Both bullish and bearish signals use the same red visual iden
FREE
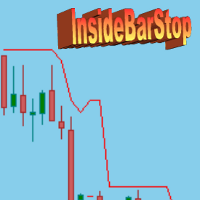
InsideBarStop Indicator for MT5
This indicator can be used to show and evaluate the trailing stop algorithm "Trailing Stop with Inside Bars" that was proposed by the famous German trader and author Michael Voigt ("Das grosse Buch der Markttechnik") to capture robust gains when trading strong price moves. The trailing stop price is shown as a red line. You can start the trailing stop anywhere on your chart (bars or candles) by setting the "initialBarDateTime" input parameter to the open time of
FREE
Mergulhe no mundo da estatística de alta precisão e da distribuição dinâmica de capital com a ferramenta avançada – PCA Arbitrage 3X . Este indicador foi criado com base na análise de componentes principais (Principal Component Analysis, PCA) , método aplicado por traders de elite para identificar padrões ocultos nos movimentos do mercado. Graças ao algoritmo avançado de Jacobi (ML) para o cálculo de autovalores e autovetores, o sistema converte dados históricos complexos em sinais claros para e
FREE

ApexForge Price Ray Marker
ApexForge Price Ray Marker is a lightweight MT5 utility designed for fast and efficient price structure analysis.
With a simple keyboard shortcut, you can instantly place horizontal price rays and price labels on candle highs or lows without manually drawing objects.
It is ideal for Price Action traders, Smart Money Concepts (SMC), ICT methodologies, support and resistance analysis, liquidity mapping, and multi-timeframe trading.
Features
Shift + Left Click → Ma
FREE

StrikeZone Macd Atr is an advanced volatility-adaptive oscillator that scales the traditional MACD using ATR.
This approach solves the common problem of conventional MACD: it does not react properly to changing volatility.
With ATR scaling, momentum becomes clearer, smoother, and more meaningful across all market conditions. Key Features 1. ATR-Scaled MACD Oscillator The indicator adjusts (MACD – Signal) by ATR ratio, allowing: Reduced noise during high-volatility periods Enhanced sensitivity du
FREE

Estadistica.mq5: O seu painel principal de negociação e análise Otimize a gestão das suas negociações com o Estadistica.mq5, o painel de controlo definitivo para os negociadores que procuram clareza e precisão. Este indicador independente permite-lhe monitorizar, em tempo real, tanto as suas posições abertas como um histórico detalhado das suas transações encerradas, tudo numa interface compacta e altamente eficiente.
Principais características: Painel abrangente para vários símbolos: Veja num
FREE

http://www.tradepositive.lat
ALGO Smart Flow Structure Indicator The ALGO Smart Flow Structure Indicator is designed for serious traders who use objective Market structure. Forget noise and slow indicators; this tool provides you with a crystal-clear, unambiguous view of structural breakouts across all timeframes. Based on the rigorous rules of the ALGO Smart Flow methodology, the indicator filters out internal structure and only shows you the Major Structural Points (Swing Points) , ensuri
FREE
Este indicador calcula quanto um símbolo moveu em termos relativos para encontrar mercados de tendência ou planos. Ele exibe qual porcentagem da faixa de preço mais recente é direcional. [ Guia de instalação | Guia de atualização | Solução de problemas | FAQ | Todos os produtos ] Um valor zero significa que o mercado é absolutamente plano Um valor de 100 significa que o mercado está totalmente em alta A linha azul significa que a faixa de preço é saudável A linha vermelha significa que a faixa
FREE
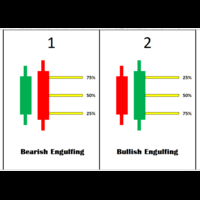
Engulfing Levels Indicator – Smart Entry Zones for High-Probability Trades Overview:
The Engulfing Levels Indicator is designed to help traders identify key price levels where potential reversals or trend continuations can occur. This powerful tool combines Engulfing Candle Patterns , Percentage-Based Levels (25%, 50%, 75%) , and Daily Bias Analysis to create high-probability trading zones . Key Features:
Engulfing Pattern Detection – Automatically identifies Bullish and Bearish Engulf
FREE

Reversal Hunter PRO – Detecção Inteligente de Pontos de Reversão no Mercado Reversal Hunter PRO é um indicador personalizado sem repaint desenvolvido para detectar zonas potenciais de reversão do mercado usando uma combinação única de: Sinais de RSI em sobrecompra/sobrevenda
Análise de picos de volume
Reconhecimento inteligente de padrões de velas ( candlestick ) Essa ferramenta é perfeita para traders que desejam confirmação antecipada de exaustão de tendência e oportunidades d
FREE

RKbots EMA Crossover is a clean, professional trend-following indicator designed for MT5, optimized for Deriv Synthetic Indices and all major forex pairs. It plots a Fast EMA and Slow EMA directly on the chart and generates clear Buy and Sell arrow signals at every crossover — no repainting, no lag beyond the EMA calculation itself. Key Features: Visual Buy () and Sell () arrow signals at EMA crossovers Fully customizable Fast and Slow EMA periods On-chart live dashboard showing trend directio
FREE
For support, visit cc.inni.cc where you will also find our Knowledge library and FAQ. PATHFINDER TREND is a complex, yet easy to manage trend indicator. It has various features that can aid in your decision making and boost your performance accuracy. Patfhinder Trend is a visually comfortable and user friendly tool that you should keep on your trading desk.
Key features Signal Detection & Trend Analysis Visually clear and decisive Early indication of signal direction with arrows Confirmed si
FREE
Este indicador é a versão convertida para MetaTrader 5 do indicador "ATR Based Trendlines - JD" do TradingView, criado por Duyck. Funcionamento:
O indicador traça automaticamente linhas de tendência de forma contínua, com base não apenas no preço, mas também na volatilidade medida pelo ATR. Dessa forma, o ângulo das linhas de tendência é determinado por (uma porcentagem do) ATR. O ângulo das linhas acompanha as mudanças de preço, seguindo o valor do ATR no momento em que o ponto pivô é detectado
FREE

The multi-timeframe indicator of the levels of the Pivot Points. Every closed daily period has its own so-called reference point - Pivot Point, which sets the levels for smaller intraday timeframes for the following day. The Pivot Points indicators existing in the codes have no method of showing the dynamics of the pivot point changes on the historical data of the price chart. Pivot Point calculation formula. Pivot=(High + Low + Close) /3 High — the maximum of the previous day; Low — the minimum
FREE
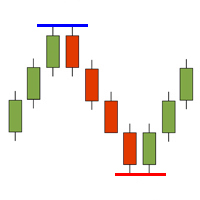
The HighsAndLowsPro indicator for MetaTrader 5 marks local highs and lows in the chart. It distinguishes between weak and strong highs and lows. The line thicknesses and colours can be individually adjusted. In the default setting, the weak highs and lows are displayed thinner, the strong ones thicker. Weak highs and lows have 3 candles in front of and behind them whose highs are lower and lows are higher. The strong highs and lows have 5 candles each.
FREE
Do you want to see the most relevant supports and resistances at a glance? Tired of tracing the levels by hand? Multi Levels Detector is an indicator for MetaTrader that will draw supports and resistances according to the parameters entered, and also offers the possibility of executing an alert every time the price reaches any of its levels.
SETTINGS UsePercentage: Allows you to configure whether the distances between levels will be measured in points, or by a percentage of the asset.
TimeFram
FREE

The TTM Squeeze is a trading strategy developed by John Carter of Trade the Markets that uses the combination of Bollinger Bands and Keltner Channels to identify periods of low volatility, followed by periods of high volatility. The strategy is based on the principle that low volatility periods are typically followed by high volatility periods and is used to identify potential trading opportunities. When the Bollinger Bands move inside the Keltner Channels, it is referred to as a squeeze, and i
FREE

This is a High-Precision Session Range Indicator designed for MetaTrader 5. It is built to help traders identify institutional liquidity zones and breakout opportunities by visualizing the "Big Three" trading sessions: Asia (Tokyo), London, and New York. Key Features: Visual Liquidity Boxes: It automatically draws shaded rectangles over the High-Low range of each session, making it easy to see where price consolidated or expanded. Intraday Price Extensions: It can project the High/Low levels of
FREE

Gives signal on daily cycle. Use H1 timeframe or lower. When day starts it looks for extremum. Better to close trade until the next day. There is only one parameter for now: maximum bars. If you have any ideas about this indicator please leave your feedback. As soon as it will grow it will be commercial. Maybe. Also parameters will be added later when I backtest it enough to ensure it is safe.
FREE

Double Line Donchian Channel MT5/Meta Trader 5 Indicator, this is customized Indicator to show only 2 Lines of Highest and Lowest PRICE line where you can add a MA (MOVING AVERAGE) for center line. What is Donchian Channel?
Donchian Channels are three lines generated by moving average calculations that comprise an indicator formed by upper and lower bands around a midrange or median band. The upper band marks the highest price of a security over N periods while the lower band marks the lowest p
FREE

About This Indicator: RSI vs SMA Oscillator: A Comprehensive Technical Analysis Tool for Better View of Market Price
The RSI vs SMA Oscillator is a powerful technical analysis tool designed to understanding Market Price Fluctuation for buy or sell signals. This user-friendly Oscillator good for both novice and experienced traders, providing valuable insights into market trends and price movements. Key Features: - RSI Cross Alert: The indicator is based on the Relative Strength Index (RSI), a pop
FREE

This indicator is based on the MACD indicator
Also, some candlestick patterns are used in it to identify better signals
Can be used in all symbols
Can be used in all time frames
Easy to use method
Adequate settings
Settings: period: The number of candles used to calculate signals. pFast: Like the MACD indicator settings pSlow: Like the MACD indicator settings
alarmShow: If you want to receive an alert in Metatrader after receiving the signal, enable this setting alarmShowNoti: If you want to
FREE

One of the best trend indicators available to the public. Trend is your friend. Works on any pair, index, commodities, and cryptocurrency Correct trend lines Multiple confirmation lines Bollinger Bands trend confirmation Trend reversal prediction Trailing stop loss lines Scalping mini trends Signals Alerts and Notifications Highly flexible Easy settings Let me know in the reviews section what you think about it and if there are any features missing.
Tips: Your confirmation line will predict tre
FREE
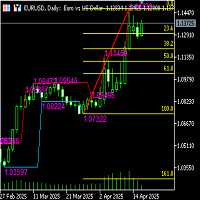
Functional description of automatic Fibonacci line indicator (including high and low channel lines) Indicator name Automatic Fibonacci retracement line + high and low channel auxiliary
Functional introduction This indicator combines the automatically identified high and low points of the band, automatically draws the Fibonacci retracement/extension line, and draws the highest and lowest price channel lines of the current analysis interval to provide traders with clearer support/resistance refe
FREE
MACD-V — Volatility-Normalized Momentum Indicator Inspired by award-winning quantitative trader Alex Spiroglou ,
the MACD-V is a powerful evolution of the classic MACD — delivering a volatility-normalized momentum framework that produces consistent, actionable signals across all securities and timeframes. While the traditional MACD measures the difference between two EMAs, the MACD-V goes a step further by dividing this difference by the market’s volatility (ATR).
This normalization makes the
FREE

O Volume é um indicador muito utilizado em análise técnica, no entanto existe uma variação que é ainda mais útil do que o Volume por si só: a média móvel do Volume.
Ele nada mais é do que uma média móvel aplicada ao popular indicador de Volume.
Como já diz o nome, o Volume + MA serve para exibir o volume transacionado (compras e vendas executadas) de certo ativo financeiro em determinado ponto do tempo juntamente com a média móvel desse mesmo volume ao longo do tempo.
Para que serve? Com o i
FREE

Analisador MTF MA: Posição do preço vs SMA/EMA/KAMA em 11 timeframes em um painel.
### Full Description:
** Diga adeus a monitorar gráficos em múltiplos timeframes!**
MiniBull Periscope - Analisador de Posição de Média Móvel Multi-Temporal
Veja o panorama completo sem abrir múltiplos gráficos! MiniBull Periscope exibe a posição atual do preço em relação às médias móveis em 11 timeframes simultaneamente - do Mensal (MN1) até 1 Minuto (M1).
**RECURSOS PRINCIPAIS:**
• 11 Timeframes em Uma
FREE
O mercado MetaTrader é um espaço, sem precedentes, para negociar robôs e indicadores técnicos.
Leia o artigo Manual do usuário da MQL5.community para saber mais sobre os serviços exclusivos que oferecemos aos traders: cópia de sinais de negociação, aplicativos personalizados desenvolvidos por freelances, pagamentos automáticos através de sistema de pagamento e a rede em nuvem MQL5.

Você está perdendo oportunidades de negociação:
- Aplicativos de negociação gratuitos
- 8 000+ sinais para cópia
- Notícias econômicas para análise dos mercados financeiros
Registro
Login
Você concorda com a política do site e com os termos de uso
Se você não tem uma conta, por favor registre-se