 MetaTrader 5
 专家
专家
 指标
指标
 程序库
程序库
 实用工具
实用工具
 窗口小部件
窗口小部件
 规则
规则
适用于MetaTrader 5的免费技术指标 - 22
 技术指标的信号外汇和股票市场的开仓交易和平仓交易起着至关重要的作用。指标的本质就是一种交易品种的数学转换,旨在预测未来的价格变化。
测试技术指标可以更有利于预测市场行为并从中获利。
技术指标的信号外汇和股票市场的开仓交易和平仓交易起着至关重要的作用。指标的本质就是一种交易品种的数学转换,旨在预测未来的价格变化。
测试技术指标可以更有利于预测市场行为并从中获利。 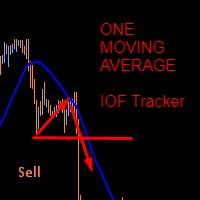
This indicator was created based on posts from forex factory thread titled There is no Magic Moving Average - You need only one - by @andose2 a.k.a Andrei Florin. If you want to know about how to use this trading strategy please go and read https://www.forexfactory.com/thread/691864-there-is-no-magic-moving-average-you.
Note: Below are extracts some of the posts .
Estabilish a trend, based on Market Cycles, then go only long in the Markup Phase and only short in the Decline phase , st
FREE
This is one of the most popular and highly rated volatility index (VIX) indicators on the market. It provides the same readings as the VIX does for stock indexes. However, this indicator works across all asset classes. VIX Fix Finds Market Bottoms. This indicator is not for inexperienced traders. Use it for day and swing trading. MT4 Version - https://www.mql5.com/en/market/product/112238 Join To Learn Market Depth - https://www.mql5.com/en/channels/suvashishfx
Bernard Baruch summe
FREE

Plus FlowProfile — MT5 买入与卖出方向区域 Plus FlowProfile 通过将分析分为买入和卖出的方向阶段,扩展了传统的 Profile 分析方式。 单独使用时,紧凑的 FLOW BUY / FLOW SELL 按钮可以快速在下方买入 Profile 和上方卖出 Profile 之间进行切换。当与 Indicator Center 或 EA Assistant 集成时,状态将直接由系统控制项进行控制。 主要功能: BUY 和 SELL 方向模式; 单独使用时提供切换按钮; 可选择使用自动或手动的更高时间周期进行分析; 方向性 POC; HVN 和 LVN 区域; 智能突出显示最重要的区域; Flow Score、置信度、质量和区域 DNA 可配置; 可视化入场区域; 买入和卖出使用独立颜色; 支持实时图表和策略测试器可视化模式; 为 Indicator Center 和 EA Assistant 提供集成功能。 该指标将订单流和成交量信息进行组织,以辅助决策。它不会自动开仓,也不保证任何结果。 指标是辅助分析工具,不构成投资建议。点差条件会根据资产、经纪商、
FREE
具有多时间框架支持、可自定义视觉信号和可配置警报系统的商品通道指数(CCI)指标。
自由编程服务、更新和其他TrueTL产品可在我的 MQL5个人资料 中获取。
非常欢迎您的反馈和评价!
什么是CCI? 商品通道指数(CCI)是由唐纳德·兰伯特于1980年开发的多功能振荡器,用于测量价格与其统计平均值的偏差。该指标将当前价格水平与特定时期的平均价格水平进行比较,揭示超买和超卖状态。 CCI主要用于识别周期性趋势和极端状态。超过+100的值表示超买状态,而低于-100的值表示超卖状态。该指标围绕零振荡,大多数值通常在+100和-100之间。交易者还会关注CCI与价格走势之间的背离,这可能预示潜在的趋势反转。 功能: 带箭头和垂直线的视觉信号标记 三个独立的信号缓冲器,具有可配置的触发条件(方向变化、水平穿越、高点/低点、极端区域) 可配置的警报(电子邮件、推送、声音、弹窗),支持时间范围过滤 具有插值方法的多时间框架(MTF)功能 多种绘图和颜色模式(直方图/线条、简单/方向/基于水平的着色) 可调整的超买/超卖水平,带可选的中间水平 通过自定义指标调用(iCustom)访问缓冲器
FREE

Quant Trend Cloud A cloud that is a regime, not a thread: the band between two slow adaptive lines. No arrows and no dots - the colour says which way the regime stands, and the brightness says whether the candle and the fast line stand clear of the band on that bar. Version 1.0. Release notes, chart examples and new product announcements are posted on the TrendTower channel: https://www.mql5.com/en/channels/trendtower What It Is The cloud is the band between Kaufman's adaptive average and VIDYA.
FREE

Pivot Points 指标 ,用于计算关键的支撑位和阻力位,适合日内交易者和波段交易者。非常适合用于识别反转点、设定目标以及在任何时间周期内进行风险管理。 适用于日内交易者
识别进出场的关键价位 设定止损和目标价位 识别潜在的日内反转 适用于波段交易者
识别周线 / 月线级别的支撑与阻力区域 规划中期持仓 辅助趋势分析 适用于剥头皮交易者(Scalpers)
为快速交易提供参考价位 在更小的时间周期上提供决策点 ...........................................................................................................
FREE

Presentation
Another indicator that makes scalping on tick charts easier, it displays an Heiken Ashi graph in Ticks.
It allows to detect entry points and trend reversals. Recommended number of ticks in a candle : 5, 13 or 21.
Parameters Ticks in candle: Number of ticks in a candle (default 5), Displays Trend arrows : displays a trend arrow based on EMA8 and EMA20 crossing, Displays MM50, Displays MM100, Max Candle (CPU): number of candles max to manage, low value will save ressources of your
FREE

Sync Master objects synchronization 1. 选择模式:
- SYNC_MASTER:仅安装在一个图表上。它将对象复制到所有具有相同代码的其他图表。
- SYNC_PEER:安装在您想要同步的每个图表上(必须是相同代码)。
2. 功能:
- 复选框:选择要同步的对象类型。
- 状态(活性/不活动):开启或关闭同步。
- 全面同步:强制立即复制所有现有对象。
- 全部删除:删除目标图表上的所有绘制对象(保留面板)。 ======================================================================
[EN] INSTRUCTIONS
======================================================================
1. CHOOSE MODE:
- SYNC_MASTER: Install on ONE chart only. It copies objects to ALL
oth
FREE
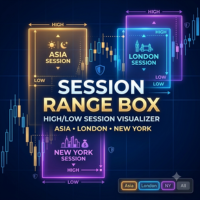
Session Range Box — Session High/Low Visualizer Overview Session Range Box draws live, color-coded rectangles on your chart marking the high and low reached during the Asia, London, and New York trading sessions. As each session unfolds, its box grows in real time to reflect the range built so far, then locks in place once the session closes. A simple on-chart control panel lets you show or hide any session instantly, so you can study one session's range in isolation or view all three overlaid a
FREE

Price breaks out. You want the continuation, but the entry usually comes too early, too late, or directly into a weak pullback.
Without structure, most traders can see the move but still cannot define where the retracement remains healthy and where the setup starts to fail.
Pullback Execution Map turns the current swing into a visual execution plan on the chart and a pullback meter below price. What it shows: Fibonacci execution pocket: Maps the active swing with a clear pullback pocket from the
FREE

Wave Breath Indicator 是一款适用于 MetaTrader 5 的 不重绘 自适应趋势流动工具。它基于典型价格 (HLC/3) 应用一快一慢两条指数移动平均线跟踪市场方向,在得到的基准线外侧包裹按波动率缩放的灵敏度通道,并锁定一个只有在收盘价穿越反向通道时才翻转的“状态型”趋势。输出是一幅干净、按颜色编码的主导趋势图:双色基准线、紧贴当前通道的水平线、填充在二者之间的半透明云层、按趋势上色的 K 线、随同向趋势连续延伸而逐步加深的背景渐变,以及标记每次确认反转的 ASCII L(多头)和 S(空头)标签。 查看 MT4 版本: Wave Breath MT4 更多产品请访问: 全部产品 想查看实盘示例和最新工具,请访问我的个人主页并添加好友,这样就不会错过任何更新! 工作原理 自适应趋势流动引擎 指标通过五个步骤构建核心视图。第一步,对每根 K 线计算典型价格(最高价 + 最低价 + 收盘价,再除以 3)。第二步,在这条序列上运行两条指数移动平均线,一条使用设定周期,另一条使用其两倍周期,然后将两条均线再平均成一条平滑的基准线。第三步,在同一长度区间上计算典型
FREE

HubDynamicTrendLine — 枢轴通道趋势线指标 本指标基于左右各 N 根 K 线(默认 15)识别严格枢轴高点与低点,将同类枢轴依次连接,构建动态的通道上下边界。 核心功能 枢轴连线 :连续枢轴高点之间、枢轴低点之间用实线连接,形成可视化通道。 斜率投影 :当相邻两个同类型枢轴的价差 ≥ 200 周期 ATR 时,从最新枢轴按该段斜率向前投影(默认 70 根 K 线),用点线标示潜在的通道延伸方向。 突破标记 :若最新收盘价穿越活跃投影线,在对应 K 线旁标注 "Up"(上破)或 "Down"(下破)。 最新枢轴水平 :以水平虚线及价格标签持续追踪最近一个高点 / 低点的价位,辅助支撑阻力判断。 输入参数 参数 说明 默认 Pivot Length 枢轴左右回看 K 线数 15 Extend Length 投影长度(K 线数) 70 Ext. Style 投影线型 Dot High Color 枢轴高点颜色 Blue Low Color 枢轴低点颜色 Lime Show Levels 显示最新枢轴水平线 true Show Breakout 显示突破方向标签 tru
FREE

Weekly Fibonacci extension levels projected from the week's open, with clean edge labels and zero per-tick overhead. Every week the market opens with a question: how far can it go? Last week's range is one of the most honest answers you have. TrendSync Weekly Fibo takes that range and projects it from the current week's open as Fibonacci extension levels, above and below, so you know where the week's natural targets and exhaustion zones are before price gets there. No manual drawing. No red
FREE

ADX Multi-TF Trend Strength ADX Multi-TF Trend Strength is a MetaTrader 5 indicator designed to help traders evaluate trend strength and directional market bias across multiple timeframes. The indicator combines ADX, DI+ and DI- readings into a clear multi-timeframe panel, allowing traders to quickly compare market conditions from lower to higher timeframes. Main Features Multi-timeframe ADX analysis ADX value for measuring trend strength DI+ and DI- values for directional analysis Bullish, Bear
FREE
DS Candle Countdown Timer V2.0 Multi-Timeframe Candle Timing Indicator for MetaTrader 5 Overview DS Candle Countdown Timer V2.0 is a MetaTrader 5 indicator that displays real-time candle countdown information directly on the trading chart. The indicator helps traders monitor remaining candle time, candle progress, and important timing events across multiple timeframes. It is designed for traders who use structured chart analysis and require a clear visual reference for candle opens and closes. V
FREE

WAIT Entry Timing WAIT stands for Weighted Analysis of Ideal Timing. WAIT Entry Timing is a decision-support indicator designed to help traders evaluate whether a detected setup may be ready for entry or whether waiting for a pullback, confirmation, or a potentially better price could be more appropriate. The indicator does not execute trades. It analyzes market conditions and presents the result through three normalized values from 0 to 100: Patience Score measures the potential benefit of wait
FREE

Rolling VWAP + ATR Bands + Market Panel — powerful visual tool for scalping, extensions detection and intraday market structure analysis.
Rolling VWAP + Panel Rolling VWAP + Panel is a professional MetaTrader 5 indicator designed to analyze market structure using a Rolling Volume Weighted Average Price (VWAP) combined with ATR-based volatility bands , a real-time market analysis panel , and an integrated candle countdown timer . This indicator provides a clear and structured view of price beha
FREE

SuperPanel Multitime 概览 SuperPanel Multitime 是一款专为 MetaTrader 5 专业交易员设计的高性能、清晰且不干扰主图表的 多周期 (MTF) 仪表盘指标。它能够在您的主图表上直接、实时地提供市场趋势健康状况和成交量数据的清晰概览,完全消除了杂乱的图表和复杂的滞后信号线。 核心功能 多周期分析: 只需一眼,即可无缝监控多个时间周期(从 M1 到 D1)的趋势。 智能趋势追踪: 依托可靠的 EMA 趋势计算,精准判断市场运行方向。 成交量与市场轮廓 (Market Profile) 洞察: 集成 Tick 成交量数据以及关键市场轮廓水平位(VAH、VAL、POC),为您提供更深层次的市场背景。 无图表视觉杂乱: 作为一个独立的图表窗口指标( #property indicator_plots 0 ),采用专业的 UI 元素( OBJ_LABEL 和 OBJ_RECTANGLE_LABEL )构建。价格柱上没有任何杂乱的线条或箭头。 现代暗黑模式界面 (Dark Mode UI): 采用时尚、专业的暗黑美学设计,搭配高对比度的霓虹点亮色(青
FREE

Asia builds the range. London breaks it. Know the levels before it happens.
LTS Asia Range is the session-breakout indicator from LTS — Legacy Trading System . It marks the quiet Asian session, draws the exact levels where a breakout is confirmed when London and New York bring volume, projects the targets and a suggested stop, and tells you whether the H1 trend favors the buy or the sell side. Free, clean and ready on your chart before the London open.
EVERYTHING YOU NEED FOR THE BREAKOUT As
FREE

Currency Strength Flux 按相对强度对八大主要货币进行排名,数据取自最多 28 个货币对,基于四个时间周期的加权合成,并且只使用已收盘的柱。 思路很简单:用强势货币对抗弱势货币,而不是去交易今天碰巧看着顺眼的那张图。面板上的一切都服务于这一个决定。 它做什么 面板把 EUR、GBP、AUD、NZD、USD、CAD、CHF 和 JPY 从最强到最弱排列。每一个读数都建立在您的经纪商实际报价的货币对之上。每个货币对为一方加分、为另一方减分,因此八个分值始终以 50 为中心,货币篮子在构造上是零和的。 50 是篮子的平均值,而不是一条固定水平线。分值 70 并不表示该货币在绝对意义上强势,而是表示它此刻相对于其余七种货币强势。 只用收盘柱 面板上已经打印出来的数字不会再改变。 报价从位置 1 读取,因此正在形成的当前柱永远不会进入已发布的数值,当前柱对应的缓冲区位置留空。面板在最快的加权时间周期收盘时重新计算,另有一个较慢的安全间隔作为兜底。绝不在每个 tick 上计算。 页脚会注明这些数字取自哪一根柱,使用服务器时间,因此您随时可以拿自己的图表来核对任何一个读数。 四周
FREE

ProSessionBox Premium V3.1 — Daily Box + Sessions + Bollinger Bands + Trade Tracker
Transform your chart into a complete trading workspace. ProSessionBox Premium V3.1
combines session visualization, range context, Bollinger Bands, and live position
tracking — all in one clean indicator.
--- KEY FEATURES ---
DAILY BOX
• Daily High/Low as a real Bullish/Bearish/Neutral candle
• Optional Yesterday box for range comparison
• Range label: "Range: 87 pips"
• Profit label: "$0.87 (0.01L)" with confi
FREE
MovingAverage Cloud
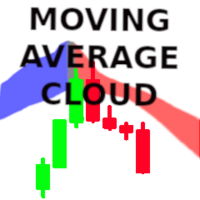
Imagine this, you want to know when all moving averages between 20 to 100 are all moving in one direction. This indicator does that. You enter in the first period of the smallest moving average, and the last period of the highest moving average. If all the moving averages are moving in the same direction, the indicator will plot the colour for that direction, e.g blue, more than half of the moving averages in that range change colour to the opposite direction, a yellow/oran
FREE

# Economic News Panel — Free Calendar & No-Trade Zone Indicator
**Know when NOT to trade — at a glance.**
Economic News Panel is a lightweight, non-repainting tool that puts MetaTrader 5's built-in Economic Calendar directly on your chart. No manual calendar checking, no external websites, no WebRequest or third-party API required — it reads straight from MT5's native calendar database.
## What it does
The panel shows, in real time: - Whether it's currently **OK TO TRADE** or you're inside
FREE
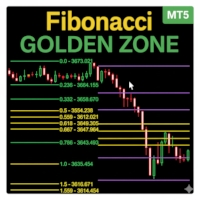
Fibonacci Sessions 指标是一款强大的交易工具,专为精准剥头皮和日内策略而设计。它会自动绘制纽约、伦敦和亚洲交易时段的关键斐波那契水平,为交易者提供主要市场时段的价格动态清晰视图。每个交易时段都会突出显示独特的“黄金区域”,这是价格最常反应的地方。这为反转、突破和趋势延续交易创造了高度可靠的区域。该指标直观展示了价格如何经常从一个黄金区域移动到另一个黄金区域,帮助交易者捕捉持续性的机会。该指标针对 XAUUSD 的 M5 时间框架进行了优化,同时在其他外汇货币对和全球指数上也表现出色。无论您交易的是黄金、外汇还是指数,这个基于交易时段的斐波那契指标都会为您提供额外优势,帮助识别高概率交易区域。主要功能:自动绘制亚洲、伦敦和纽约时段斐波那契水平;清晰显示每个时段的黄金区域;识别价格从一个黄金区域到另一个黄金区域的重复走势;优化用于 XAUUSD M5 时间框架;适用于外汇和全球指数;适合剥头皮交易者和日内交易者。 红线:极限盈利目标位 黄线:黄金区域(高概率反应区) 其他彩色线条:基于交易时段的斐波那契水平
FREE

GoldEdge ATR Price Border GoldEdge ATR Price Border is a free utility indicator designed to display dynamic ATR-based price borders directly on the chart. It helps traders visualize structured price zones, market expansion levels, and the central equilibrium line in a simple and clean format. This indicator is especially useful for traders who want to better understand market volatility and price positioning. It is also an important companion indicator for selected GoldEdge trading systems. Back
FREE
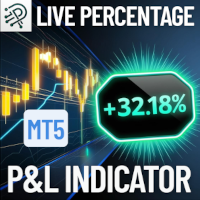
Quickly monitor your floating profit or loss as a percentage of your account balance live and always visible right on your chart! Key Features: Real-Time Calculation: Instantly calculates the combined floating profit or loss from all open trades as a percentage of your current account balance. Easy On-Chart Display: The result is conveniently shown as a label in the lower-right corner of your chart no distractions, always visible. Clear Color Coding: Green for profit, red for loss for immediate
FREE

HalfTrend Indicador Detecte cambios de tendencia con una visualización clara y automática HalfTrend Indicador es una herramienta de análisis técnico para MetaTrader 5 diseñada para identificar automáticamente cambios en la dirección del mercado mediante un algoritmo de seguimiento de tendencia. El indicador dibuja de forma dinámica la estructura de la tendencia, ayudando a reconocer posibles puntos de continuación o reversión con una representación visual sencilla y fácil de interpretar. Su dise
FREE
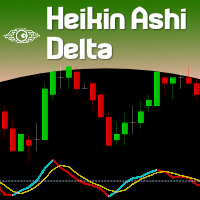
For those who love to trade using the Heikin Ashi Candlesticks, here it is a powerful ally: Heikin Ashi Delta . This indicator was presented by Dan Valcu in his book about Heikin Ashi candlesticks called " Heikin Ashi - How To Trade Without Candlestick Patterns " - and by the way this is a very cool book, we totally recommend it. Even for those of you who don't trade using Heikin Ashi candlesticks could use this Leading Indicator anyway. It is more "nervous" than let's say a Stochastic, but coul
FREE

QM FlowVision X1 Visual Multi-Factor Trading Indicator with Historical Probability, Market Flow, Momentum, Divergence and Multi-Timeframe Context QM FlowVision X1 is a visual decision-support indicator for MetaTrader 5 designed to transform multiple market conditions into a simple and readable trading state. Instead of displaying isolated oscillators without interpretation, FlowVision combines momentum, money flow, RSI, Stochastic RSI, divergence and higher-timeframe context into a unified 0–100
FREE
Based on the Extreme Trend Indicator on Trading View converted for MT5. Usage of the Indicator is free, but if you want the source code, you can purchase the source code by messaging me.
Extreme Trend is an indicator that identifies when a new trend is forming and creates a trading signal. This indicator can be used for many markets, forex, gold etc. If you have any inquiries or want to create an EA using this indicator, you can message me.
FREE

SAR Colored Indicator with Alarm – Enhance Your Trading Strategy Are you tired of constantly monitoring charts for trend reversals? Introducing the SAR Colored Indicator with Alarm – a powerful, user-friendly tool designed to transform the classic Parabolic SAR (Stop and Reverse) into a dynamic, visually intuitive, and alert-driven system. Perfect for traders of all levels, this indicator is now available in the MQL Market and ready to elevate your trading experience.
What is the SAR Colored In
FREE

Smart Money Structure XAUUSD H1 Smart Money Structure XAUUSD H1 is a technical indicator designed to help traders analyze market structure on XAUUSD (Gold) , with a primary focus on the H1 timeframe . The indicator automatically analyzes closed candles and displays various market structure elements directly on the chart. Main Features The indicator can identify and display: HH — Higher High : a higher swing high. BH : a structural level supporting bullish continuation. HB : a structural level as
FREE

AI Candle Countdown Timer keeps you constantly aware of exactly how much time is left before the current candle closes - plus a live multi-timeframe overview so you always know when every major timeframe is about to print a new bar, all in one clean on-chart panel. KEY FEATURES
- Large, always-visible countdown showing hours:minutes:seconds (or minutes:seconds) remaining until the current chart candle closes.
- Countdown text automatically turns red in the final 10 seconds before close, so you n
FREE

Gold MTF Market Dashboard Gold MTF Market Dashboard is a multi-timeframe analytical indicator designed primarily for Gold trading on the M5 chart. The indicator compares M5, M15 and M30 market conditions in a single compact dashboard: M30 provides the broader market context. M15 evaluates structure and direction. M5 provides short-term timing information. Main features Multi-timeframe trend analysis M5, M15 and M30 directional scores Bullish HH/HL and bearish LH/LL market structure EMA trend and
FREE

THE TRADER SESSION LEVELS THE TRADER Session Levels is a free MetaTrader 5 indicator designed to visualize trading sessions, analyze intraday price ranges, and identify important session levels. The indicator helps traders monitor different periods of the trading day and use the Asian range high and low in their market analysis. Key Features Four Trading Sessions — Pacific, Asia, Europe, and New York. Color-Coded Session Areas displayed directly on the chart. ASIA HIGH / LOW — automatic calculat
FREE

[Power Volume Candle] - Indicator to see the comparison of bullish and bearish volume
Volume comparison indicator on candlestick, by calculating the volume value of the specified candle history to determine the percentage of volume strength. calculates the percentage comparison of each time frame displayed on 1 screen. See other products here (MQL Algo) Forex Tools Subscribe the MQL5 channel for other interesting information : (Automatic) Forex Tools Join new Public Group to Expressing Opinio
FREE
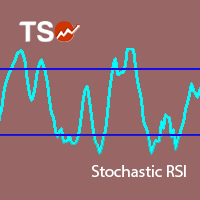
Stochastic RSI makes a stochastic calculation on the RSI indicator. The Relative Strength Index (RSI) is a well known momentum oscillator that measures the speed and change of price movements, developed by J. Welles Wilder.
Features Find overbought and oversold situations. Sound alert when overbought/oversold level is reached. Get email and/or push notification alerts when a signal is detected. The indicator is non-repainting. Returns buffer values for %K and %D to be used as part of an EA. (se
FREE

Apex Pulse – Professional Market State Dashboard by KuntahFx Transform raw market noise into crystal-clear trading decisions. Apex Pulse is a premium MT5 dashboard indicator that condenses complex market analysis into one elegant, real-time HUD. No more juggling multiple indicators — get instant insight into trend strength, momentum, volatility, liquidity positioning, and reversal danger, all in a sleek, professional dark-themed panel. Why Traders Love Apex Pulse Instantly see the true market re
FREE

Volume Weighted Average Price (VWAP) is a trading benchmark commonly used by Big Players that gives the average price a Symbol has traded throughout the day. It is based on both Volume and price. Additionally we put in this indicator the MVWAP (Moving Volume Weighted Average Price). For those who do not know the usage and the importance od this indicator I recommend a great article about this subject at Investopedia ( https://www.investopedia.com/articles/trading/11/trading-with-vwap-mvwap.asp
FREE

Trend Direction Filter: 我们可以将其定义为一种专业指标,旨在识别市场的主导方向,帮助交易者理解整体背景并更加有意识地操作。 它不是入场指标,而是一种高级方向过滤器,设计用于突出趋势结构并减少市场噪音的影响。 如何运作
该指标通过一种先进的平滑结构分析价格行为,能够区分: 明确的方向性阶段 放缓或过渡阶段 市场犹豫阶段 结果是对主导方向的清晰且稳定的呈现,有助于评估操作所处的背景。 视觉解读
Trend Direction Filter 使用一种简单但极具信息量的图形表示: 深绿色线
代表市场的主要方向。
当它向上倾斜时,表示正在形成上涨结构;当它失去斜率时,表示推动力减弱。 绿色虚线
表示上涨趋势增强。
它出现在主要深绿色线之上,突出显示运动表现出更大稳固性和连续性的阶段。 红色线
突出显示上涨趋势力量的丧失。
它不代表下跌阶段,而是表示市场可能放缓或进入过渡。 清晰度和视觉整洁
Trend Direction Filter 的主要优势之一是它显示市场方向的清晰度。 该指标旨在提供一种简洁且没有多余元素的可视化,使背景能够被立即且无歧义地读取。
这种图形整洁性有
FREE

MTF VWAP Dashboard and Signal Suite Short Description: Multi-Timeframe VWAP Dashboard with automatic 7-level confluence buy/sell arrows for Forex, Gold, and Indices. Description: The MTF VWAP Dashboard & Signal Suite is a professional institutional trading tool designed to give traders instant multi-timeframe volume bias across 7 key timeframes simultaneously. By combining Anchored VWAPs (Monthly, Weekly, Daily) with Intraday VWAPs (H4, H1, M15, and Current Chart), this suite eliminates guesswor
FREE

This indicator is the mql version of the Smoothed Heiken Ashi Candles. Find out more here: https://www.mql5.com/en/users/rashedsamir/seller Heikin-Ashi charts resemble candlestick charts , but have a smoother appearance as they track a range of price movements, rather than tracking every price movement as with candlesticks.
Because the Heikin Ashi candlesticks are calculated based on averages, the candlesticks will have smaller shadows than a regular Japanese candlestick. Just like with
FREE

Investment Castle Combined — Three Indicators, One Clear View
The Combined indicator merges three of our tools — including the multi-timeframe Bands indicator — into a single, clear multi-timeframe view, so you can read trend, structure and momentum without cluttering your chart. Exclusive to the MQL5 Market.
What it does for you Three indicators in one: a unified multi-timeframe reading on a single chart. Multi-timeframe by design: see what matters across timeframes at a glance. Cleaner chart
FREE

Summary A lightweight utility for MetaTrader 5 that displays key session levels and calculates position size based on risk percentage and stop loss distance. Designed for traders who want fast decision-making without cluttering their charts.
Features • Displays previous day high and low & daily dividers • Optional Asian, London, and New York session ranges • Automatic lot size calculator based on risk percentage • Works on any symbol or timeframe • Lightweight and optimized for low CPU usage •
FREE

======================================================== GOLD WAVE LEVELS (ELLIOTT-ALIGNED) - MQL5/MT5 MARKET DESCRIPTION (formatting: **bold** = Bold button; lines with • = bullet list; UPPERCASE = heading) ========================================================
OVERVIEW ------------------------------------------------------- **Gold Wave Levels** draws a tested wave backbone for gold and validates signals against **Elliott theory hard-rules**, with higher-timeframe context and per-timeframe
FREE

Introduction The Parabolic SAR (Stop and Reverse) indicator is a technical analysis tool designed to identify potential trend reversals and provide trailing stop-loss levels. This enhanced version of the standard Parabolic SAR for MetaTrader 5 offers improved visual clarity, customizable alerts, and an optional trend confirmation filter to assist traders in their analysis. Features Enhanced Visualization: Displays Parabolic SAR dots in two distinct colors (Lime for uptrends, Red for downtrends)
FREE

Fibonacci Pro Fibonacci Pro is an automatic Fibonacci indicator for MetaTrader 5 designed to identify the current market movement and draw clean retracement and extension levels directly on the chart. It detects the relevant swing high and swing low of the active move, then plots key Fibonacci levels with clear labels, making it easier to analyze pullbacks, continuation zones, and potential reaction areas. Main Features Automatic Fibonacci drawing based on the current market movement Detects swi
FREE
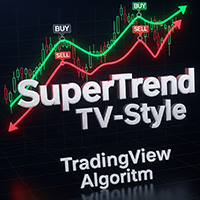
SuperTrend TV-Style replicates the classic SuperTrend indicator from TradingView, now available for MetaTrader. It uses ATR-based volatility to detect trend direction and plot dynamic buy/sell zones on the chart. Green line: uptrend Red line: downtrend Arrows: buy/sell signals at trend shifts Customizable source price (HL2, HLC3, etc.) and ATR method Simple, fast, and familiar - ideal for traders switching from TradingView or looking for a clean trend-following tool.
FREE

Daily Support and Resistance Levels 是一款专业指标,基于经典枢轴点方法自动计算并显示日内交易关键价格水平。 主要功能: 自动计算枢轴点(PP) 三个阻力位(R1, R2, R3) 三个支撑位(S1, S2, S3) 显示前一天高点/低点 实时信息面板 市场趋势方向(多头/空头)提示 显示与最近价格水平的距离 完全自定义颜色与样式 每日自动更新 支持所有周期 计算方法:基于昨日最高价、最低价、收盘价的经典枢轴点算法。 交易用途: 支撑/阻力反弹交易 突破策略 区间震荡交易 市场方向判断 盈利目标设置 使用方法: 将指标加载到图表 自动生成水平线 价格 > PP = 多头倾向 价格 < PP = 空头倾向 S1-S3 = 支撑区域 R1-R3 = 阻力区域 自定义设置: 枢轴点/支撑/阻力颜色 线条宽度与样式 显示/隐藏价格标签 显示/隐藏信息面板 面板位置与字体大小 显示/隐藏前日高低点 优点: 专业界面 无重绘 资源占用低 支持所有经纪商 适合剥头皮与日内交易 免费用于展示我的MQL5能力 如果喜欢,请留下评价。
FREE

Multi Time Frame Dashboard A free, standalone MetaTrader 5 indicator that brings trend classification and RSI readings for the current chart symbol into one customizable panel. What the dashboard displays Four supported timeframes: M15, H1, H4 and D1. Choose which rows to display in the inputs. Five trend states: Strong Bullish, Weak Bullish, Neutral, Weak Bearish and Strong Bearish, based on price and EMA ordering under the documented rules introduced in version 1.22. Default EMA periods: 21,
FREE

Price Volume Trend (PVT) Oscillator Description: The PVT Oscillator is a volume indicator that serves as an alternative to the standard On-Balance Volume (OBV). While ordinary volume indicators can be noisy and hard to read, this tool converts volume flow into a clear Histogram Oscillator, similar to a MACD, but for Volume. It is designed to detect first Trend Reversals and Divergences by analyzing the difference between a Fast and Slow PVT moving average. Why is this better than standard OBV?
FREE
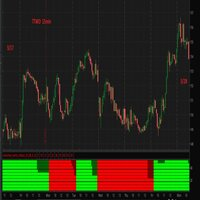
I think you all know Donchian Channels. so I am not going to write about it.
With this indicator I tried to create Donchian Trend Ribbon by using Donchian Channels.
How it works ?
- it calculates main trend direction by using the length that is user-defined. so you can change it as you wish
- then it calculates trend direction for each 9 lower lengths. if you set the length = 20 then the lengths are 19, 18,...11
- and it checks if the trend directions that came from lower lengths is same
FREE

AI Session Volatility Meter shows you at a glance which trading session - Asian, London or New York - has been delivering the most movement lately, by displaying each session's average range in points directly on your chart. No more guessing which part of the day to focus on for your strategy. The indicator continuously tracks the high and low reached during each configured session window over a rolling number of days, averages the results, and updates a simple on-screen panel once per new bar s
FREE
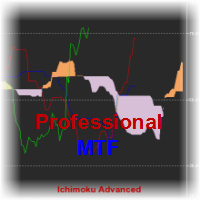
Ichimoku Kinko Hyo is a purpose-built trend trading charting system that has been successfully used in nearly every tradable market. It is unique in many ways, but its primary strength is its use of multiple data points to give the trader a deeper, more comprehensive view into price action. This deeper view, and the fact that Ichimoku is a very visual system, enables the trader to quickly discern and filter "at a glance" the low-probability trading setups from those of higher probability. This i
FREE

Core Features (What You’re Actually Getting) This indicator is designed to do one thing really well: show you where institutions actually traded — and keep those levels organized, clean, and tradable. Here’s what it includes: Automatic Order Block Detection
Finds real consolidation zones automatically — no manual drawing, no guessing. Smart Volume Filtering
Uses volume to separate real institutional activity from random noise. Every block shows a clear multiplier (like 2.3x, 3.1x, etc) s
FREE

The Market Runs on Round Numbers. The Dynamic Sweet Spots Grid (developed by Ghost Writer) reveals these institutional zones automatically. Unlike legacy grid indicators that require you to manually guess the correct pip-step for every single chart, this indicator features a "Ghost Writer" dynamic engine. It instantly detects the asset you are trading and scales the grid to perfectly match the asset's magnitude. The 3-Tier Institutional System The indicator breaks down standard price movements
FREE

Gann Hilo — Precision and Clarity in Trend YouTube Channel: @BotPulseTrading
GannHilo is a technical indicator designed to identify precisely and visually trend changes in the market. Combining price structure with Gann theory, this system draws dynamic lines that act as smart guides of direction and support . Its minimalist design and optimized algorithm allow for a clean and effective reading, showing exactly when momentum shifts direction without noise or unnecessary delays. Ideal for both
FREE
This indicator was developed to support multiple timeframe analysis. In the indicator settings, the user can set the color, width, and style of the horizontal lines for each timeframe. This way, when the horizontal lines are inserted into the chart, they will be plotted with the timeframe settings.
MTF Lines also allows visibility control of another objets like rectangles, trend lines and texts.
This is a product developed by Renato Fiche Junior and available to all MetaTrader 4 and 5 users!
FREE

MT5 Version : Pre Note : The indicator uses the Open price value for calculations.
This indicator represents a genuine momentum oscillator according to the true definition of "Momentum", and as realised by the techniques of digital filters. Scholarly papers on the subject by the current developer can be found here and here , but in this description we shall borrow only the minimum of conceptual and mathematical framework needed. In the process, we expose some long-held myths about indica
FREE

MarketProfileShadow MarketProfileShadow 是一款基于交易时段(Session)的 MT5 成交量分布(Volume Profile)指标,用于可视化预定义交易时段内的成交量分布情况。该指标计算并绘制 Point of Control (POC) 、 Value Area High (VAH) 和 Value Area Low (VAL) ,并对 Value Area 区域进行高亮显示。 该指标经过性能优化:正在进行中的交易时段仅每 5 分钟 更新一次,而已结束的交易时段不会再次计算。 使用说明 MarketProfileShadow 主要针对 5 分钟图(M5) 开发,在该时间周期下能够最有效地反映市场接受度、成交量分布以及交易时段分析。 该指标适用于 M30 及以下 的时间周期。随着时间周期的增大,不同市场阶段和交易活动会逐渐混合,因此交易时段成交量分布的分析价值会相应降低。 因此,不建议在 M30 以上 的时间周期中使用该指标,因为在这些周期下,成交量分布通常已无法提供额外的分析价值, 除非您的分析重点是 Value Area Low、Valu
FREE
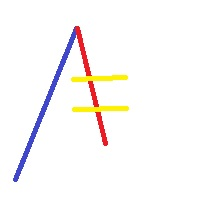
Mouse You can draw fibonaccis moving the mouse over the zigzag indicator Pin them You can click on fibonacci with this option and it will no longer be deleted unless you click on it again :) Precision The tuned fibonacci gets the precise point in lower timeframes Enjoy it You can ask me for add more features, so please comment and leave your ranting for me to be happy, thank you :)
FREE

Auto Fibonacci displays the 38.2, 61.8, and 78.6 Fib levels directly on the chart, helping traders who use these key retracement zones consistently for trade planning or confluence. Drawing Fibonacci levels manually over and over again can take time, especially when done with wick-to-wick precision. Auto Fibonacci removes that friction by detecting the latest trend leg and placing the main Fibonacci levels automatically. Key Benefits Shows only the major Fibonacci levels to keep the chart clean
FREE

Vwap Candles Matrix See what price alone cannot show. Vwap Candles Matrix is a professional market-flow analysis system for MetaTrader 5, created to transform complex volume and directional information into a clear visual structure. This is not a conventional buy/sell indicator. It is an analytical framework designed to reveal market participation, directional pressure, liquidity behavior and flow structure through a proprietary synthetic candle environment. Instead of adding more noise to the c
FREE

Harmonic Sniper Pro – The Ultimate Harmonic Pattern Scanner Unlock the power of precision geometric trading with Harmonic Sniper Pro. This professional-grade indicator automatically detects high-probability harmonic patterns (Gartley, Bat, Butterfly, Crab, Shark, Cipher, and ABCD) with AI-powered filtering and advanced trade management features. Designed for both scalpers and swing traders, Harmonic Sniper Pro eliminates the guesswork by providing clear entry zones, stop losses, and take profit
FREE
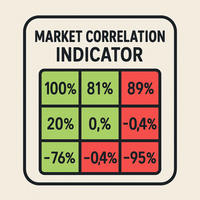
总体描述
该指标实时计算多个金融工具之间的皮尔逊相关系数。它显示一个动态相关性矩阵,用于展示货币、指数、股票和大宗商品之间关系的强度和方向。 主要参数 SymbolsList : 需要比较的工具列表(用逗号分隔) BarsToAnalyze : 用于计算的历史K线数量 TimeFrame : 相关性分析的时间周期 相关性解释 接近 +1.00 的值表示强正相关 接近 -1.00 的值表示强负相关 接近 0.00 的值表示弱相关或无相关 交易优势 监控持仓之间的相关性以降低过度暴露风险 识别投资组合中的多样化机会 支持对冲和套利策略 通过跨市场分析验证交易信号 重要提示
该指标适用于交易终端中的所有金融工具,支持日内、日线及更高级别的时间周期。内置的颜色编码系统可帮助快速识别强相关、弱相关和负相关。 关键词
mt5相关性指标, 外汇相关性, 相关性矩阵, 跨市场分析, 货币对相关性, 市场相关性, 多资产交易, 风险管理, 投资组合多样化, 外汇对冲, 套利交易, 指数相关性, 股票相关性, 大宗商品相关性, 负相关性, 正相关性, 皮尔逊系数, 金融工具相关性, 交易相关性分析
FREE

1. SYSTEM OVERVIEW The BAGAYODA TREND indicator is a highly advanced, multi-asset trend-following system designed for MetaTrader 5. It is built to generate precise entry signals with a strict 100% No-Repaint policy. The core engine combines two Parabolic SAR (Stop and Reverse) indicators running at different frequencies: a highly reactive trigger (Fast SAR) filtered by a strong underlying macroeconomic trend (Big SAR). Signals are only generated when both align, filtering out market noise.
FREE

I spent months searching for a complete ICT Kill Zone panel for MT5 and could never find one that had everything in a single indicator. So I built it myself and have been using it on live markets every day.
This is the panel I always wanted but could never find.
SESSION BOXES
Five ICT Kill Zones drawn automatically on your chart:
- Asia Kill Zone (20:00 - 00:00 NY Time) - London Kill Zone (02:00 - 05:00 NY Time) - NY AM Session (09:30 - 11
FREE

RadarSignal XAUUSD — Multi-Timeframe Radar Dashboard for Gold Trading Stop guessing where Gold is heading. Let the Radar scan it for you. RadarSignal XAUUSD is a multi-timeframe technical dashboard built specifically for XAUUSD (Gold) traders who want a single, clean, visual answer to three questions every trade requires: Where do I enter? Where is my safe invalidation zone? Where is my realistic target? Instead of flipping between five indicators on three charts, RadarSignal fuses ADX, RSI, CCI
FREE
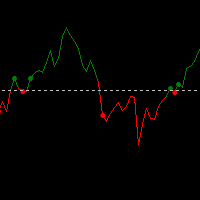
This trading strategy is built around Open-Close Crossovers , a method of analyzing price movement based on the relationship between a bar's open and close prices. The system is designed to identify potential entry and exit points when these values cross over each other. Setup and Customization The strategy's performance can be customized by adjusting the resolution. A higher resolution, typically 3-4 times that of the chart , may be used to identify crossover signals earlier. However, this can
FREE

UT Bot Alert FVG turns the popular UT Bot (ATR trailing stop) into a complete all-in-one decision panel. Arrows and alerts confirm at candle CLOSE: they do NOT repaint.
It colors the trend, draws a smooth flicker-free trailing line, fires clear Buy/Sell signals, marks Fair Value Gap zones, and shows you the real state of the market at a glance — trend, volatility, and the balance between buy and sell volume.
UT Bot trend engine - Candles colored by UT phase (bullish / bearish) so you read th
FREE
MetaTrader市场提供了一个方便,安全的购买MetaTrader平台应用程序的场所。直接从您的程序端免费下载EA交易和指标的试用版在测试策略中进行测试。
在不同模式下测试应用程序来监视性能和为您想要使用MQL5.community支付系统的产品进行付款。
