 MetaTrader 5
 Experts
 Indicadores
 Bibliotecas
 Utilitários
 Widgets
 Regras
Conheça o Mercado MQL5 no YouTube, assista aos vídeos tutoriais
Como comprar um robô de negociação ou indicador?
Execute seu EA na
hospedagem virtual
hospedagem virtual
Teste indicadores/robôs de negociação antes de comprá-los
Quer ganhar dinheiro no Mercado?
Como apresentar um produto para o consumidor final?
Indicadores Técnicos Grátis para MetaTrader 5 - 22
 É com base nos sinais de indicadores técnicos que se aplicam as decisões para abertura ou fechamento de uma transação nos mercados de ações e Forex. A essência dos indicadores reside na previsão de mudanças de preço, com base na conversão matemática de preço e/ou volumes de um instrumento financeiro.
Teste os indicadores técnicos para prever melhor o comportamento do mercado e lucrar com isso.
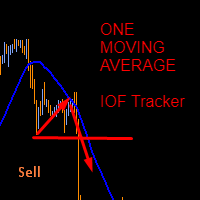
This indicator was created based on posts from forex factory thread titled There is no Magic Moving Average - You need only one - by @andose2 a.k.a Andrei Florin. If you want to know about how to use this trading strategy please go and read https://www.forexfactory.com/thread/691864-there-is-no-magic-moving-average-you.
Note: Below are extracts some of the posts .
Estabilish a trend, based on Market Cycles, then go only long in the Markup Phase and only short in the Decline phase , st
FREE
This is one of the most popular and highly rated volatility index (VIX) indicators on the market. It provides the same readings as the VIX does for stock indexes. However, this indicator works across all asset classes. VIX Fix Finds Market Bottoms. This indicator is not for inexperienced traders. Use it for day and swing trading. MT4 Version - https://www.mql5.com/en/market/product/112238 Join To Learn Market Depth - https://www.mql5.com/en/channels/suvashishfx
Bernard Baruch summe
FREE

Plus FlowProfile — Zonas Direcionais BUY e SELL para MT5 O Plus FlowProfile amplia a leitura tradicional de perfil ao separar a análise em estágios direcionais de compra e venda. No uso individual, o botão compacto FLOW BUY / FLOW SELL permite alternar rapidamente entre o perfil inferior de compra e o perfil superior de venda. Quando integrado ao Indicator Center ou ao EA Assistant, o estado é comandado diretamente pelos controles do sistema.
Principais recursos:
- modos direcionais BUY e SEL
FREE
Indicador Commodity Channel Index (CCI) com suporte multi-timeframe, sinais visuais personalizáveis e sistema de alertas configurável.
Serviços de programação freelance, atualizações e outros produtos TrueTL estão disponíveis no meu perfil MQL5 .
Feedbacks e avaliações são muito apreciados!
O que é o CCI? O Commodity Channel Index (CCI) é um oscilador versátil desenvolvido por Donald Lambert em 1980 que mede o desvio do preço em relação à sua média estatística. O indicador compara o nível de
FREE

Quant Trend Cloud A cloud that is a regime, not a thread: the band between two slow adaptive lines. No arrows and no dots - the colour says which way the regime stands, and the brightness says whether the candle and the fast line stand clear of the band on that bar. Version 1.0. Release notes, chart examples and new product announcements are posted on the TrendTower channel: https://www.mql5.com/en/channels/trendtower What It Is The cloud is the band between Kaufman's adaptive average and VIDYA.
FREE

Indicador de Pivot Points que calcula níveis de suporte e resistência essenciais para day traders e swing traders. Ideal para identificar pontos de reversão, definir alvos e gerenciar riscos em qualquer timeframe.
Para Day Traders Identifica níveis-chave para entradas e saídas Defina níveis de stops e alvos Reconhece potenciais reversões intraday Para Swing Traders
Identifica zonas de suporte/resistência semanais/mensais Planeja posicionamentos de médio prazo Complementa análises de tendênc
FREE

Presentation
Another indicator that makes scalping on tick charts easier, it displays an Heiken Ashi graph in Ticks.
It allows to detect entry points and trend reversals. Recommended number of ticks in a candle : 5, 13 or 21.
Parameters Ticks in candle: Number of ticks in a candle (default 5), Displays Trend arrows : displays a trend arrow based on EMA8 and EMA20 crossing, Displays MM50, Displays MM100, Max Candle (CPU): number of candles max to manage, low value will save ressources of your
FREE

Sync Master objects synchronization
1. ESCOLHER MODO:
- SYNC_MASTER: Instalar apenas em UM gráfico. Copia objetos para TODOS
os outros gráficos com o MESMO símbolo.
- SYNC_PEER: Instalar em CADA gráfico que deseja sincronizar (mesmo símbolo).
2. FUNÇÕES:
- Caixas de seleção: Escolha quais tipos de objetos sincronizar.
- Estado (Ativo/Inativo): Liga/desliga a sincronização sem remover o indicador.
- Sinc Total: Força a cópia imediata de todos os objetos existentes.
- Ap
FREE
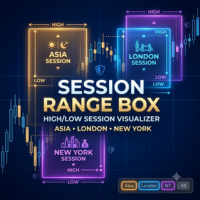
Session Range Box — Session High/Low Visualizer Overview Session Range Box draws live, color-coded rectangles on your chart marking the high and low reached during the Asia, London, and New York trading sessions. As each session unfolds, its box grows in real time to reflect the range built so far, then locks in place once the session closes. A simple on-chart control panel lets you show or hide any session instantly, so you can study one session's range in isolation or view all three overlaid a
FREE

Price breaks out. You want the continuation, but the entry usually comes too early, too late, or directly into a weak pullback.
Without structure, most traders can see the move but still cannot define where the retracement remains healthy and where the setup starts to fail.
Pullback Execution Map turns the current swing into a visual execution plan on the chart and a pullback meter below price. What it shows: Fibonacci execution pocket: Maps the active swing with a clear pullback pocket from the
FREE

Wave Breath Indicator é uma ferramenta adaptativa de fluxo de tendência que não repinta para MetaTrader 5. Ela acompanha a direção do mercado com um par de médias móveis exponenciais — uma rápida e outra lenta — aplicado ao preço típico (HLC/3), envolve a linha de base resultante com bandas de sensibilidade escaladas pela volatilidade e trava um estado de tendência que só muda quando o preço de fechamento atravessa a banda oposta. O resultado é um quadro limpo e codificado por cores do fluxo dom
FREE

HubDynamicTrendLine This indicator identifies strict pivot highs and lows based on N bars to the left and right (default 15), connecting consecutive pivots of the same type to build a dynamic channel with upper and lower boundaries. Key Features Pivot Connections : Consecutive pivot highs and pivot lows are connected with solid trend lines, forming a visible channel structure. Slope Projection : When the price difference between two consecutive pivots of the same type is at least one 200-period
FREE

Níveis de extensão de Fibonacci semanais projetados a partir da abertura da semana, com rótulos limpos na borda do gráfico e sem custo por tick. Toda semana o mercado abre com uma pergunta: até onde ele pode ir? O range da semana anterior é uma das respostas mais honestas que você tem. O TrendSync Weekly Fibo pega esse range e o projeta a partir da abertura da semana atual como níveis de extensão de Fibonacci, acima e abaixo. Assim você sabe onde estão os alvos naturais e as zonas de exaustão
FREE

ADX Multi-TF Trend Strength ADX Multi-TF Trend Strength is a MetaTrader 5 indicator designed to help traders evaluate trend strength and directional market bias across multiple timeframes. The indicator combines ADX, DI+ and DI- readings into a clear multi-timeframe panel, allowing traders to quickly compare market conditions from lower to higher timeframes. Main Features Multi-timeframe ADX analysis ADX value for measuring trend strength DI+ and DI- values for directional analysis Bullish, Bear
FREE
DS Candle Countdown Timer V2.0 Multi-Timeframe Candle Timing Indicator for MetaTrader 5 Overview DS Candle Countdown Timer V2.0 is a MetaTrader 5 indicator that displays real-time candle countdown information directly on the trading chart. The indicator helps traders monitor remaining candle time, candle progress, and important timing events across multiple timeframes. It is designed for traders who use structured chart analysis and require a clear visual reference for candle opens and closes. V
FREE

WAIT Entry Timing WAIT stands for Weighted Analysis of Ideal Timing. WAIT Entry Timing is a decision-support indicator designed to help traders evaluate whether a detected setup may be ready for entry or whether waiting for a pullback, confirmation, or a potentially better price could be more appropriate. The indicator does not execute trades. It analyzes market conditions and presents the result through three normalized values from 0 to 100: Patience Score measures the potential benefit of wait
FREE

Rolling VWAP + ATR Bands + Market Panel — powerful visual tool for scalping, extensions detection and intraday market structure analysis.
Rolling VWAP + Panel Rolling VWAP + Panel is a professional MetaTrader 5 indicator designed to analyze market structure using a Rolling Volume Weighted Average Price (VWAP) combined with ATR-based volatility bands , a real-time market analysis panel , and an integrated candle countdown timer . This indicator provides a clear and structured view of price beha
FREE

SuperPanel Multitime Overview SuperPanel Multitime is a high-performance, clean, and non-intrusive Multi-Timeframe (MTF) Dashboard indicator designed specifically for professional MetaTrader 5 traders. It provides an instant, real-time overview of market trend health and volume data directly on your main chart—completely eliminating chart clutter and complex, lagging signal lines. Key Features Multi-Timeframe Analysis: Monitor trends seamlessly across multiple timeframes (from M1 up to D1) at a
FREE

A Ásia forma a faixa. Londres rompe. Conheça os níveis antes que aconteça.
O LTS Asia Range é o indicador de rompimento de sessão da LTS — Legacy Trading System . Ele marca a sessão asiática, que é calma, desenha os níveis exatos onde o rompimento é confirmado quando Londres e Nova York trazem volume, projeta os alvos e um stop sugerido e mostra se a tendência do H1 favorece a compra ou a venda. Gratuito, limpo e pronto no seu gráfico antes da abertura de Londres.
TUDO O QUE VOCÊ PRECISA PAR
FREE

O Currency Strength Flux classifica as oito principais moedas por força relativa, a partir de até 28 pares, sobre um composto de quatro tempos gráficos que usa apenas barras fechadas. A ideia é simples: negociar uma moeda forte contra uma fraca, em vez do gráfico que por acaso está bonito hoje. Tudo o que existe no painel serve a essa única decisão. O que faz O painel ordena EUR, GBP, AUD, NZD, USD, CAD, CHF e JPY da mais forte para a mais fraca. Cada leitura é construída com os pares que a sua
FREE

ProSessionBox Premium V3.1 — Daily Box + Sessions + Bollinger Bands + Trade Tracker
Transform your chart into a complete trading workspace. ProSessionBox Premium V3.1
combines session visualization, range context, Bollinger Bands, and live position
tracking — all in one clean indicator.
--- KEY FEATURES ---
DAILY BOX
• Daily High/Low as a real Bullish/Bearish/Neutral candle
• Optional Yesterday box for range comparison
• Range label: "Range: 87 pips"
• Profit label: "$0.87 (0.01L)" with confi
FREE
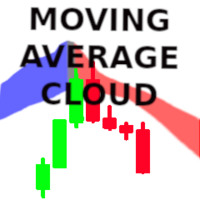
MovingAverage Cloud
Imagine this, you want to know when all moving averages between 20 to 100 are all moving in one direction. This indicator does that. You enter in the first period of the smallest moving average, and the last period of the highest moving average. If all the moving averages are moving in the same direction, the indicator will plot the colour for that direction, e.g blue, more than half of the moving averages in that range change colour to the opposite direction, a yellow/oran
FREE

# Economic News Panel — Free Calendar & No-Trade Zone Indicator
**Know when NOT to trade — at a glance.**
Economic News Panel is a lightweight, non-repainting tool that puts MetaTrader 5's built-in Economic Calendar directly on your chart. No manual calendar checking, no external websites, no WebRequest or third-party API required — it reads straight from MT5's native calendar database.
## What it does
The panel shows, in real time: - Whether it's currently **OK TO TRADE** or you're inside
FREE
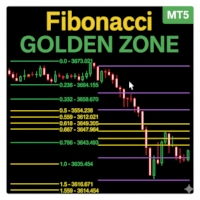
O Indicador Fibonacci Sessions é uma poderosa ferramenta de trading projetada para scalping de precisão e estratégias intradiárias. Ele traça automaticamente os principais níveis de Fibonacci para as sessões de Nova Iorque, Londres e Ásia, oferecendo aos traders uma visão clara da dinâmica do preço durante as principais sessões de mercado. Zonas exclusivas de "Ouro" são destacadas em cada sessão, onde o preço reage com mais frequência. Isso cria zonas altamente confiáveis para reversões, romp
FREE

GoldEdge ATR Price Border GoldEdge ATR Price Border is a free utility indicator designed to display dynamic ATR-based price borders directly on the chart. It helps traders visualize structured price zones, market expansion levels, and the central equilibrium line in a simple and clean format. This indicator is especially useful for traders who want to better understand market volatility and price positioning. It is also an important companion indicator for selected GoldEdge trading systems. Back
FREE
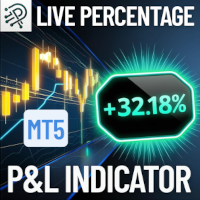
Quickly monitor your floating profit or loss as a percentage of your account balance live and always visible right on your chart! Key Features: Real-Time Calculation: Instantly calculates the combined floating profit or loss from all open trades as a percentage of your current account balance. Easy On-Chart Display: The result is conveniently shown as a label in the lower-right corner of your chart no distractions, always visible. Clear Color Coding: Green for profit, red for loss for immediate
FREE

HalfTrend Indicador Detecte cambios de tendencia con una visualización clara y automática HalfTrend Indicador es una herramienta de análisis técnico para MetaTrader 5 diseñada para identificar automáticamente cambios en la dirección del mercado mediante un algoritmo de seguimiento de tendencia. El indicador dibuja de forma dinámica la estructura de la tendencia, ayudando a reconocer posibles puntos de continuación o reversión con una representación visual sencilla y fácil de interpretar. Su dise
FREE
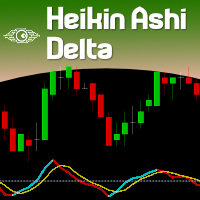
For those who love to trade using the Heikin Ashi Candlesticks, here it is a powerful ally: Heikin Ashi Delta . This indicator was presented by Dan Valcu in his book about Heikin Ashi candlesticks called " Heikin Ashi - How To Trade Without Candlestick Patterns " - and by the way this is a very cool book, we totally recommend it. Even for those of you who don't trade using Heikin Ashi candlesticks could use this Leading Indicator anyway. It is more "nervous" than let's say a Stochastic, but coul
FREE

QM FlowVision X1 Visual Multi-Factor Trading Indicator with Historical Probability, Market Flow, Momentum, Divergence and Multi-Timeframe Context QM FlowVision X1 is a visual decision-support indicator for MetaTrader 5 designed to transform multiple market conditions into a simple and readable trading state. Instead of displaying isolated oscillators without interpretation, FlowVision combines momentum, money flow, RSI, Stochastic RSI, divergence and higher-timeframe context into a unified 0–100
FREE
Based on the Extreme Trend Indicator on Trading View converted for MT5. Usage of the Indicator is free, but if you want the source code, you can purchase the source code by messaging me.
Extreme Trend is an indicator that identifies when a new trend is forming and creates a trading signal. This indicator can be used for many markets, forex, gold etc. If you have any inquiries or want to create an EA using this indicator, you can message me.
FREE

SAR Colored Indicator with Alarm – Enhance Your Trading Strategy Are you tired of constantly monitoring charts for trend reversals? Introducing the SAR Colored Indicator with Alarm – a powerful, user-friendly tool designed to transform the classic Parabolic SAR (Stop and Reverse) into a dynamic, visually intuitive, and alert-driven system. Perfect for traders of all levels, this indicator is now available in the MQL Market and ready to elevate your trading experience.
What is the SAR Colored In
FREE

Smart Money Structure XAUUSD H1 Smart Money Structure XAUUSD H1 is a technical indicator designed to help traders analyze market structure on XAUUSD (Gold) , with a primary focus on the H1 timeframe . The indicator automatically analyzes closed candles and displays various market structure elements directly on the chart. Main Features The indicator can identify and display: HH — Higher High : a higher swing high. BH : a structural level supporting bullish continuation. HB : a structural level as
FREE

AI Candle Countdown Timer keeps you constantly aware of exactly how much time is left before the current candle closes - plus a live multi-timeframe overview so you always know when every major timeframe is about to print a new bar, all in one clean on-chart panel. KEY FEATURES
- Large, always-visible countdown showing hours:minutes:seconds (or minutes:seconds) remaining until the current chart candle closes.
- Countdown text automatically turns red in the final 10 seconds before close, so you n
FREE

Gold MTF Market Dashboard Gold MTF Market Dashboard is a multi-timeframe analytical indicator designed primarily for Gold trading on the M5 chart. The indicator compares M5, M15 and M30 market conditions in a single compact dashboard: M30 provides the broader market context. M15 evaluates structure and direction. M5 provides short-term timing information. Main features Multi-timeframe trend analysis M5, M15 and M30 directional scores Bullish HH/HL and bearish LH/LL market structure EMA trend and
FREE

THE TRADER SESSION LEVELS THE TRADER Session Levels is a free MetaTrader 5 indicator designed to visualize trading sessions, analyze intraday price ranges, and identify important session levels. The indicator helps traders monitor different periods of the trading day and use the Asian range high and low in their market analysis. Key Features Four Trading Sessions — Pacific, Asia, Europe, and New York. Color-Coded Session Areas displayed directly on the chart. ASIA HIGH / LOW — automatic calculat
FREE

[Power Volume Candle] - Indicator to see the comparison of bullish and bearish volume
Volume comparison indicator on candlestick, by calculating the volume value of the specified candle history to determine the percentage of volume strength. calculates the percentage comparison of each time frame displayed on 1 screen. See other products here (MQL Algo) Forex Tools Subscribe the MQL5 channel for other interesting information : (Automatic) Forex Tools Join new Public Group to Expressing Opinio
FREE
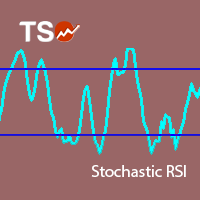
Stochastic RSI makes a stochastic calculation on the RSI indicator. The Relative Strength Index (RSI) is a well known momentum oscillator that measures the speed and change of price movements, developed by J. Welles Wilder.
Features Find overbought and oversold situations. Sound alert when overbought/oversold level is reached. Get email and/or push notification alerts when a signal is detected. The indicator is non-repainting. Returns buffer values for %K and %D to be used as part of an EA. (se
FREE

Apex Pulse – Professional Market State Dashboard by KuntahFx Transform raw market noise into crystal-clear trading decisions. Apex Pulse is a premium MT5 dashboard indicator that condenses complex market analysis into one elegant, real-time HUD. No more juggling multiple indicators — get instant insight into trend strength, momentum, volatility, liquidity positioning, and reversal danger, all in a sleek, professional dark-themed panel. Why Traders Love Apex Pulse Instantly see the true market re
FREE
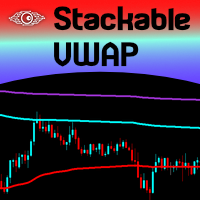
Volume Weighted Average Price (VWAP) is a trading benchmark commonly used by Big Players that gives the average price a Symbol has traded throughout the day. It is based on both Volume and price. Additionally we put in this indicator the MVWAP (Moving Volume Weighted Average Price). For those who do not know the usage and the importance od this indicator I recommend a great article about this subject at Investopedia ( https://www.investopedia.com/articles/trading/11/trading-with-vwap-mvwap.asp
FREE

Trend Direction Filter: Podemos defini-lo como um indicador profissional projetado para identificar a direção dominante do mercado, ajudando o trader a compreender o contexto geral e a operar de forma mais consciente. Não se trata de um indicador de entrada, mas de um filtro direcional avançado, estudado para evidenciar a estrutura do trend e reduzir a influência do ruído de mercado. Como funciona
O indicador analisa o comportamento do preço através de uma estrutura de smoothing evoluída, capaz
FREE

MTF VWAP Dashboard and Signal Suite Short Description: Multi-Timeframe VWAP Dashboard with automatic 7-level confluence buy/sell arrows for Forex, Gold, and Indices. Description: The MTF VWAP Dashboard & Signal Suite is a professional institutional trading tool designed to give traders instant multi-timeframe volume bias across 7 key timeframes simultaneously. By combining Anchored VWAPs (Monthly, Weekly, Daily) with Intraday VWAPs (H4, H1, M15, and Current Chart), this suite eliminates guesswor
FREE

This indicator is the mql version of the Smoothed Heiken Ashi Candles. Find out more here: https://www.mql5.com/en/users/rashedsamir/seller Heikin-Ashi charts resemble candlestick charts , but have a smoother appearance as they track a range of price movements, rather than tracking every price movement as with candlesticks.
Because the Heikin Ashi candlesticks are calculated based on averages, the candlesticks will have smaller shadows than a regular Japanese candlestick. Just like with
FREE

Investment Castle Combined — Three Indicators, One Clear View
The Combined indicator merges three of our tools — including the multi-timeframe Bands indicator — into a single, clear multi-timeframe view, so you can read trend, structure and momentum without cluttering your chart. Exclusive to the MQL5 Market.
What it does for you Three indicators in one: a unified multi-timeframe reading on a single chart. Multi-timeframe by design: see what matters across timeframes at a glance. Cleaner chart
FREE

Summary A lightweight utility for MetaTrader 5 that displays key session levels and calculates position size based on risk percentage and stop loss distance. Designed for traders who want fast decision-making without cluttering their charts.
Features • Displays previous day high and low & daily dividers • Optional Asian, London, and New York session ranges • Automatic lot size calculator based on risk percentage • Works on any symbol or timeframe • Lightweight and optimized for low CPU usage •
FREE

======================================================== GOLD WAVE LEVELS (ELLIOTT-ALIGNED) - MQL5/MT5 MARKET DESCRIPTION (formatting: **bold** = Bold button; lines with • = bullet list; UPPERCASE = heading) ========================================================
OVERVIEW ------------------------------------------------------- **Gold Wave Levels** draws a tested wave backbone for gold and validates signals against **Elliott theory hard-rules**, with higher-timeframe context and per-timeframe
FREE

Introduction The Parabolic SAR (Stop and Reverse) indicator is a technical analysis tool designed to identify potential trend reversals and provide trailing stop-loss levels. This enhanced version of the standard Parabolic SAR for MetaTrader 5 offers improved visual clarity, customizable alerts, and an optional trend confirmation filter to assist traders in their analysis. Features Enhanced Visualization: Displays Parabolic SAR dots in two distinct colors (Lime for uptrends, Red for downtrends)
FREE

Fibonacci Pro Fibonacci Pro é um indicador automático de Fibonacci para MetaTrader 5, criado para identificar o movimento atual do mercado e desenhar no gráfico os níveis de retração e extensão com clareza. Ele detecta a máxima e a mínima relevantes do movimento ativo e plota os principais níveis de Fibonacci, ajudando o trader a analisar retrações, zonas de continuação e possíveis regiões de reação do preço. Principais Recursos Desenho automático do Fibonacci com base no movimento atual Detecta
FREE
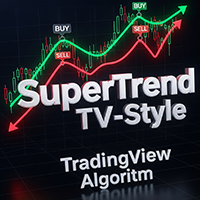
SuperTrend TV-Style replicates the classic SuperTrend indicator from TradingView, now available for MetaTrader. It uses ATR-based volatility to detect trend direction and plot dynamic buy/sell zones on the chart. Green line: uptrend Red line: downtrend Arrows: buy/sell signals at trend shifts Customizable source price (HL2, HLC3, etc.) and ATR method Simple, fast, and familiar - ideal for traders switching from TradingView or looking for a clean trend-following tool.
FREE

# DAILY SUPPORT AND RESISTANCE LEVELS - SEO OPTIMIZED DESCRIPTION
## SHORT DESCRIPTION (160 characters max)
```
Free pivot points indicator with daily support resistance levels for MT5. Perfect for intraday forex day trading and scalping strategies.
```
**Character count:** 159
**Keywords included:** pivot points, support, resistance, MT5, forex, day trading, scalping, free
---
## FULL DESCRIPTION (HTML Formatted for MQL5)
### Main Title
**Daily Support and Resistance Levels - Free Pivot
FREE

Multi Time Frame Dashboard Indicador gratuito e independente para MetaTrader 5 que reúne a classificação de tendência e o RSI do símbolo do gráfico atual em um painel personalizável. Conteúdo do painel Quatro períodos disponíveis: M15, H1, H4 e D1. Selecione as linhas exibidas nos parâmetros. Cinco estados de tendência: alta forte, alta fraca, neutro, baixa fraca e baixa forte. São baseados no preço e na ordenação das EMA segundo as regras documentadas introduzidas na versão 1.22. Períodos EMA
FREE

Price Volume Trend (PVT) Oscillator Description: The PVT Oscillator is a volume indicator that serves as an alternative to the standard On-Balance Volume (OBV). While ordinary volume indicators can be noisy and hard to read, this tool converts volume flow into a clear Histogram Oscillator, similar to a MACD, but for Volume. It is designed to detect first Trend Reversals and Divergences by analyzing the difference between a Fast and Slow PVT moving average. Why is this better than standard OBV?
FREE
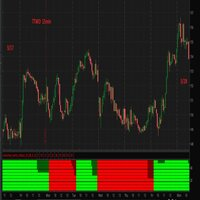
I think you all know Donchian Channels. so I am not going to write about it.
With this indicator I tried to create Donchian Trend Ribbon by using Donchian Channels.
How it works ?
- it calculates main trend direction by using the length that is user-defined. so you can change it as you wish
- then it calculates trend direction for each 9 lower lengths. if you set the length = 20 then the lengths are 19, 18,...11
- and it checks if the trend directions that came from lower lengths is same
FREE

AI Session Volatility Meter shows you at a glance which trading session - Asian, London or New York - has been delivering the most movement lately, by displaying each session's average range in points directly on your chart. No more guessing which part of the day to focus on for your strategy. The indicator continuously tracks the high and low reached during each configured session window over a rolling number of days, averages the results, and updates a simple on-screen panel once per new bar s
FREE
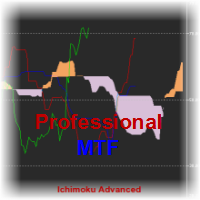
Ichimoku Kinko Hyo is a purpose-built trend trading charting system that has been successfully used in nearly every tradable market. It is unique in many ways, but its primary strength is its use of multiple data points to give the trader a deeper, more comprehensive view into price action. This deeper view, and the fact that Ichimoku is a very visual system, enables the trader to quickly discern and filter "at a glance" the low-probability trading setups from those of higher probability. This i
FREE

Core Features (What You’re Actually Getting) This indicator is designed to do one thing really well: show you where institutions actually traded — and keep those levels organized, clean, and tradable. Here’s what it includes: Automatic Order Block Detection
Finds real consolidation zones automatically — no manual drawing, no guessing. Smart Volume Filtering
Uses volume to separate real institutional activity from random noise. Every block shows a clear multiplier (like 2.3x, 3.1x, etc) s
FREE

The Market Runs on Round Numbers. The Dynamic Sweet Spots Grid (developed by Ghost Writer) reveals these institutional zones automatically. Unlike legacy grid indicators that require you to manually guess the correct pip-step for every single chart, this indicator features a "Ghost Writer" dynamic engine. It instantly detects the asset you are trading and scales the grid to perfectly match the asset's magnitude. The 3-Tier Institutional System The indicator breaks down standard price movements
FREE

Gann Hilo — Precisão e Clareza na Tendência Canal do YouTube: @BotPulseTrading O GannHilo é um indicador técnico projetado para identificar com precisão e clareza visual as mudanças de tendência no mercado. Combinando a estrutura de preço com a teoria de Gann , o sistema traça linhas dinâmicas que atuam como guias inteligentes de direção e suporte . Seu design minimalista e algoritmo otimizado permitem uma leitura limpa e eficaz , mostrando exatamente quando o impulso muda de direção, sem ruído
FREE
Este indicador foi desenvolvido para auxiliar na análise de um ativo em múltiplos tempos gráficos. Nas configurações do indicador, o usuário escolhe a cor, largura e estilo das linhas horizontais para cada tempo gráfico. Dessa forma, as linhas horizontais automaticamente terão a configuração definida para o tempo gráfico ao serem adicionadas no gráfico.
O MTF Lines também permite o controle de visibilidade de outros objetos como retângulos, linhas de tendência e textos.
Este é mais um produto
FREE

MT5 Version : Pre Note : The indicator uses the Open price value for calculations.
This indicator represents a genuine momentum oscillator according to the true definition of "Momentum", and as realised by the techniques of digital filters. Scholarly papers on the subject by the current developer can be found here and here , but in this description we shall borrow only the minimum of conceptual and mathematical framework needed. In the process, we expose some long-held myths about indica
FREE

MarketProfileShadow MarketProfileShadow é um Perfil de Volume baseado em sessões para MT5 que visualiza a distribuição do volume negociado dentro de sessões de negociação definidas. O indicador calcula e desenha o Point of Control (POC) , o Value Area High (VAH) e o Value Area Low (VAL) , além de destacar visualmente a Value Area . O indicador foi otimizado para alto desempenho: as sessões ativas são atualizadas apenas a cada 5 minutos , enquanto as sessões já concluídas não são recalculadas. Re
FREE
Este indicador colocar Fibonacci nas pernas do indicador zigzag
Parâmetros:
ZigZag Show Depth Deviation Backstep Fibonacci Show Invertido (trabalhar com o fibonacci invertido) niveis (separe as porcentagens com ",") cor estilo largura da linha usar raio o parâmetro níveis (levels) pode ser modificador com qualquer valor de porcentagem, e os valores podem ser separados por virgula Se você se interessar por esse indicador deixe um comentário para eu continuar melhorando ele
FREE

Auto Fibonacci displays the 38.2, 61.8, and 78.6 Fib levels directly on the chart, helping traders who use these key retracement zones consistently for trade planning or confluence. Drawing Fibonacci levels manually over and over again can take time, especially when done with wick-to-wick precision. Auto Fibonacci removes that friction by detecting the latest trend leg and placing the main Fibonacci levels automatically. Key Benefits Shows only the major Fibonacci levels to keep the chart clean
FREE

Vwap Candles Matrix See what price alone cannot show. Vwap Candles Matrix is a professional market-flow analysis system for MetaTrader 5, created to transform complex volume and directional information into a clear visual structure. This is not a conventional buy/sell indicator. It is an analytical framework designed to reveal market participation, directional pressure, liquidity behavior and flow structure through a proprietary synthetic candle environment. Instead of adding more noise to the c
FREE

Harmonic Sniper Pro – The Ultimate Harmonic Pattern Scanner Unlock the power of precision geometric trading with Harmonic Sniper Pro. This professional-grade indicator automatically detects high-probability harmonic patterns (Gartley, Bat, Butterfly, Crab, Shark, Cipher, and ABCD) with AI-powered filtering and advanced trade management features. Designed for both scalpers and swing traders, Harmonic Sniper Pro eliminates the guesswork by providing clear entry zones, stop losses, and take profit
FREE
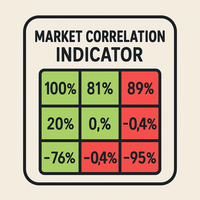
Descrição Geral
Este indicador calcula em tempo real o coeficiente de correlação de Pearson entre múltiplos instrumentos financeiros. Ele exibe uma matriz de correlação dinâmica que mostra a força e a direção das relações entre moedas, índices, ações e commodities. Parâmetros Principais SymbolsList : lista de instrumentos a comparar (separados por vírgula) BarsToAnalyze : número de barras históricas utilizadas para o cálculo TimeFrame : período de tempo para a análise da correlação Interpretaç
FREE

1. SYSTEM OVERVIEW The BAGAYODA TREND indicator is a highly advanced, multi-asset trend-following system designed for MetaTrader 5. It is built to generate precise entry signals with a strict 100% No-Repaint policy. The core engine combines two Parabolic SAR (Stop and Reverse) indicators running at different frequencies: a highly reactive trigger (Fast SAR) filtered by a strong underlying macroeconomic trend (Big SAR). Signals are only generated when both align, filtering out market noise.
FREE

I spent months searching for a complete ICT Kill Zone panel for MT5 and could never find one that had everything in a single indicator. So I built it myself and have been using it on live markets every day.
This is the panel I always wanted but could never find.
SESSION BOXES
Five ICT Kill Zones drawn automatically on your chart:
- Asia Kill Zone (20:00 - 00:00 NY Time) - London Kill Zone (02:00 - 05:00 NY Time) - NY AM Session (09:30 - 11
FREE

RadarSignal XAUUSD — Multi-Timeframe Radar Dashboard for Gold Trading Stop guessing where Gold is heading. Let the Radar scan it for you. RadarSignal XAUUSD is a multi-timeframe technical dashboard built specifically for XAUUSD (Gold) traders who want a single, clean, visual answer to three questions every trade requires: Where do I enter? Where is my safe invalidation zone? Where is my realistic target? Instead of flipping between five indicators on three charts, RadarSignal fuses ADX, RSI, CCI
FREE
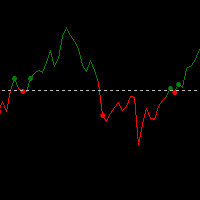
This trading strategy is built around Open-Close Crossovers , a method of analyzing price movement based on the relationship between a bar's open and close prices. The system is designed to identify potential entry and exit points when these values cross over each other. Setup and Customization The strategy's performance can be customized by adjusting the resolution. A higher resolution, typically 3-4 times that of the chart , may be used to identify crossover signals earlier. However, this can
FREE

O UT Bot Alert FVG transforma o popular UT Bot (stop dinâmico por ATR) em um painel de decisão completo, tudo em um. As setas e os alertas confirmam no FECHAMENTO do candle: NÃO REPINTAM.
Colore a tendência, desenha uma linha de acompanhamento suave e sem piscadas, gera sinais claros de Compra/Venda, marca as zonas de Fair Value Gap e mostra num relance o estado real do mercado — tendência, volatilidade e o equilíbrio entre volume comprador e vendedor.
Motor de tendência UT Bot - Candles co
FREE
O Mercado MetaTrader é o melhor lugar para vender robôs de negociação e indicadores técnicos.
Você apenas precisa desenvolver um aplicativo para a plataforma MetaTrader com um design atraente e uma boa descrição. Nós vamos explicar como publicar o seu produto no Mercado e oferecer a milhões de usuários MetaTrader.

Você está perdendo oportunidades de negociação:
- Aplicativos de negociação gratuitos
- 8 000+ sinais para cópia
- Notícias econômicas para análise dos mercados financeiros
Registro
Login
Você concorda com a política do site e com os termos de uso
Se você não tem uma conta, por favor registre-se