 MetaTrader 5
 专家
 指标
 程序库
 实用工具
 窗口小部件
 规则
适用于MetaTrader 5的免费技术指标 - 17
 技术指标的信号外汇和股票市场的开仓交易和平仓交易起着至关重要的作用。指标的本质就是一种交易品种的数学转换,旨在预测未来的价格变化。
测试技术指标可以更有利于预测市场行为并从中获利。

SnR CC Level by RWBTradeLab
A clean, non-repainting Confirmation Candle (CC) level detector for MetaTrader 5, built for price action traders who don't just want Support/Resistance levels — they want levels the market has already CONFIRMED with a proper reaction candle. Every level on the chart comes with its own confirmation, all from CLOSED candles only.
What This Indicator Does
The indicator detects 6 types of SnR CC levels. A CC (Confirmation Candle) is a candle that touches a key level w
FREE

ICT - Market Structure (MSS • BOS • IDM) - Tjmas is a 100% FREE institutional market structure mapping indicator for MetaTrader 5. It automatically identifies real-time Swing Points, Internal Inducement (IDM), Market Structure Shifts (MSS), Multi-Timeframe M5/M15 MSS, and Break of Structure (BOS) with zero repaint and zero lag. Key Features: Primary Swing Structure: Automatically labels Higher Highs (HH), Lower Lows (LL), Lower Highs (LH), and Higher Lows (HL). Internal Inducement (IDM): Maps in
FREE

哪一边是开放的? 您在 M5 或 M15 上交易黄金,但真正重要的趋势在 H1 上。ATS Gold Bias 把 H1 的情况放到您交易的图表上,您无需切换周期就能知道哪一边是开放的。 H1 偏向线 H1 的 EMA 50 逐根K线绘制在您的图表上 最近一根已收盘的 H1 K线在其上方时为绿色:允许做多 在其下方时为红色:允许做空 偏向转变处有一个圆点,并可选弹窗或推送提醒 面板 当前开放的方向,以及从何时开始(日期、小时和多久以前) H1 趋势健康度:EMA 50/200 排列、ADX 14(趋势或震荡)、距 EMA 的 ATR 倍数(超过 3 ATR 时标记为过度拉伸) 时段时钟:是否为高效时段,以及距下一个高效时段的时间 今日区间与 14 日平均区间对比,让您知道黄金已经走完了正常一天的多少 标题栏的点差检查:正常时为绿色,过宽时为红色 当前K线收盘倒计时 图表上 整个历史上都用阴影标出高效时段。阴影跟随您图表的颜色,深色或浅色 面板可拖动,有深色、浅色和自动主题,在高分辨率显示器上保持尺寸 不重绘 每个数值都来自已收盘的 H1 K线。线和圆点出现后永不移动。 给 EA 开发者
FREE

The “Color Filled MACD” indicator is based on the classic Moving Average Convergence Divergence indicator created by Gerald Appel (in the 1970s) and later improved by Thomas Aspray (in the 1980s), in this case for MQL5. It is part of the standard technical analysis library. In this case, the native MQL5 code was used as a basis, and customizable colors were added so that users can choose them for the histogram, the moving averages, and the spaces between them. The goal is to make the indicator
FREE

Fair Value Gap Finder detects fair value gaps and generates a signal when price returns to one. Set the minimum and maximum fvg size, customize the colors, style, and length, then let the indicator highlight them for you.
Key Features: Automatic FVG highlights - The indicator detects all fair value gaps that fit your criteria and marks them on the chart.
Entry Signal - A signal is created whenever price retests a fair value gap.
Notification - Alerts notify you when a fair value gap or a new
FREE
The MACD 2 Line Indicator is a powerful, upgraded version of the classic Moving Average Convergence Divergence (MACD) indicator.
This tool is the embodiment of versatility and functionality, capable of delivering comprehensive market insights to both beginner and advanced traders. The MACD 2 Line Indicator for MQL4 offers a dynamic perspective of market momentum and direction, through clear, visually compelling charts and real-time analysis.
Metatrader4 Version | All Products | Contact
FREE

Deep Momentum Analyzer 是一款由人工智能驱动的趋势检测指标,通过直观的柱状图显示市场动量,帮助交易者精准清晰地识别看涨和看跌市场状况。 概述 Deep Momentum Analyzer 使用先进的分析算法将复杂的市场数据转化为清晰可行的交易信号。这款专业级指标为交易者提供市场动量变化的即时视觉反馈,使入场和出场时机更加自信。 该指标在图表下方的单独窗口中以彩色柱状图显示市场动量: 灰色柱 = 看涨动量(潜在买入信号) 红色柱 = 看跌动量(潜在卖出信号) 这个简单的视觉系统消除了混乱,帮助交易者做出更快、更明智的决策。
按市场推荐的时间周期 市场类型 推荐时间周期 外汇 M15, M30, H1, H4
指数 M30, H1, H4, D1
加密货币 M15, H1, H4, D1
合成指数 M1, M5, M15, M30
Boom & Crash M1, M5, M15
为什么这个指标适合您 多周期分析 Deep Momentum Analyzer 使用复杂的三层分析系统,结合快速、中速和慢速周期。这种方法过滤市场噪音并识别真实的趋势方向,与单一时间框架
FREE
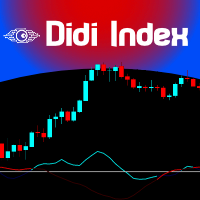
The famous brazilian trader and analyst Didi Aguiar created years ago a study with the crossing of 3 Simple Moving Averages called "Agulhada do Didi", then later was also named Didi Index, as a separate indicator. The period of those SMAs are 3, 8 and 20. As simple as that, this approach and vision bring an easy analysis of market momentum and trend reversal to those traders looking for objective (and visual) information on their charts. Of course, as always, no indicator alone could be used wit
FREE
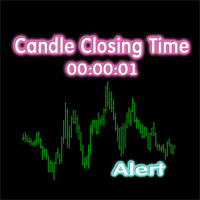
The indicator shows the time until the candle closes, as well as the server time on the current chart.
Very easy to use, with only four settings.:
Lable Location-the location of the timer on the graph;
Display server time-to show the server time or not;
Sound alert when the candle is closed-to use a sound signal when closing the candle or not;
Color-the color of the timer digits.
Other useful free and paid products can be viewed here: https://www.mql5.com/ru/users/raprofit/seller
FREE

VWAP Fibo Bands RSJ is an indicator that traces the lines of the daily VWAP and from it creates bands using Fibonacci proportions. This spectacular indicator creates 10 band levels through the selected VWAP period using Fibonacci ratios.
It is fantastic how the prices respect each level of the bands, where it is possible to realize that almost every time the price closes above / below a level of the bands he will seek the next one. If close above will seek to reach the level above and if close
FREE

KS Smart FVG With Volume Feature 是一款专为 MetaTrader 5 设计的“公允价值缺口”(FVG)指标。它将经典的 FVG 检测与成交量加权分析相结合,能更直观地反映缺口的强度背景。
核心概念
该指标用于识别公允价值缺口(FVG)——即价格出现失衡的区域,表现为 K 线形态中第 1 根 K 线的高点与第 3 根 K 线低点之间(或反之)留下的缺口。这些缺口往往具有“磁吸效应”,或充当支撑/阻力区域。
主要功能
1. 成交量加权 FVG 着色(核心亮点)
分析“位移 K 线”(即 FVG 形态中的中间那根 K 线)的成交量。
将其与过去 `InpVolMAPeriod` 根 K 线的平均成交量进行比较。
将每个 FVG 分类为:
强(高成交量)
普通(平均成交量)
弱(低成交量)
针对上涨(UP)和下跌(DOWN)的强/普通/弱 FVG,使用 6 种不同的颜色进行区分。
2. 可视化效果
原生 `DRAW_COLOR_CANDLES` 叠加显示:利用合成 K 线直接在图表上为 FVG 缺口范围着色(与价格 K 线完美对齐)。
FREE

Short Description PriceLevel LTF is an all-in-one price-structure suite for the major Forex pairs: a round-number ("big figure") reaction grid — Wall, Hot Zone, Exit, Trap — layered with volume-profile confluence, HTF Monthly/Weekly key levels, a session liquidity-sweep/stop-hunt detector, dual liquidity heatmaps, and automatic Wyckoff Method and Elliott Wave phase detection. Built and tuned for the M15 timeframe. Updates in place with no flicker and refreshes instantly on new bars and fast pri
FREE

不同货币对的行为是相互关联的。 Visual Correlation 指标允许您在一张图表上显示不同的工具,同时保持比例。 您可以定义正相关、负相关或无相关。
有些仪器比其他仪器更早开始移动。 这样的时刻可以通过叠加图来确定。
要在图表上显示工具,请在 Symbol 字段中输入其名称。
亲爱的朋友! 我们提请您注意视觉相关性指标。 主要优点及其工作原理: 不同貨幣對的行為是相互關聯的。 Visual Correlation 指標允許您在一張圖表上顯示不同的工具,同時保持比例。 您可以定義正相關、負相關或無相關。
有些儀器比其他儀器更早開始移動。 這樣的時刻可以通過疊加圖來確定。
要在圖表上顯示工具,請在 Symbol 字段中輸入其名稱。 MT4版本 https://www.mql5.com/zh/market/product/33063
FREE

本指标绘制 累积成交量差值(Cumulative Volume Delta,CVD) —— 即每根 K 线成交量按其收盘方向累加后的运行总和 —— 并将其置于自适应的标准差通道之中。它回答了一个仅靠价格无法回答的问题:这波行情是由市场参与度推动的,还是仅仅在惯性漂移? 累积总和会在您选择的 锚定周期(anchor) 重新开始 —— 每日、每周或每月 —— 因此读数始终相对于当前交易日、当周或当月,而不是相对于图表历史的起点。正是这一个设置,使同一个指标既适用于五分钟的外汇图表,也适用于日线级别的股票图表;它也正是本指标区别于普通累积成交量线的地方,后者只会从您的历史数据碰巧开始的位置一直累加下去。 工作原理 每根 K 线将自身成交量计入运行总和:收盘价高于前一根收盘价时累加,低于时扣减,收盘价持平时保持不变。默认使用跳动量。也可以选择真实成交量;若经纪商未提供,该K线将回退为跳动量。 随后在该累积序列上计算 20 周期的基准线及其标准差,上下通道则按所选的标准差倍数绘制。由于通道由序列自身的波动性构建,因此在参与度变得剧烈时自动扩张、在趋于平静时收缩 —— 无需为每个品种重新调整固定阈
FREE

Candle Density Series - Detecting Density and Streaks of Consecutive Candles
Candle Density Series is a powerful indicator from the CVET System that identifies zones of high candle density — sequences of consecutive bullish or bearish candles. It tracks and visualizes series of same-direction candles, helping traders understand the strength and persistence of the current market impulse. This is the first (free) version of the indicator, laying the foundation for more advanced density analysis
FREE

Advanced SMC & Volumetric Order Block Indicator Overview
This enhanced-grade for MetaTrader 5 indicator is designed to decode market behavior using Smart Money Concepts (SMC) method . It goes beyond standard price action analysis by integrating Volumetric Data directly into market structure, helping traders identify high-probability reversal and continuation zones with precision. Key Features Volumetric Order Blocks: A unique, split-gauge visualization within Order Block zones that disp
FREE

Trend Reversal Marker 是一款适用于 MetaTrader 5 的 不重绘 型 11 均线带趋势指标。它计算 11 条简单移动平均线(Simple Moving Averages),默认周期为 10、20、30、40、50、60、70、80、90、100 和 200 根K线,并通过 14 根K线的变化率(Rate of Change,ROC)来分析每一条均线的斜率。200 周期均线用于定义主导趋势方向。当大部分短周期均线开始向相反方向倾斜时,指标会统计有多少条均线已经反转,并将这个数量转换为 0%–90% 的反转概率,在右上角仪表盘中实时显示。两类标签——在 200 均线 ROC 穿越零轴时产生的结构型 Bull / Bear 标签,以及当计数超过用户设定敏感度阈值时产生的 ReversalBull / ReversalBear 标签——提供明确的入场和预警信号,并可通过四种告警渠道完整推送。 MT4 版本请查看: Trend Reversal Marker MT4 更多产品请访问: 全部产品 想看实盘示例和最新工具,请访问我的个人主页并添加好友,这样就不会错
FREE

TRUE SPIKES DERIV telegram channel for more information and other products: https://t.me/automated_TLabs
DM: https://t.me/gg4rex
Professional Trend-Spike Detection & Performance Tracking System for Boom & Crash Indices Download product user manual here: WHAT IS TRUE SPIKES? True Spikes is a precision-engineered trend-following indicator specifically designed to capture explosive spike movements in Boom and Crash synthetic indices. Unlike reversal-based systems, this indicator rides the m
FREE

赫尔移动平均线 (HMA) 赫尔移动平均线(Hull Moving Average)的设计初衷是在不损失平滑度的前提下,几乎完全消除滞后(Lag)。虽然简单移动平均线(SMA)反应迟钝,指数移动平均线(EMA)仍显“迟缓”,但 HMA 通过结合加权移动平均线(WMA)来预判价格走势。 反转的“魔力”(颜色显示) 该指标在每个分笔报价(Tick)中监测曲线的斜率: 看涨(绿色): 当当前 HMA 值高于前一根蜡烛的值时。这表明买方力量占据主导。 看跌(红色): 当当前 HMA 值低于前一根蜡烛的值时。这表明卖方力量占据优势。 趋势反转(Trend Reversal) 正好发生在颜色切换的点,为交易者提供直观的即时触发信号。 警报与通知 警报 (Alerts): 电脑端弹出声音窗口,确保您在处理其他事务时不会错过交易机会。 推送通知 (Push Notifications): 通过 MetaTrader 应用程序将信号直接发送到您的智能手机,让您即使不在屏幕前也能掌控市场动态。 个性化设置 切换箭头 (Toggle Arrows): 可选择开启或关闭买入/卖出箭头,保持图表的简洁与专业。
FREE
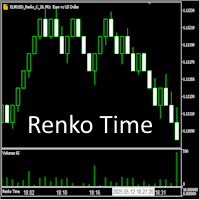
Индикатор предназначен для работы с ренко-графиками, построенными Renko Maker PRO или Renko Maker DEMO . Особенность реализации ренко-баров в терминале MetaTrader 5 такова, что из-за их вневременной природы (формирование новых баров зависит исключительно от изменения цены, а не от временных интервалов), время открытия каждого ренко-бара в истории оказывается искусственно сдвинутым в прошлое. Поэтому, чтобы видеть время открытия ренко баров, нужно воспользоваться этим индикатором Renko Time.
FREE

SNR + FVG + HTF Sweeps Levels Indicator Documentation — Version 71.10 Smart Money Concepts (SMC) / Inner Circle Trader (ICT) Methodology By Ultimate Trader Overview This indicator combines three institutional trading concepts into a single chart overlay for MetaTrader 5. It identifies where institutions sweep liquidity at key structural levels, detects the displacement (Fair Value Gap) that follows, and maps the support and resistance zones where these events occur. The result is a high-probabil
FREE
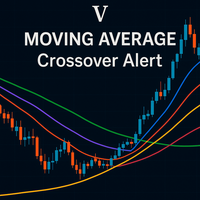
Pro MA 5 – 专业移动平均线套件 MetaTrader 5 中最完整的移动平均线系统 Pro MA 5 通过提供强大、可定制且高效的界面,以精准的操作检测趋势,彻底改变了技术分析。 什么是 Pro MA 5? 这是一款高级指标,集成了多达 5 条可配置的移动平均线 ,具有智能警报、交互式面板和优化设计,适用于任何交易品种或时间框架。它是交易者的“一站式”解决方案。 主要特点 专业多移动平均线配置 最多可同时显示 5 条移动平均线 ,每条都拥有完全控制权。 可用方法: SMA(简单移动平均线)、EMA(指数移动平均线)、SMMA(平滑移动平均线)、LWMA(线性加权移动平均线) 。 7 种适用价格: 收盘价、开盘价、最高价、最低价、中位价、典型价、加权价 。 全面定制:独立的颜色、粗细和线型。 智能警报系统 自动检测所有移动平均线组合之间的 交叉 。 屏幕上的视觉警报和 可自定义的声音 。 通过 电子邮件 和 push 通知 发送警报。 可从控制面板手动激活。 交互式控制面板 实时查看每条移动平均线的状态。 记录 最后检测到的交叉 。 亮/暗模式 界面,响应式设计并支
FREE
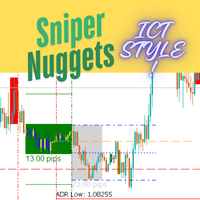
!!!!!!!! Sniper Nuggets !!!!!!!!
Sniper Nuggets is an all-in-one indicator for many things ICT style. It includes the following functionalities: Custom periods : which allow you to set custom daily period start and end times according to your taste. ADR Markers: which plots the average daily range. Worktime: which plots the various boxes on the chart for Asia range (including its high, low and midpoints, standard deviation predictions ), London open, New York open, CME open and London close.
FREE
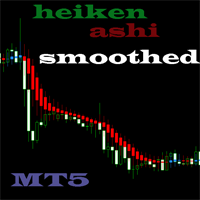
This is Heiken Ashi smoothed version, where you can choose on what type smoothness you want to make your strategy base. You can choose between EMA or MA, on the period you want. And you can choose colors.
Definition:
The Heikin-Ashi technique averages price data to create a Japanese candlestick chart that filters out market noise. Heikin-Ashi charts, developed by Munehisa Homma in the 1700s, share some characteristics with standard candlestick charts but differ based on the values used to cre
FREE

ST Adaptive Flow: Triple Confluence & KAMA Intelligence ST Adaptive Flow is a next-generation indicator designed for traders who demand surgical precision in identifying institutional flow. It is not just a moving average; it is a decision algorithm that combines KAMA (Kaufman Adaptive Moving Average) with momentum filters (RSI) and macro trend (SMA 200). The Core of the Algorithm: Dynamic Adaptive Line: Uses Kaufman’s logic to adjust to market speed. It flattens in sideways markets and slopes a
FREE
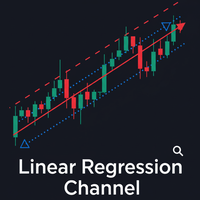
The Linear Regression Channel is a powerful technical analysis tool that helps visually identify the prevailing trend and potential price zones. Essentially, the indicator performs two main functions: It draws a trendline through the center of price action over a specified period. This line is calculated using the linear regression method, which results in the best possible "line of best fit" for the price data. From this center line, the indicator plots two parallel lines above and below, creat
FREE

The Horizontal Ray Tool is a lightweight, professional charting utility designed to streamline support and resistance mapping on MetaTrader 5. It brings rapid, one-click horizontal level placement directly to your live chart, eliminating the workspace clutter associated with infinite horizontal lines or manually drawn trendlines.
Key Features: Interactive On-Screen Button: Spawns a clean, responsive "DRAW RAY" button docked directly on your chart canvas. A single click drops an independent hor
FREE

TrendSync VWAP Lite — VWAP + Volume Profile, free TrendSync VWAP Lite shows you, at a glance, the two things that decide most intraday moves: fair value (VWAP) and where volume actually traded (Volume Profile). It is built for XAUUSD (Gold) and works on any symbol and timeframe. Clean, fast, and free.
WHAT IT SHOWS VWAP — Daily, Weekly and Monthly, each on its own anchor, so you see the fair value of the session, the week and the month at the same time. Optional labels mark each line. Volume Pr
FREE

MicroScalper Spread Monitor 是一款轻量级的机构级实用工具, 旨在保护您的交易账户免受经纪商操纵以及在高影响力新闻事件期间点差突然扩大的影响。 对于自营交易公司 (Prop Firm) 交易员和剥头皮交易者来说, 此工具是必不可少的。 它谨慎地位于您的图表上并实时监控点差。 如果经纪商将点差扩大到超出您定义的安全阈值, 监控器会立即向您发出视觉警告, 让您远离危险的市场条件。 主要特点: 实时精度: 逐点跟踪点差, 不消耗您的 VPS CPU 资源。 智能锚点 UI: 完全可定制。 放置在任何角落;它会动态调整以避免与 K 线或 EA 面板重叠。 非侵入性: 与同一图表上的任何专家顾问 (EA) 完美协同工作。 您正在寻找定制 EA 开发吗? 此工具由 Micro Scalper EA 开发。 如果您需要自动化您的个人交易策略、 为 Prop Firms 构建定制的净值保护器, 或将 TradingView Pine Script 转换为 MQL5, 请直接通过我的 MQL5 自由职业者 (Freelance) 个人资料 与我联系, 以获取专业咨询。
FREE

KCI (Kinetic Compression Index)
Advanced Volatility-Distance Engine & Probability Dashboard. The KCI Custom Oscillator is not your typical price tracking tool. It is a quantitative analytical engine that dissects the market using pure kinematics principles. Instead of simply tracking where the price moves, KCI measures how it moves—calculating velocity, energy dispersion, and trajectory efficiency using dynamic Z-Score normalization. The result is a polarized oscillator that precisely detects wh
FREE

## Описание
Индикатор SSL Hybrid является точной реализацией одноименного индикатора с платформы TradingView (автор: Mihkel00). Адаптирован для MetaTrader 5.
Индикатор относится к классу трендовых и предназначен для следования за ценой. Он объединяет в себе три уровня сигнальных линий SSL (Semaphore Signal Level), что позволяет не только определить направление тренда, но и находить точки входа, продолжения и выхода.
### Основное назначение
- Торговля по тренду на дневных и 4-часовых графика
FREE

Fibonacci Alert MT5 是一个先进的交易指标,旨在帮助交易者实时识别关键 Fibonacci 水平。通过在价格接近或突破这些关键水平时提供及时的警报,它使交易者能够做出明智的决策并优化他们的交易策略。 这个指标对新手和经验丰富的交易者都有益,因为它简化了跟踪 Fibonacci 水平的复杂任务,同时提供必要的通知以防止错过交易机会。 MQL 产品安装指南 | 在 MT5 上更新购买的 MQL 产品 | 常见故障排除指南 | 指标设置 / 指南 主要特点 快速且可回测:基于 MetaTrader 的原生 OnCalculate() 引擎构建,确保快速计算并与策略测试器完全兼容,以进行历史回测。 弹出警报:在信号事件上触发 MetaTrader 警报弹窗,确保您不会错过任何交易设置。 推送通知:实时将推送通知发送到您的 MetaTrader 移动应用,便于随时监控。 电子邮件警报:在信号事件上发送电子邮件通知,以便在远离终端时进行远程监控。 图表上的仪表板:直接在图表上显示实时信息面板,以便即时状态概览。 多时间框架支持:适用于所有标准 MetaTrader 时间框架,从
FREE

RelicusRoad Daily Pivots 是适用于 MetaTrader 4 和 MetaTrader 5 的日内枢轴价位指标,将前一日区间划分为斐波那契价位,并向上下两侧延伸,范围从负 100% 到正 200%。 指标不采用经典的地板枢轴公式,而是把前一个已完成的区间当作一把刻度尺,最低价为 0%,最高价为 100%。图表右侧以紧凑的彩色标记打印出十九个价位,因此今日行情的大小可以直接读作昨日区间的分数或倍数。 工作原理 指标取前一个已完成参考周期的最高价与最低价,并在该区间的每个比例处放置一个价位:价位 = 最低价 + 比例 x(最高价 − 最低价)。周末的 K 线会被跳过,因此周一的参考是上一个交易日。参考周期由图表周期决定。 Inside set, gray:0%、23.6%、38.2%、50.0%、61.8%、78.6% 与 100%。 Above set, green:+123.6%、+138.2%、+150.0%、+161.8%、+178.6% 与 +200%。 Below set, red:-23.6%、-38.2%、-50.0%、-61.8%、-78.6% 与
FREE

Iceberg Divergen Indicator Uncover the hidden opportunities beneath the surface.
Overview Divergences in the Awesome Oscillator (AO) often signal powerful market reversals, yet spotting them manually can be challenging and time-consuming. Missing out on these opportunities can cost traders valuable entry points. That’s why we created the Iceberg Divergence Indicator — a powerful tool that precisely detects both regular and hidden divergences in AO. With Iceberg Divergence, you won’t just id
FREE

Smart Market Structure is a clean and lightweight indicator that automatically detects and labels key market structure points in real time. It identifies: Higher High (HH)
Higher Low (HL)
Lower High (LH)
Lower Low (LL)
Break of Structure (BOS) The indicator helps traders quickly recognize trend direction, market shifts, and structural breaks without manually analyzing swing highs and lows. Features Automatic market structure detection Real-time HH / HL / LH / LL labeling Instant BOS id
FREE

Stochastic RSI-RVI Fusion Dashboard (MTF) Unlock the full "Matrix" view of the market. The Stochastic RSI-RVI Fusion Dashboard is the advanced companion to the Stochastic RSI-RVI Fusion oscillator. While the standard indicator analyzes the current chart, this Dashboard monitors the entire spectrum of timeframes simultaneously—from the 1-minute scalping noise to the monthly macro trends. Trading with a single timeframe often leads to "tunnel vision." You might buy on the H1 timeframe beca
FREE

Aroon 趋势指标说明 Aroon 趋势指标 —— 完整解读 Aroon 指标是一种强大的趋势分析工具,用于帮助交易者识别市场趋势的形成、强度以及成熟阶段。 它由两条主要线组成: Aroon Up(向上线) 和 Aroon Down(向下线) 。 这两条线根据价格距离最近一次高点或低点所经过的时间来计算,从而帮助交易者判断市场的真实动能。 当 Aroon Up 长时间保持在 100 附近,而 Aroon Down 保持在较低水平时,市场通常被视为处于强劲上升趋势。 相反,如果 Aroon Down 高企而 Aroon Up 较低,则市场可能处于强烈下跌趋势中。 因此,Aroon 指标非常适用于趋势跟随策略、突破策略以及波段交易系统。 通过观察两条线的交叉,交易者可以识别以下信号: 趋势早期反转信号 趋势延续与确认 市场横盘与低波动时期 动能衰竭区域 突破的潜在确认 与传统基于价格波动的指标不同,Aroon 更注重 基于时间的趋势力量 , 因此它往往能提供更早、更准确的趋势预警信号。 Darwinex Zero 专属折扣码 如果你正在使用 Darwinex Zero,这里提供一个 20
FREE
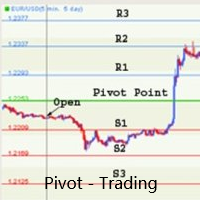
支点交易 : 1.pp 支点 2. r1 r2 r3 , s1 s2 s3 交易实用必备工具指标 波浪自动计算指标,通道趋势交易 完美的趋势-波浪自动计算通道计算 , MT4版本 完美的趋势-波浪自动计算通道计算 , MT5版本 本地跟单复制交易 Easy And Fast Copy , MT4版本 Easy And Fast Copy , MT5版本 本地跟单复制交易 模拟试用 Easy And Fast Copy , MT4 模拟账号运行 Easy And Fast Copy , MT5 模拟账号运行 合作QQ:556024" 合作wechat:556024" 合作email:556024@qq.com" 专业EA指标定制编写.
支点( pivot points) 作为一种交易策略已经很长时间了,最初是场内交易员使用这种方法。使用这种方法通过几个简单的计算就可以了解市场在一天中的去向。 支点法中的支点是一天中市场方向的转向点,通过简单地计算前日的高点、低点和收盘价,可以得到一系列点位。这些点位可能形成关键的支撑和阻力线。支点位,支撑和阻力位被统称为支点水位。 你所看到的市场每天
FREE

Overlay indicator on chart between 2 pairs
The Timeframe Overlay indicator displays the price action of timeframes on a single chart, allowing you to quickly assess different timeframes from a single chart. The advantage is to observe and follow the correlations of price movements in real time to help you find potential trades at a glance.
---- Symbol 1 ----
Symbol = EURUSD
Correlation Inverse = false
Display = true
Ratio
FREE

Donchian Channel IHS
Donchian-EMA Combined is a professional breakout indicator that merges the classic Donchian Channel with a dual EMA 34 filter (applied separately to High and Low prices), wrapped in a stunning automatic dark-theme engine that transforms your entire chart appearance the moment you attach it. The core idea is simple: Donchian Channel identifies breakout levels, while the EMA 34 filter ensures you only take breakouts that have momentum confirmation — reducing false signals in
FREE
FREE

Session Box And Timer 日内交易需要监控各大交易时段之间的过渡,然而手动重叠时间表容易出现计算错误。若没有清晰的标记,前一时段的关键价格水平和流动性区域很容易被忽略。 Session Box And Timer 直接在您的图表上直观显示交易时段、波动趋势和倒计时器。 它显示什么:
- 时段框(Session Boxes): 代表亚洲、伦敦和纽约时段的彩色矩形,标签中会显示自动计算的点数范围(pip range)。
- 亚洲时段区间水平: 亚洲时段最高价和最低价的投影向右延伸为水平线,作为日内突破的参考。
- 前一日最高价/最低价 (PDH/PDL): 标记前一天最高和最低边界 landlords 的虚线水平线。
- 时段周期线和倒计时标签: 在即将开盘的时段画出垂直线,显示距离下一时段开盘的精确剩余倒计时时间(时:分:秒)。
- 波动率热力图 (Volatility Heatmap): 图表底部的连续多色块状指标,显示过去20天的历史每小时波动率。
- 仪表板面板 (Dashboard Panel): 简洁的叠加层,显示活跃或即将到来的时段、实时倒计时、本地GMT
FREE

Plus ADX 14 — 趋势强度与方向 Plus ADX 14 是一款适用于 MetaTrader 5 的技术指标,旨在帮助用户分析市场的趋势强度以及当前占主导地位的方向。 该指标显示在独立窗口中,范围为 0 至 100,并将 ADX 与两个方向性指标 +DI 和 -DI 集成在一起。 图形元素 白色 ADX 线: 衡量趋势强度。 绿色 +DI 线: 表示正向方向强度。 红色 -DI 线: 表示负向方向强度。 20 水平线: 低强度市场运动的参考水平。 25 水平线: 主要趋势确认参考水平。 70 水平线: 高强度区域。 自动市场状态识别 Plus ADX 14 会在指标子窗口的顶部显示当前市场状态的自动分类: Consolidation: ADX 低于设定水平,或者两条方向线非常接近。 UpTrend: ADX 达到最低水平,并且 +DI 高于 -DI 。 DownTrend: ADX 达到最低水平,并且 -DI 高于 +DI 。 该分类总结的是指标当前的数学状态,并不代表自动执行买入或卖出操作。 如何解读 ADX 上升可能表示市场运动正在增强,而不代表具体的上涨或下跌方向。 可
FREE
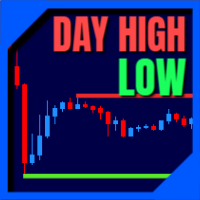
This indicator draw a line on high and low levels of X number of days. It is possible to have an alert (in the software and mobile app) for when the price breaks the high or low of the current day. Configurações: Days - past days to calculate (1 = actual day only).
Alert when reach levels - activate the alert for specific levels or both.
Push notification - enable the alert to the mobile MT5 app.
Appearance
High - high level color.
Low - low level color.
Size actual day - thickness
FREE

MT5 version of high rated Super Trend Indicator.
Indicator uses two moving averages for calculating the trend direction. Combination with other market signals and analysis is necessary and provides more stable results. Indicator can be easily customized by the user including change of colors, with and arrow sizes.
MT4 version : https://www.mql5.com/en/market/product/74549?source=Site +Profile+Seller#description
FREE

CINESE Candle Timer & Spread — 免费 MT5 指标 一款轻量、纯视觉的 MetaTrader 5 指标,显示当前 K 线的剩余时间,并在点差异常时提醒你。它从不交易,也不阻塞任何操作。 显示内容 - 图表右下角的 K 线倒计时(mm:ss)。 - 数字颜色随点差变化(相对该品种的典型点差): 绿色 — 正常(不超过 1,35x) 黄色 — 中等(不超过 2x) 橙色 — 偏高(不超过 3x) 红色 — 过度(超过 3x) 灰色 CLOSED — 市场休市 - ASK / BID 短线(上方红色、下方蓝色)位于右侧真实报价位置,仅在点差过度时显示。纯视觉,无阻塞。 如何衡量典型点差 参考值为最近 50 根 K 线的最小点差加上实时最小值,因此指标从一开始就能正确着色。 参数 - 显示计时器;X / Y 像素偏移。 - 点差阈值与计时器颜色(OK / 中等 / 偏高 / 过度 / 休市)。 - ASK/BID 短线:开关、阈值、颜色、长度、始终显示。 为什么你会喜欢它 - 运行在主图窗口,把图表留给 Expert Advisor。 - 无需 DLL、无外部文
FREE

VR 网格指示器 设计 用于创建具有用户定义设置的图形网格。与 标准网格 不同,VR 网格用于构建 圆形关卡 。根据用户的选择,轮次级别之间的步长可以是任意的。此外,与其他指标和实用程序不同,即使时间段发生变化或终端重新启动,VR Grid 也能保持网格的位置 。 设置、设置文件、演示版本、说明、问题解决,可以从以下位置获取 [博客]
您可以在以下位置阅读或撰写评论 [关联]
版本为 [MetaTrader 4] 垂直级别 基于实际时间间隔并 忽略缺失 或不存在的周期。因此,级别之间的步长严格对应于用户选择的值。 使用 VR 网格指标时,交易者 可以更改任何级别的垂直线和水平线的样式 、颜色和粗细。这使您可以控制金融工具的 回合水平 。 整数位是 以两个或多个零结尾 的价格(例如:1.23500、5.65900、1923.200)。人们相信,这样的水平 经常充当 作为支撑或阻力的强点。 Horizontal line settings Horizontal line step Horizontal line color Horizontal line style Horizonta
FREE

Stochastic MTF Dashboard (随机指标多周期仪表盘) Stochastic MTF Dashboard 是一款专为追求高效交易而设计的视觉化解决方案。它允许您在不切换当前图表的情况下,同时监控多达 6 个不同时间周期 的随机指标(Stochastic)状态。 其核心目标是消除分析中的混乱,让您瞬间掌握市场力度: 红色:超买区 —— 价格可能出现枯竭(看跌信号)。 绿色:超卖区 —— 价格可能出现回升(看涨信号)。 灰色:中性区 —— 价格处于中间震荡范围。 为什么选择这款仪表盘? 多周期清晰化: 在一个面板中同时查看从 M5 到日线(Daily)的时段,是在几秒钟内识别大趋势的理想工具。 极速读取: 无需解读复杂的线条交叉。颜色和数值会立即告知您市场的精确区域。 入场确认: 避免逆势操作。确保您的低周期入场点与高周期的市场情绪保持一致。 简洁专业的界面: 面板经过优化,美观且不占用过多工作空间。您可以自定义其位置、颜色和大小。 高性能运行: 轻量化代码设计,即使同时打开多个交易品种,也不会拖慢您的 MetaTrader 5 平台速度。 配置与同步: 指标默认配置为
FREE

Previous Day High Low and Today High Low Levels FREE
Essential breakout and support/resistance tool. Automatically draws Today High/Low and Yesterday High/Low levels with price labels.
Perfect for breakout traders, intraday and swing traders. Yesterday High/Low are key levels where price often reacts.
FREE, No DLL, Lightweight.
FEATURES: Today High and Today Low lines Yesterday High and Yesterday Low lines Price labels with values Customizable colors, line style and width Dashed l
FREE
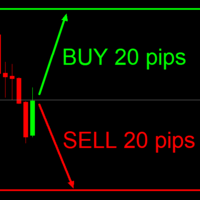
This indicator is very useful for day traders or short term traders. (MT5 version) No need to calculate the number of pips manually, just look at the chart and you will see the Virtual Take Profit / Virtual Stop Loss target line and evaluate whether the entry point is feasible to reach the intended target or not.
Enter the intended Take Profit / Stop Loss pips for your trade. The indicator will display Virtual Take Profit / Virtual Stop Loss lines for you to easily see if the target is
FREE

ZPOWER BUY & SELL INDICATOR
Trade Smarter. Trade Confidently. Trade Profitably.
Are you tired of second-guessing your trades? Do you enter late and exit too early — leaving money on the table? It’s time to upgrade your strategy with the ZPOWER BUY & SELL INDICATOR, built with institutional-grade logic that helps you catch high-probability trade setups with precision.
Why ZPOWER is Different
Unlike ordinary indicators that flood your charts with noise, ZPOWER is engineered with advanced
FREE

SnR Engine Basically, this is a Support and Resistance indicator like most others that use fractals to determine support and resistance levels. The difference is that this indicator determines whether a support or resistance level has been broken based on ATR. Levels that have been broken will become “dead levels” and will be shown with dashed lines.
Levels that have many rejections and fail to be broken will have increasingly thicker lines. For effective use, you need to understand the charac
FREE

SMC Donchian Suite The SMC Donchian Suite for MetaTrader 5 is a comprehensive, all-in-one indicator that combines the power of Donchian Channels, Anchored VWAP, and Visible Range Volume Profile (VRVP) to provide a complete and actionable view of the market. It's designed for traders who want to understand market structure, volume, and momentum in a single, integrated tool. Key Features: Multi-faceted Market Analysis: The indicator integrates three powerful analytical tools: Donchian Channels: T
FREE

KS Volume Bar Color Pro 是一款适用于 MetaTrader 5 的 MQL5 指标,它利用成交量加权逻辑直观地高亮显示特定的 K 线。
核心概念
该指标利用经典的“三根 K 线”形态来识别市场结构:
指标使用原生的 `DRAW_COLOR_CANDLES` 方式为中间的 K 线(即“位移 K 线”/displacement bar)着色。这种技术确保了着色与实际价格 K 线完美对齐,效果类似于成交量分布(Volume Profile)工具。
主要功能
1. 成交量加权的 FVG(价格失衡区)着色
将位移 K 线的成交量与之前 K 线的移动平均值进行比较。
将 FVG 分类为:
强(高成交量)
普通
弱(低成交量)
针对看涨和看跌情况使用不同颜色。
2. 管理功能
追踪两侧的 FVG 数量(数量由用户设定)。
当价格穿过阈值(完全回补缺口或触及中心线)时,消除(移除)该 FVG 标记。
每个报价跳动(tick)实时更新。
4. 警报与通知
阈值突破(净数量变化)
IOFED(价格进入反向区域)
已确认 / 未确认状态
向 M
FREE

KEYPAD SUPPORT RESISTANCE LOGIC MT5 Advanced Cluster-Based Support & Resistance • Multi-Timeframe Confirmation • Smart Market Analysis Stop relying on ordinary horizontal lines and isolated support/resistance levels. KEYPAD SUPPORT RESISTANCE LOGIC MT5 is an advanced technical-analysis indicator designed to help traders identify important support clusters, resistance clusters, market structure, trend direction, momentum and multi-timeframe confluence from one organized MT5 dashboard. Instead of
FREE

THE MARKET HAS AN ANGLE Anywhere else doesn’t exist- Measure the Real Structural Trend Structural Trend Angle & Strength Engine 구조적 추세 각도 & 강도 분석 엔진- B2U TrendFinder Channel 은 로그 회귀 (Log Regression) 기반의 구조적 추세 채널입니다 . 단순 가격 이동이 아닌 , 시장의 실제 추세 방향 · 각도 · 통계적 강도를 분석합니다 . B2U Market State System Part of the B2U Market State System B2U TrendFinder Channel is a structural log-regression channel designed to measure true market trend direction, angle, and statistical strength. This is NOT a repainting i
FREE

Darkstone SNR — Support & Resistance Engine by Darkstone Capital Darkstone SNR is a lightweight, non‑repainting Support & Resistance detection system designed for traders who want clean, objective market structure levels without noise or lag. Built on a rules‑based confirmation model, the indicator identifies key swing‑based support and resistance zones and updates them dynamically as market conditions change. This tool is engineered for stability, clarity, and compatibility with any trading sty
FREE

A modern drawing toolbar for MetaTrader 5: draw lines, Fibonacci, shapes, positions and more with one click, snap to candles with a smart magnet crosshair, and keep your price scale draggable - all in one clean, easy-to-use indicator.
Drawing on MetaTrader 5 charts can feel slow and clumsy. This indicator gives you a smooth, modern drawing experience: one tidy toolbar, simple clicks, and everything you need for chart analysis in a single tool.
Just attach it to a chart, pick a tool from the t
FREE

TITAN Chart Notes – a kereskedési jegyzetfüzeted közvetlenül a diagramon található, riasztókkal.
Írd meg a tervedet, a pályádat és a szabályokat, ahol ténylegesen kereskedsz. Kattints egy sorra, és írd be – minden szimbólumhoz automatikusan elmentődnek a jegyzetek, és újraindítás után visszatérnek.
RIASZTÁSOK – csak írd őket egy sorba: - 14:30 US CPI – 14:30-kor csörög (a számítógép ideje) - >4180 take profit – cseng, amikor az ár eléri vagy meghaladja a 4180-at - <4120 vásárlási zóna – cseng
FREE

用两个区间估计而不是一个,于是单独一次波动率爆发骗不了这个过滤器。Twin Range Filter MTF把一个快速平滑区间和一个慢速平滑区间取平均,只有当价格越过这段合成距离时才让线迈出一级台阶,并对每一次转向上锁。于是您得到的是每次转向一个信号,而不是一串信号。任何图表上的任何上位时间周期,读取的只有已收盘的上位K线。它是免费的:没有试用期,没有锁定功能,没有升级页面。 从K线之间变动的幅度出发,搭出两个平滑区间,一个在快窗口上,一个在慢窗口上,各自再平滑一次并用自己的乘数放大。它们的平均值,就是过滤线在迈出一级台阶之前所要求的距离。 只有当价格越过这段距离时线才移动,否则它就停在原地。信号是方向计数为正时的换边,而一把锁让每次转向只允许一个信号,而不是在停留于同一侧的每根K线上都给出新信号。 图表上有什么 在价格窗口里绘制:按所处一侧上色、跨越转向而不断开的过滤线;围绕它的区间带,画成两条细线;两者之间的两处阴影;以及转向那根K线上的BUY和SELL箭头。 面板 价格图表上的画布面板,可拖动、可折叠、可关闭。它显示当前生效的时间周期,以及实际参与计算的设置数值。它告诉您最近一根
FREE

别再猜手数了。TravaRisco Lot Calculator 直接在图表上显示与您所选风险相符的精确手数。 工作原理: 在面板中输入风险百分比和以点数表示的止损,指标会立即计算: 风险金额(以账户货币计) 该止损下每 1 手的亏损 按您经纪商的交易量步长取整后的精确手数 取整后的实际风险 适用于外汇、黄金、指数和加密货币,使用您自己经纪商的点值。面板支持英语或葡萄牙语。它不会开仓,只做计算。 参数: Risk per trade:每笔交易风险,占余额的百分比(默认 1%) Default stop loss:初始止损点数(默认 200) Language:面板语言(英语或葡萄牙语) X position / Y position:面板在图表上的位置 Background color:面板背景颜色 需要用于自营交易公司挑战的每日亏损锁定?请查看 TravaRisco Daily Loss Lock。 下一步:一键以此精确手数开仓,自动管理止损、止盈、保本和部分平仓: TravaRisco Trade Manager 觉得有用吗?在本页留下简短评价,可帮助其他交易者找到它,也让我知道该
FREE
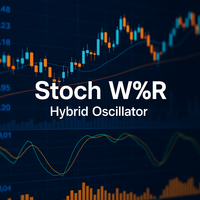
StochW%R 动量震荡指标 – 您的智能混合动量指标 精准。降噪。更可靠。 厌倦了在波动市场中产生虚假信号的传统震荡指标? StochW%R 动量震荡指标 是分析动量领域的演进,它将**随机指标 (Stochastic) 和 威廉指标 (%R)**的优点集于一身,成为一个强大且可自定义的指标。 核心优势: 凭借其智能融合算法,它能 减少市场噪音 并提供 更清晰的信号 ,同时提前预警趋势变化。 为什么这个指标更优越? 两种震荡指标的智能融合 随机指标(平滑化): 在识别超买/超卖条件时,对噪音的敏感度较低。 威廉指标(反向和调整): 对价格的剧烈波动反应更灵敏。 结果: 一条 更精确的动量线 ,能够过滤虚假信号并提高可靠性。 用于完美时机的信号线 与 信号线 (StochW%R 的移动平均线)的交叉有助于: 在价格到达极端区域之前 预测反转 。 确认动量变化 ,且滞后性小于传统震荡指标。 完全自定义 通过**“Stoch Weight” 参数,您可以调整 灵敏度和平滑度之间的平衡**: > 0.5: 受随机指标影响更大(适用于横盘市场)。 < 0.5: 受威廉指标影响更大(非常适合强
FREE

M51H Dashboard: see the trend on two timeframes at a glance M51H Dashboard is a small panel in the corner of your chart. It shows whether the higher timeframe and your trading timeframe agree on direction, and how long each trend has been running. You don’t need to switch charts or add several indicators. What it shows Row What it checks Possible states H1 (anchor chart) EMA 8 vs EMA 21 Bullish, Bearish, Neutral M5 (trading chart) EMA 8, 13 and 21 lined up in order Bullish, Bearish, Waiting Each
FREE

Trendfollowingline(基于 ATR 的趋势跟踪指标) 指标简介 Trendfollowingline 是一款绘制在价格图表主窗口的趋势跟踪指标。它以平均真实波幅(ATR)作为市场波动的衡量尺度,围绕价格构建一条带状线:当价格运行方向为上升时,带状线位于价格下方并向上跟随;当方向转为下降时,带状线切换到价格上方并向下跟随。方向发生切换时,指标在带状线上给出箭头标记。 指标本身不包含任何交易逻辑,不会下单或修改持仓,仅用于图表观察与技术分析。 主要功能 趋势方向显示:绿色线表示上升方向,红色线表示下降方向,同一时间只显示其中一条。 单向跟随机制:上升状态下的带状线只会向上移动,下降状态下的带状线只会向下移动,减少价格小幅波动带来的来回切换。 方向切换标记:由降转升时显示绿色向上箭头,由升转降时显示红色向下箭头,标记可单独关闭。 波动自适应:带宽由 ATR 决定,市场波动加大时自动变宽,波动收敛时自动收窄,无需针对不同品种手工调整固定点数。 两种 ATR 算法:可选用 Wilder 平滑,或真实波幅的简单移动平均。 多种价格来源:支持 (High+Low)/2、(High+L
FREE

Pivot Point Multi-Method with Dashboard This indicator is a technical analysis tool designed to calculate and display horizontal support and resistance levels based on various Pivot Point methodologies. It is built using the MQL5 Canvas library, ensuring efficient performance and a clean visual presentation on the chart. The tool calculates levels using the data from the previous completed candle of a user-defined reference timeframe. This ensures that the levels remain fixed for the duration of
FREE

Prop Drawdown Dashboard — 实时全面掌控你的 Prop Challenge 账户状态 所有关键账户信息都集中在一个面板中,并实时更新: 当前回撤、挑战进度,以及距离关键限制还有多远 。 内置 10 个热门 prop 公司预设: FTMO、FundingPips、The5ers、FundedNext 等。只需选择对应公司 — 所有限制和时区设置都会自动加载 。 不再因为交易日重置时间错误而违规。该指标会自动处理时区、GMT 偏移以及夏令时切换。
为什么开发 Prop Drawdown Dashboard 在进行 prop challenge 时,始终清楚两件事至关重要: 已经使用了多少风险,以及距离违规还有多近 。
大多数挑战失败并不是因为策略本身,而是因为失去了控制。一笔多余的交易、一时疏忽,或一次风险评估错误 — 都可能在几分钟内导致账户失效。 Prop Drawdown Dashboard 的开发目的,就是让你能够实时一眼看清挑战状态,并避免意外违规。
实时限制监控
面板会实时显示: 日内回撤、总回撤、盈利目标进度,以及距离触发限制还剩多少空间 。
所有
FREE
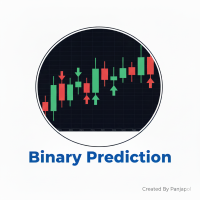
Binary Prediction: The Ultimate Decision Support Tool for Binary Options Traders Binary Prediction is a meticulously developed indicator tailored specifically to meet the demands of Binary Options trading. It is designed to simplify complex market analysis, providing clear, reliable trading signals for both novice and experienced traders looking to enhance their decision-making process. Core Features & Advantages: Dedicated Binary Options Algorithm: The core logic is fine-tuned to capture cruc
FREE

CandlePro X — Free Professional Candle Visualizer for MetaTrader 5
CandlePro X is a free chart visualization indicator for MetaTrader 5, designed to make candlestick charts cleaner, sharper, and easier to read. If you find it difficult to quickly distinguish bullish and bearish candles, especially on busy charts, CandlePro X helps solve this problem by giving your candles stronger colors, clearer contrast, and a more professional appearance.
CandlePro X does not generate trading signals, pred
FREE

This indicator calculates fibonacci levels via moving averages trend and draw these lines. You can change fast and slow Moving Averages settings for customization. Inputs:
Fast MA Time Period : 64 Fast MA Shift: 0 Fast MA Method: Smoothed Fast MA Apply To: Median Price Slow MA Time Period: 32 Slow MA Shift: 0 Slow MA Method: Smoothed Slow MA Apply To: Median Price ZigZag: False ZigZag Color: Red ZigZag Type: DashDot ZigZag Width: VeryThin Fibo Settings TrendFibonacci: True FiboTrendColor: Black
FREE

This indicator shows colored candles when price are strongly distorted in relation to their averages.
A good time for buy can be seen after the closing of a silver candle. The pattern becomes more reliable if the purchase is opened when the price of the candle after the silver candle is above the maximum price of the silver candle.
A good time for sell can be seen after the closing of a pink candle. The pattern becomes more reliable if the sale is opened when the price of the candle after
FREE
MetaTrader市场是您可以下载免费模拟自动交易,用历史数据进行测试和优化的唯一商店。
阅读应用程序的概述和其他客户的评论,直接下载程序到您的程序端并且在购买之前测试一个自动交易。只有在MetaTrader市场可以完全免费测试应用程序。
