 MetaTrader 5
 专家
专家
 指标
指标
 程序库
程序库
 实用工具
实用工具
 窗口小部件
窗口小部件
 规则
规则
适用于MetaTrader 5的免费技术指标 - 26
 技术指标的信号外汇和股票市场的开仓交易和平仓交易起着至关重要的作用。指标的本质就是一种交易品种的数学转换,旨在预测未来的价格变化。
测试技术指标可以更有利于预测市场行为并从中获利。
技术指标的信号外汇和股票市场的开仓交易和平仓交易起着至关重要的作用。指标的本质就是一种交易品种的数学转换,旨在预测未来的价格变化。
测试技术指标可以更有利于预测市场行为并从中获利。 
This indicator provides a clear, at-a-glance dashboard for monitoring both the Relative Strength Index (RSI) and Stochastic Oscillator on any instrument or timeframe.
Whenever both RSI and Stochastic %K simultaneously exceed their respective overbought or oversold levels, the indicator displays an arrow signal in the indicator window.
These signals highlight strong momentum and can help traders quickly identify high-probability reversal zones. As with all my free tools, the arrow symbol can be e
FREE

The Stochastic RSI (StochRSI) is a technical indicator that combines the characteristics of the Relative Strength Index (RSI) with the Stochastic Oscillator, resulting in a more sensitive tool that generates a higher number of trading signals. Developed by Tushar Chande and Stanley Kroll, the indicator was designed to overcome a perceived limitation of the traditional RSI: the low frequency of overbought and oversold levels activation (commonly 80 and 20), especially in less volatile assets. Ho
FREE

Dow+ICT AI Visualizer | 连接AI大脑的钥匙 自动生成道氏拐点数据,让AI帮你分析市场——你的AI交易助理的数据接口
Dow+ICT AI Visualizer 不只是画线工具,更是“数据生成器”:
多品种支持,贵金属(XAU,XAG),原油(XBR,XTI),股指(US500,US100),外汇(EUR,GPD,CHF,JPY,AUD,CAD), 加密货币(BTC,ETH)
多周期支持,M5-M15-M30-H1-H4
自动生成道氏拐点数据(HH/HL/LL/LH序列)
自动整理K线数据(OHLC)
实时更新,保存到数据文件夹
TXT格式直接拷贝贴给AI 您的AI很聪明,但它需要有效的数据 ,
→ 你只需要在你的AI界面新开一个话题并贴入我们设计的提示词,
→ 然后不断更新最新的数据给它,你的AI就能基于道氏结构+ICT策略规则,分析出日内进场点,
这不是“看图说话”,这是“让AI真正理解市场”。
数据存放位置说明 :
您的MT5(桌面版)界面菜单"文件->数据文件夹" 或者快捷方式 "Ctrl+Shift+D"。打开后,继续进
FREE

This is a simple Volume Weighted Average Price (VWAP) indicator. Simply add it to the chart and adjust the vertical line that is used as start anchor point and it is done.
Volume Weighted Average Price (VWAP) is a trading benchmark that represents the average price a security has traded at throughout the day, based on both volume and price. It is calculated as the sum of price times volume for each trade, divided by total volume.
FREE

Fibo Zones Manual — Manual Fibonacci with Buy/SL/TP Zones
Fibo Zones Manual is a fully manual Fibonacci tool — drag the two points to your swing high/low, exactly like the native MT5 Fibonacci retracement. On top of it, the indicator draws three colored zones directly on the chart: entry zone (Buy/Sell), SL zone, and TP zone, each with the exact price displayed.
Key Features
• Manual placement, drag-and-drop like the native tool • Colored zones (entry, SL, TP), fully adjustable • Price and pe
FREE

Moving Average ATR Channel Experimental indicator that constructs a dynamic price channel around a Moving Average by applying Average True Range multiples. The channel consists of an inner and outer boundary on both the upper and lower side of the moving average, creating a visual “tunnel” that expands and contracts with market volatility. Default parameter values are completely untested and are not derived from any back-tested strategy, statistical study, or recommended trading system. They se
FREE

在图表上显示前一日最高价、最低价、收盘价、交易时段开盘跳空和开盘区间,适用于指数、黄金、外汇和加密货币。
描述: Session Levels Ultimate 在任何品种的图表上直接绘制日内交易者每天关注的价位。 - 前一日最高价、最低价和收盘价 - 交易时段开盘线(默认服务器时间 16:30,即 GMT+2 / GMT+3 服务器上的美股开盘) - 时段开盘跳空:以价格和日 ATR 倍数显示,向上为绿色,向下为红色 - 时段开盘区间(默认前 60 分钟),以方框显示 跳空超过设定大小时在开盘提醒,可选手机推送。 时间为经纪商服务器时间:美股 16:30,法兰克福或伦敦 10:00,东京 02:00(GMT+2 / GMT+3 服务器),或您交易的任何时段。适用于指数、黄金、外汇、加密货币和股票,H1 及以下周期。 自动交易美股开盘:Index Bender EA https://www.mql5.com/en/market/product/200096
FREE

Convenient drawing of parabolic channels by four points (two lower and two upper extremums). Additional control keys: N (New) - Start drawing a new channel. C (Clear) - Deletes the current channel. By default, the current channel is the last channel. But you can click on the line of any channel to make it current. Click on the gear in the upper right corner to set some parameters for all channels or the current channel. All work is visible from the animated Gif.
Do not forget to express your w
FREE
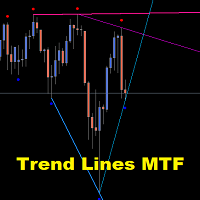
Gold TL MTF - this is a fine stock technical indicator. The indicator algorithm analyzes the movement of the asset price and reflects trend lines along the fractals of a specific timeframe (TF).
Benefits of the indicator: The indicator produces signals with high accuracy. The confirmed signal of the indicator does not disappear and is not redrawn. You can trade on the MetaTrader 5 trading platform of any broker. You can trade any assets (currencies, metals, cryptocurrencies, stocks, indices e
FREE

clock, Server Time, Local Time, MT5 Clock, Clock Indicator, Digital Clock
DualClockPro - Local and Server Clock for MetaTrader 5 DualClockPro is a visual clock indicator for MetaTrader 5 that displays local computer time and trading server time directly on the chart. It also supports displaying the corresponding dates, helping traders monitor time differences between their local environment and the broker's server. The panel has a compact design and customizable settings, allowing users to ada
FREE

KS 日/周/月分隔线及倒计时指标
这是一个专为 MetaTrader 5 设计的视觉增强指标,旨在帮助交易者快速识别图表上的时间周期分界线,同时提供实时K线收盘倒计时功能。
主要功能
1. 垂直时间分隔线
日分隔线:在每个新交易日开始处绘制垂直线。
周分隔线:在每周开始处(以周一为准)绘制垂直线。
月分隔线:在每月开始处绘制垂直线。
每种分隔线均可完全自定义:
可单独启用或禁用
颜色、线宽及线条样式(实线、虚线、点线等)
可选是否在直线上显示文本标签
2. 智能顶部标签
在图表顶部(固定 Y 轴位置)的每个分隔线上方显示信息标签。
标签示例:
15/07
Wk 15/07
Jul 2026
15/07 | Wk 15/07 | Jul 2026
3. K线倒计时面板
一个时尚、紧凑的面板,显示多个时间周期的实时K线收盘倒计时。
支持的时间周期(用户可选):
M1, M5, M15, M30, H1, H4, D1
面板特性:
双列布局(每行显示 2 个时间周期)
简洁的数字倒计时格式 (HH:MM:SS)
可自定义位置(4 个角落)、
FREE
具有多时间框架支持、可自定义视觉信号和可配置警报系统的Williams %R指标。
自由职业编程服务、更新和其他TrueTL产品可在我的 MQL5主页 获取。
非常欢迎您的反馈和评价!
什么是Williams %R? Williams %R是由拉里·威廉姆斯开发的动量振荡器。它在-100到0的范围内运动。接近0的值表示超买状态,接近-100的值表示超卖状态。Williams %R是一个反向随机振荡器,测量收盘价相对于特定时期高低点范围的位置。超买/超卖水平(-20和-80)的穿越产生交易信号。 该指标帮助交易者识别潜在的反转点:当%R向下穿越-20线时,可能预示着即将到来的调整;当它向上穿越-80线时,可能表明可能的反弹。Williams %R与价格之间的背离可能在趋势反转前提供强烈的预警信号。 功能特点: 带箭头和垂直线的视觉信号标记 三个独立信号缓冲区,具有可配置触发器 信号检测选项:方向变化、级别穿越、峰/谷 每个信号可配置警报(电子邮件、推送、声音、弹出窗口) 具有插值方法的多时间框架(MTF) 柱状图或折线图显示模式 多种颜色模式(单色、基于方向、基于级别) 通过iCu
FREE

If you love this indicator, please leave a positive rating and comment, it will be a source of motivation to help me create more products <3 What is Schaff Trend Cycle indicator? The Schaff Trend Cycle (STC) is a technical analysis indicator used in trading and investing to identify trends and generate trading signals. The STC is designed to identify trends and trend reversals by measuring the strength of the trend and the speed of price changes. The STC indicator helps to identify trends in a
FREE

The Stochastic Momentum Index (SMI), developed by William Blau and featured in the January 1993 edition of Technical Analysis of Stocks & Commodities magazine, introduces a unique perspective to trading analysis. Distinguished from the conventional Stochastic Oscillator, which evaluates the current close in relation to the recent x-period high/low range, the SMI assesses the close's position relative to the midpoint of this range. This innovation yields an oscillator with a range of +/- 100, re
FREE

Trade Sessions Visualizer – Professional Session Indicator for MT5 Overview Trade Sessions Visualizer is a powerful, lightweight indicator that plots major global trading sessions directly on your chart. Each session is displayed as a clearly colored rectangle spanning its actual high and low prices, with an optional overlap highlighting and customizable labels. Gain instant visual insight into when and where the market is most active—perfect for Forex, indices, commodities, and crypto traders.
FREE

Big Figure Levels – Key Psychological Price Zones for MT5 Big Figure Levels is a professional trading tool designed for MetaTrader 5 that automatically identifies and draws major psychological price levels, including quarter and half levels. These levels are known to act as powerful support and resistance zones due to their influence on both institutional and retail trader behavior. This indicator is perfect for any trading style—whether you're a scalper, day trader, or swing trader—and is compa
FREE
Alpha Edge Pro – The Manual Trader’s Edge - If you prefer trading manually without stress, this indicator is for you. Get your copy now. Tired of missing the big moves or holding on to losing trades too long? Alpha Edge Pro is your new secret weapon. This high-performance, plug-and-play MT5 indicator gives you crystal-clear BUY and SELL signals — so you can trade with confidence, precision, and speed. If you prefer manual trading profitably , this indicator is made for you. Alpha Edge Pro does
FREE

After downloading, message me via MQL5 inbox to receive your FREE User Kit - setup guide, practical checklist, and workflow resources built specifically for XAUUSD traders. I've been trading XAUUSD for years, and one thing I kept running into was this: Supertrend is a solid concept, but watching it in live market conditions is a different story. Price spikes through a level, a candle closes just barely on the wrong side, and suddenly your read flips - only to flip right back two bars later. On
FREE

MTF RSI Fusion Basic 是 MetaTrader 5 振荡器,将一个基础相对强弱指数(RSI)与最多两个可选 RSI 来源组合。每个来源可设置时间周期、计算周期和应用价格,两个附加来源各自具有权重和组合模式。 指标显示 Fusion RSI 曲线、基于平均真实波幅(ATR)的动态超买和超卖区域,以及可选的快慢移动平均线。均线可在指标窗口中基于 Fusion RSI 绘制,也可在主图中基于价格绘制。功能不包括背离检测、买卖信号、趋势方向着色或成交量加权平均价格(VWAP)振荡器。 RSI1 Period、RSI2 Period、RSI3 Period 默认分别为 7、14、28,三个来源初始均使用当前图表周期。Enable RSI2 和 Enable RSI3 控制附加来源;RSI2 Weight 和 RSI3 Weight 控制其贡献。组合模式包括 ADD、SUB、AVG、ADDSUB、SUBADD。Clamp output to 0..100 将结果限制在 0 至 100。 Enable Dynamic OB/OS、OB/OS Timeframe、ATR Lengt
FREE

Pro Trend MA for MetaTrader 5 Pro Trend MA 是一款技术指标,用于直接在价格图表上直观识别趋势方向。 该指标基于K线的最高价、最低价和收盘价进行计算,并结合平滑处理和指数移动平均信号线。 主线根据其与信号线之间的关系改变颜色: 浅蓝色:计算出的趋势等于或高于信号线。 橙色:计算出的趋势低于信号线。 指标提供两个可调参数: Smooth Period:主要平滑周期。 EMA Period:作为信号线使用的指数移动平均周期。 Pro Trend MA 可作为趋势分析的辅助工具,用于直观观察市场运动方向的变化。 该指标不会执行交易,也不会生成自动交易订单。 兼容 MetaTrader 5 提供的不同交易品种和时间周期。 重要提示:Pro Trend MA 是技术分析工具,不保证任何财务结果。请结合您的交易策略和风险管理进行使用。
FREE

- Displays horizontal lines for Previous Day High (PDH) and Previous Day Low (PDL) on the chart. - Customizable line colors via input parameters. - Sends sound alerts, pop-up notifications, and mobile push notifications upon the initial crossover of PDH or PDL. - Alerts are triggered only once per crossover event; they re-trigger only if the price moves away and re-crosses after a specified minimum interval. - Automatically updates the PDH/PDL levels at the start of each new day. - All indicator
FREE

No Wick Candle Scanner is a powerful, lightweight tool built for MetaTrader 5 designed to isolate pure market momentum. In trading, candles that close without an upper or lower tail (wick) represent absolute dominance by buyers or sellers. This indicator scans your charts in real-time, instantly flagging these high-probability momentum bars with clean visual markers, allowing you to catch strong trend continuations and sudden breakouts with ease. Key Advantages & Features: 6-in-1 Filtering Matr
FREE

MACD TradeSmart — Precision Signals with Visual Clarity
Description: Elevate your technical analysis with MACD TradeSmart , a professional-grade indicator designed to eliminate the ambiguity of the standard MACD. It transforms a classic oscillator into a powerful signal generator. Key Features: Visual Signal Arrows: Clear Buy/Sell arrows appear exactly when the MACD line crosses the Signal line, helping you catch trend shifts instantly. Enhanced Histograms: High-contrast positive and negative
FREE
Introduction This indicator detects volume spread patterns for buy and sell opportunity. The patterns include demand and supply patterns. You might use each pattern for trading. However, these patterns are best used to detect the demand zone (=accumulation area) and supply zone (=distribution area). Demand pattern indicates generally potential buying opportunity. Supply pattern indicates generally potential selling opportunity. These are the underlying patterns rather than direct price action. T
FREE

The Average Directional Index (ADX) is a technical analysis indicator developed by J. Welles Wilder in 1978. Its primary function is to measure the strength of a trend, regardless of its direction, and to determine whether the price has entered a sideways trend. It is also mentioned by John Murphy in *The Visual Investor* (2005) as an indicator that helps determine whether a market is ranging or is about to start a new trend. As for Exponential Moving Averages (EMAs), some authors believe that
FREE

RadarSignal XAUUSD — Multi-Timeframe Radar Dashboard for Gold Trading Stop guessing where Gold is heading. Let the Radar scan it for you. RadarSignal XAUUSD is a multi-timeframe technical dashboard built specifically for XAUUSD (Gold) traders who want a single, clean, visual answer to three questions every trade requires: Where do I enter? Where is my safe invalidation zone? Where is my realistic target? Instead of flipping between five indicators on three charts, RadarSignal fuses ADX, RSI, CCI
FREE

AGORA FLOW GOLD es un indicador visual para XAUUSD en MetaTrader 5 que analiza la acción del precio y presenta en un único panel: Dirección del flujo: alcista, bajista o mixta. Fuerza compradora y vendedora. Tendencia y estructura del mercado. Posibles cambios de dirección. Señales BUY y SELL con precio de entrada, Stop Loss y Take Profit. Lecturas de soporte, resistencia y zonas relevantes. Registro de las últimas señales cerradas y su resultado. Alertas mediante ventanas emergentes en pantalla
FREE

For those who love to follow Volume behavior here it is a little indicator that could be used as a replacement for the old and standard MT5 built-in volume indicator. The trick here is that this indicator paints the volume histogram based on the direction of the candle giving to the trader a quick "Heads Up" on what is happening, visually! It could be used to study and see for instance, the volume and past bars volume during (or, reaching) a peak (Tops and Bottoms). UP candles are shown in pale
FREE
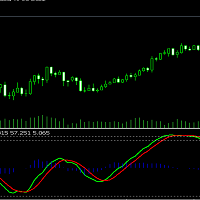
The WaveTrend (LazyBear) indicator is a momentum-based oscillator designed to identify reversal points , trend strength , and overbought/oversold conditions in the market. It is widely used in both Forex and Cryptocurrency trading due to its ability to detect turning points earlier than traditional oscillators like RSI or Stochastic.
(I have Converted from the original TradingView Pine Script version)
FREE

查看上下文中的价格 价格背景图是一个免费的 MetaTrader 5 指标,适用于每日、每周和 ADR(平均每日范围)水平。它使与当前会话最相关的参考价格在一张干净的图表上可见。 您无需每天手动标记开盘价、前一交易日的极值和范围边界,而是获得一个结构化地图,其中显示价格现在的位置、正在接近的价格以及已使用了多少典型的每日范围。 为了清晰而不是混乱而构建。 该指标是为那些想要基本背景而不用不必要的工具填充图表的交易者而设计的。级别按类别进行颜色编码,标签放置在图表右侧的专用区域中,附近的标签会自动间隔以保持可读。 专为希望了解每日、每周和 ADR 背景而没有图表混乱的全权日内和价格行为交易者 而设计。 关键级别一览 每日开放 前一日最高价、最低价和收盘价 当日最高价和最低价 每周开放 上周高点和低点 ADR 高位和 ADR 低位 每个可见级别都可以显示其简称、确切价格以及与当前价格的符号距离。外汇交易品种的距离可以自动显示为点,其他工具的距离可以显示为点,也可以手动选择。 了解当前会话 紧凑的仪表板总结了您交易时最重要的信息: 已使用的 ADR:今天覆盖了所选平均每日范围的多少 日内头寸
FREE

大多数趋势指标迫使您做出选择:快速信号伴随不断的假突破,或平滑输出却错过20根K线的入场机会。问题不在于移动平均线——而在于波动性在变化,但指标没有。
Meridian Trend是一款内置波动性标准化和动量过滤的自适应趋势指标。实时自适应——无论交易EURUSD、比特币还是纳斯达克,行为完全一致。无需按品种调整。一种配置,所有资产,所有时间框架。
工作原理
Meridian Trend通过严格沿趋势方向棘轮推进的波动自适应包络线来追踪价格:
• 在上升趋势中,包络线向上锁定——只能上升,永不下降 • 在下降趋势中,包络线向下锁定——只能下降,永不上升 • 在反转时,动量过滤的交叉确认方向变化——趋势带翻转,箭头标记该K线
动量过滤器是关键层。原始价格交叉在横盘市场中产生虚假信号。Meridian要求方向性压力是真实的,才允许趋势带改变状态。结果:更少的信号,更高的质量。
FREE

VOLUMIZED ORDER BLOCKS [Riz] - MT5 Indicator Smart Money Order Block Detection with Volume Analysis
Volumized Order Blocks is an advanced Smart Money Concepts (SMC) indicator that automatically detects institutional order blocks with integrated volume analysis. It identifies high-probability supply and demand zones where banks and institutions
FREE

==================================================================== SMT DIVERGENCE - NASDAQ vs S&P500 (NAS100 / US500) MQL5 Market Product Description ====================================================================
PRODUCT NAME: SMT Divergence Nasdaq vs S&P500 | Smart Money Index Scalper
SHORT DESCRIPTION (max 63 chars): Spot Nasdaq reversals using SMT Divergence with S&P500
---------------------------------------------------------------------- FULL DESCRIPTION ---------------------
FREE

Aegis Current Force
Aegis Current Force is a professional signal indicator designed to identify structured trading opportunities using market direction, trend strength, momentum recovery, and predefined risk levels.
The indicator combines an internal Gann and Fibonacci price-alignment engine with ADX directional confirmation and CCI recovery filtering. A signal appears only when the selected conditions agree, helping reduce weak and unstructured entries.
BUY and SELL arrows are displayed dir
FREE

Market Hours Pro shows Tokyo, London, and New York trading sessions directly on your MT5 chart, including scheduled overlap periods. It’s designed to give you a clear view of global market timing so you can plan trades, spot high-activity periods, and align strategies with standard Forex hours. How It Works Displays scheduled session times visually on your chart. Highlights session overlaps for London/New York and Tokyo/London. Automatically adjusts times for your timezone or broker time. Shows
FREE
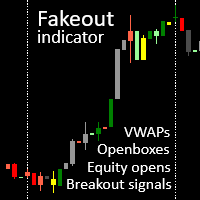
Fakeout candle indicator with session VWAPs, openboxes and openbox breakout signals. Check out our other products for fxer.net:
https://www.mql5.com/en/market/product/114888
https://www.mql5.com/en/market/product/114890 Main features 1. VWAPS for Tokyo, London and NY sessions 2. Openboxes for Tokyo, London and NY sessions 3. Colored candles for breakouts, fakeouts and inside candles 4. Equity open line 5. Openbox expansions 6. Unmitigated equity open prices for Tokyo, London and NY sessions
FREE

Moving Average Convergence/Divergence — схождение/расхождение скользящих средних — технический индикатор, разработанный Джеральдом Аппелем (Gerald Appel), используемый в техническом анализе для проверки силы и направления тренда, а также определения разворотных точек. Встроенный в MetaTrader 5 индикатор MACD не соответствует задумке автора (Gerald Appel):
-линия MACD графически изображена в виде гистограммы, однако гистограммой отражается разница между линией MACD и сигнальной линией;
-сигнальн
FREE
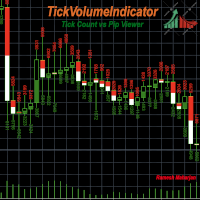
有多种指标和方法可用于识别图表中的趋势。TickVolumeIndicator 就是其中之一。它通过使用逐笔报价数据显示过去的趋势,帮助您识别和预测未来趋势。
TickVolumeIndicator 是一种使用逐笔报价交易量为图表中可见的 K 线图绘制颜色的指标。逐笔报价交易量指的是买入价和卖出价。用户可以选择逐笔报价的买入价和卖出价计数,或 K 线图时间范围内的点差变化。当卖出价大于之前的卖出价时,会添加卖出价计数;当买入价小于之前的买入价时,会添加买入价,两者均根据 K 线图高度进行标准化,以便在图表中显示。点差变化的计算方式相同。
用户有以下选项:
1) 卖出价颜色:用户可以选择红色、绿色、蓝色、紫色、黄色、青色、紫红色、棕色、橙色、粉色、白色或无作为卖出价颜色。默认为绿色。
2) 买入价颜色:用户可以选择红色、绿色、蓝色、紫色、黄色、青色、深紫色、棕色、橙色、粉色、白色、无作为买入价颜色。默认为红色。
3) 点数 vs 点数:用户可以选择显示点数颜色或点数变化颜色。默认为点数。
4) 边框类型:用户可以选择扁平、凸起和非动态指针作为边框类型。默认为凸起。
5)
FREE

免费 — 一个图表面板,将当前 ATR 转化为建议止损距离和基于风险的手数,让仓位大小不再靠猜。
100% 免费,无任何限制。如果这个工具在您的图表上占有一席之地,一条简短的评价就是对我们最大的帮助 — 只需 30 秒,也是让其他交易者发现这个工具的关键。
平台: 仅限 MetaTrader 5 — 没有 MetaTrader 4 版本。
计算公式刻意保持简单且完全公开 — 没有黑箱:
- 建议止损距离 = ATR × 倍数(默认 1.5)。
- 风险金额 = 账户余额 × 每笔交易风险%(默认 1%)。
- 建议手数 = 风险金额 ÷ 该止损距离下每手的亏损额,由经纪商自身的 tick value 和 tick size 计算,按手数步长向下取整,并限制在经纪商的最小/最大手数之间。
=== 显示内容 ===
- 当前品种和周期的 ATR(价格单位和点数)。
- 建议止损距离(点数)。
- 风险金额(账户货币)。
- 建议手数,可直接填入下单窗口。
- 面板每 5 秒刷新一次,并在每个 tick 时更新。
=== 交易者如何使用 ===
固定手数忽略了波动率: 平静日的 0
FREE
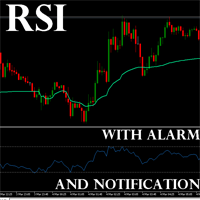
This is RSI with alarm and push notification -is a indicator based on the popular Relative Strength Index (RSI) indicator with Moving Average and you can use it in Forex, Crypto, Traditional, Indices, Commodities. You can change colors to see how it fits you. Back test it, and find what works best for you. This product is an oscillator with dynamic overbought and oversold levels, while in the standard RSI, these levels are static and do not change.
This allows RSI with alarm and push notifica
FREE
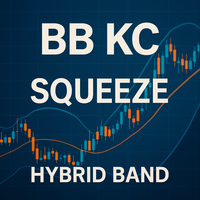
BB KC 混合挤压带 – 先进的波动性和压缩指标 BB KC 混合挤压带 是一款新一代技术指标,它智能地结合了 布林带 (BB) 和 肯特纳通道 (KC) ,形成一个独特的混合结构。该指标旨在更精确地解读市场波动性、 压缩 和扩张环境,从而更早、更清晰地发现关键的市场机会区域。 功能介绍 动态混合带计算 它通过 可调节的加权系数 融合了布林带和肯特纳通道的上下带,创建了一个集两者优势于一身的通道: BB: 对标准差变化敏感。 KC: 基于真实波动率 (ATR) 的稳健性。 自动检测压缩区域(“挤压”) 该指标测量 动态混合宽度 并将其与近期历史数据(百分位数)进行比较。当通道收窄至预设阈值以下时,它会在图表上通过视觉符号(圆形或箭头)标记 压缩事件 : 这表明市场在爆发性行情之前正在积聚压力。 智能警报系统 当价格突破以下位置时,接收个性化警报(声音、电子邮件、推送通知): 上带 (可能的看涨突破信号)。 下带 (可能的看跌突破信号)。 通过时间控制系统(冷却期)避免重复警报。 相较于单独使用布林带或肯特纳通道的优势 特性 BB KC 混合挤压带 布林带 肯特纳通道 带背景的压缩检测
FREE
Vertical Margin is a lightweight MT5 chart scaling utility for MetaTrader 5 that adds configurable vertical space above and below the visible price action. It improves the standard MT5 auto-scale behavior by keeping additional chart margin around the highest and lowest visible candles. This makes the chart easier to read, analyze and draw on without constantly adjusting the price scale manually. The indicator automatically recalculates the vertical margin when you zoom, scroll or change the visi
FREE

Confluence Bias Map 将关键的市场指标整合为一个单一的实时评分,以支持您的交易分析。 在分析图表时,单独查看多个独立的指标(均线、MACD、ADX、RSI、Stochastic、布林带、MFI、ATR)往往会导致信号冲突和决策瘫痪。在没有结构化方法的情况下,对比不同时间框架的趋势、动能、波动率和成交量很难定义真实的市场偏向。 Confluence Bias Map 通过将这 4 个核心市场维度跨 3 个时间框架整合为一个单一的实时评分,解决了这一问题。 它显示的内容: 圆环仪表盘 (Donut Gauge): 在仪表盘中心显示 0 到 100 的综合汇聚评分 (Confluence Score)。 类别拆解: 显示趋势(基于 EMA、MACD、ADX)、动能(基于 RSI、Stochastic)、波动率(基于布林带)和成交量(基于 MFI)的各自平均评分。 时间框架扫描: 显示 3 个时间框架的独立评分和实时进度条:当前图表周期以及两个更高周期(例如 M15、M30、H1)。 历史实证: 直接在面板上计算并显示信号触发(评分 >= 75 或 <= 25 在 10 根
FREE
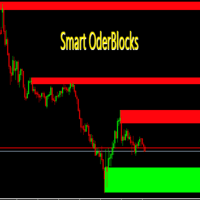
Smart OrderBlocks Indicator for MetaTrader 5 A Differentiated Vision and a Bit of Price Action! Smart OrderBlocks is an advanced indicator that reveals market structure from a unique perspective through intelligent supply and demand zone detection. Key Features OrderBlocks Detection Internal OrderBlocks : Capture micro-level market dynamics Swing OrderBlocks : Identify macro market momentum trends Advanced Volatility Intelligence Volatility detection using: Adaptive Average True Range (AT
FREE

-- 简单而有效。 反转指标 - 是什么?
一种结合超级趋势逻辑与指数曲线技术的趋势跟随叠加指标。它能识别趋势方向,在图表上绘制动态通道,并在趋势反转时发送实时警报。
工作原理
该指标通过ATR与超级趋势因子计算指数基准线。当价格收盘突破该基准线时,确认趋势反转。绿色箭头标记买入趋势启动,红色箭头标记卖出趋势启动。
功能特性:
基于ATR的指数趋势基准线与动态通道 绿色/红色趋势线及填充通道 趋势反转时的买入/卖出箭头信号 内置警报:弹窗、推送通知、邮件、声音 重复警报防护(每根K线仅触发一次警报) 完全可定制:颜色、线条粗细、箭头尺寸、通道宽度 无延迟的简洁图表叠加层
输入参数:
指数速率、超级趋势因子、ATR周期、通道宽度 开关控制:通道填充、箭头、各警报类型 所有视觉元素支持全色系定制
最佳适用场景:任意品种、任意周期。适用于外汇、指数、大宗商品及加密货币图表。
FREE

概述
PivotForge 直接在图表上计算并绘制日线或周线枢轴点,支持经典或斐波那契方法。每个新周期开始时自动更新水平线。 工作原理 选取上一个完整的日线或周线蜡烛作为参考周期 使用经典或斐波那契公式计算枢轴点(PP)、阻力位(R1-R3)和支撑位(S1-S3) 绘制贯穿当前周期的水平线,并标注价格 每个新周期(日或周)自动重绘 输入参数 Pivot_Timeframe: 日线或周线计算周期 Pivot_Method: 经典或斐波那契 Show_S3_R3: 显示外部水平线 Line_Style: 线型 Line_Width: 线宽 Show_Price_Labels: 在标签旁显示价格 Color_PP: 枢轴线颜色 Color_R1 / Color_R2 / Color_R3: 阻力线颜色 Color_S1 / Color_S2 / Color_S3: 支撑线颜色 推荐设置
适用于任何品种和周期。日线枢轴适合日内交易(M15-H1),周线枢轴适合波段交易(H4-D1)。该指标无需VPS。 截图
截图展示了使用默认经典设置的实盘图表,以及推荐参数的输入面板。 免责声明
仅供
FREE
Multi-Timeframe EMA Trend Detector Pro Advanced EMA trend analysis tool with crossing detection and trend strength confirmation across 5 timeframes. The Multi-Timeframe EMA Trend Detector Pro is a comprehensive indicator built for traders who rely on trend-based strategies. It analyzes Exponential Moving Averages (EMAs) of 50, 100, and 200 across five key timeframes (M15, M30, H1, H4, and Daily) to identify reliable trends, trend reversals, and consolidation periods. Key Features Multi-Timefram
FREE

======================================================== XAUUSD ELLIOTT WAVE + REAL YIELD (BIG DASHBOARD) - MQL5/MT5 MARKET DESCRIPTION (formatting: **bold** = Bold button; lines with • = bullet list; UPPERCASE = heading) ========================================================
OVERVIEW ------------------------------------------------------- **XAUUSD Elliott Wave + Real Yield (Big Dashboard)** is the dashboard edition of the Elliott + real-yield engine: the same ZigZag/Elliott structure and ma
FREE

Session Box Range draws the Asian, European and US trading sessions as high-low boxes, so you can see at a glance where each session opened, how far it travelled and where it closed.
The range of the most recent session is printed on the on-chart toggle buttons, so the number stays readable no matter how far you zoom or scroll.
FEATURES
- Session hours are entered in GMT, and the broker's server offset is detected automatically, so the same settings work on any broker and survive the ser
FREE

Indicator Description
This indicator draws red-border rectangles during specific daily ICT Kill Zones (EST): 3:00 – 4:00 AM EST 10:00 – 11:00 AM EST 2:00 – 3:00 PM EST During each active time window, the indicator automatically creates rectangles and highlights Fair Value Gaps (FVGs) formed shortly before and during the selected Kill Zones, including recent prior FVGs for additional confluence. The Kill Zones are designed according to ICT (Inner Circle Trader) concepts and can be used as a c
FREE
Adaptive Hull MA Pro – Trend & Momentum Filter
We value your feedback and believe that your experience with the Hull Moving Average (HMA) is essential to us and other traders. Help us continue to improve and refine our product by sharing your thoughts and insights through a review!
The Hull Moving Average (HMA) Indicator – Your Key to Smoother Trends and Profitable Trades! Are you tired of lagging and choppy moving averages that hinder your ability to spot profitable trading opportunities? Loo
FREE

Average Position Price Monitor 是一款為 MetaTrader 5 設計的持倉資訊顯示指標。 當同一交易商品同時存在多筆 BUY 或 SELL 持倉時,指標會自動計算各方向的加權平均持倉價格,並將重要的持倉、盈虧及 Stop Loss / Take Profit 資訊直接顯示在交易圖表上。 此工具主要用於協助多單交易者快速掌握目前整體持倉狀態,不需要逐筆查看每一張持倉。 主要功能 1. BUY 加權平均持倉價格 當目前商品存在多筆 BUY 持倉時,指標會依照每筆持倉的交易手數計算加權平均進場價格。 計算結果會: 顯示於圖表資訊面板 以水平線標示於圖表 自動隨持倉變化更新 例如不同價格建立多筆 BUY 持倉時,可以直接查看整體 BUY 部位的平均持倉成本。 2. SELL 加權平均持倉價格 SELL 持倉使用相同方式獨立計算。 BUY 與 SELL 持倉不會混合計算,因此在同時持有多空部位時,可以分別查看: Average Buy Price Average Sell Price 3. 即時持倉盈虧 指標會統計目前圖表商品的持倉盈虧,包括: Current
FREE

Know exactly when the market is active. Session Map displays the major Forex trading sessions directly on your chart and in a live panel.
WHAT IT SHOWS ON THE CHART: - Colored background boxes for each session: Tokyo (blue), London (green), New York (orange) - London and New York overlap highlighted in yellow — the most volatile period of the day - Draws the last 3 days automatically so you can compare session behavior
WHAT THE PANEL SHOWS: - Live server time clock updated every second - Stat
FREE

M5 Scalp Wick Entry Arrows This indicator displays two independent types of arrows directly on the chart. Both arrow types are calculated strictly from M5 data, while the indicator can be attached to any timeframe for convenient viewing and analysis. Arrows help visually mark potential moments of interest without overloading the chart. You can adjust arrow size and colors in the settings to match your template. Tested on XAUUSD (Gold) and EURUSD.
FREE

======================================================== GANN CLUSTERS - INSTITUTIONAL SIGNAL PANEL - MQL5/MT4 MARKET DESCRIPTION (formatting: **bold** = Bold button; lines with • = bullet list; UPPERCASE = heading) ========================================================
OVERVIEW ------------------------------------------------------- **Gann Clusters** finds where three independent Gann systems agree and draws those **confluence clusters** across multiple timeframes, with a signal panel that
FREE

Precision Trend Filter is an adaptive noise-filtering trend indicator that identifies real market direction while ignoring false moves and choppy price action.
The indicator uses a proprietary filtering algorithm with ATR-based dynamic thresholding to separate genuine trend shifts from random market noise. The result is a clean, color-coded trend line that holds flat during consolidation and tracks price aggressively during real trends.
Key Features
- Color-changing trend line: green for bu
FREE

Trading can be quite tiring when you need to look at several things at the same time.
Format of candles, supports, resistances, schedules, news and indicators.
This tool aims to facilitate the analysis of the ADX indicator. It colors the candles based on the levels of the indicator and the DI lines.
The period, the limit of the indicator and the colors of the candles are customizable. You can also place a visual aid on the lower right side of the graph to view the values of ADX, DI + and DI-
FREE

DiNapoli DMAs (迪纳波利置换移动平均线) DiNapoli DMAs 指标将传奇交易员乔·迪纳波利(Joe DiNapoli)所普及的著名“置换移动平均线”带到了 MetaTrader 5 平台。与传统的移动平均线不同,该指标通过向未来时间位移(平移),有效地过滤了市场噪音并减少了虚假信号,使交易者能够更清晰地识别趋势及支撑/阻力位。 本指标包含了迪纳波利最经典的三组参数组合: 3x3: 3周期简单移动平均线,向未来平移3个周期。 7x5: 7周期简单移动平均线,向未来平移5个周期。 25x5: 25周期简单移动平均线,向未来平移5个周期。 核心优势 趋势识别: 消除传统均线的滞后性,更清晰地判断市场方向。 动态支撑与阻力: 均线在趋势行情中常作为价格“反弹”的关键参考点。 噪音过滤: 在震荡行情(横盘)中表现出色,有效避免频繁的错误信号。 高度自定义: 您可以根据个人策略轻松调整周期、平移位数及颜色设置。 使用手册 1. 安装与设置 下载或购买后,从“导航”窗口将指标拖动到图表上。 在**“输入”**选项卡中,您可以通过 show_dma 开关独立开启或关闭三条均线。
FREE
Timeframe Simulator Indicator This indicator redraws candlestick structures from a higher timeframe onto your current chart. It helps visualize higher-period price action without switching timeframes, making it easier to analyze trends and key levels while trading on lower timeframes. Main features: Customizable Candles – Adjust the appearance of higher timeframe candles (bull/bear colors, wick style, gaps, and history length). Higher Timeframe Lines – Optionally display dynamic high, low,
FREE

Investment Castle 指标 — 一眼看懂趋势
一款简洁、不重绘的趋势指标,能在任何时间周期上即时告诉您市场倾向哪个方向。它与 Investment Castle EA 内置的趋势引擎完全相同——让您的决策始终站在行情的正确一侧。
它能为您做什么 清晰的趋势方向: 在每个时间周期上一眼看清主导方向。 图表上的表现数据: 命中率和胜率直接显示在图表上,您可自行判断。 不重绘: 信号固定不变——您看到的就是实际发生的。 体系的一部分: Investment Castle EA 的趋势核心,可与心理关键价位(支撑与阻力)指标自然搭配。 处处适用: 任何品种、任何周期。
适合人群: 希望在入场前快速、真实地判断方向的趋势交易者。
风险提示: 交易存在重大亏损风险。请务必先在模拟账户上测试,并使用您能接受的风险设置。过往表现不代表未来结果。
FREE

ICT TURTLE SOUP PRO Advanced Smart Money Concepts Trading System
ICT Turtle Soup Pro is a comprehensive trading indicator built on ICT (Inner Circle Trader) methodology, designed to identify high-probability trade setups through liquidity sweep detection and multi-timeframe confluence analysis.
FREE

The MT5 K-Line Countdown Indicator is a professional and lightweight utility for MetaTrader 5. It displays the remaining time before the current candlestick closes, helping traders accurately manage entries, exits, and price action strategies. There are even better indicators—get them here. https://www.mql5.com/en/users/aa996a/seller Features: Accurate Real-Time Countdown
Powered by both OnCalculate() and 1-second OnTimer() technology, the countdown continues smoothly even during low-volatility
FREE
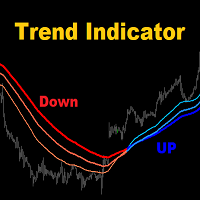
MA3 Trend MT5 - is the good trend indicator on three MAs . Benefits of the indicator: The indicator produces signals with high accuracy.
The confirmed signal of the indicator does not disappear and is not redrawn.
You can trade on the MetaTrader 5 trading platform of any broker.
You can trade any assets (currencies, metals, cryptocurrencies, stocks, indices etc.).
You can trade on any timeframes (M5-M15 scalping and day trading / M30-H1 medium-term trading / H4-D1 long-term trading). Indi
FREE

Sentinel Sessions & KillZones 将三大交易时段——亚洲、伦敦和纽约——以简洁、按颜色区分的 区间方框直接绘制在您的图表上,另外还提供可选的 ICT 风格 KillZone 时间窗口,用于伦敦开盘 和纽约开盘。 每个时段都以 GMT 定义,并换算为您经纪商的服务器时间,因此方框会精确落在真实时段开盘和收盘 的位置——无需猜测,也无需在每次更换经纪商时手动调整偏移。您只需告诉指标您的服务器时钟比 GMT 快多少小时(大多数经纪商为 GMT+2 或 GMT+3),一切便会自动对齐。 每个方框都紧贴其时段的真实价格区间:左右两边是时段的开始和结束时间,上下两边则跟踪该窗口内 K 线的最高价和最低价。当前活跃时段的方框会逐根 K 线实时增长,因此您始终能实时看到正在发展的 时段区间。较早的交易日会按您选择的历史深度保留在图表上。 您将看到 亚洲 / 伦敦 / 纽约时段方框,各有自己的颜色 可选的伦敦开盘和纽约开盘 KillZone 方框,用于 ICT 风格的时机把握 每个方框自动捕捉的时段最高价和最低价 为当前正在运行的时段实时增长的方框 每个方框上简洁的名称标签(完
FREE

Market Structure Highs and Lows Overview:
Market Structure Highs and Lows is a professional indicator that automatically detects and visualizes key price structure points — Higher Highs (HH), Higher Lows (HL), Lower Highs (LH), and Lower Lows (LL). It helps traders clearly see trend direction, reversals, and market flow through a clean ZigZag structure. How it works:
The indicator analyzes swing points using a ZigZag algorithm to define structural highs and lows. Uptrend: Sequence of HH and H
FREE

Volume Zone Analyzer — VSA-Based Volume, Delta & Spread Reader Turn any price zone into a Volume Spread Analysis. Drop two draggable lines on your chart to mark a Zone Start and Zone End , and Volume Zone Analyzer instantly breaks down what happened inside that zone: Total Volume for the selected range Buy / Sell Delta — estimated from where each candle closes within its own high-low range Delta % with a visual buy/sell ratio bar Average Spread , plus a count of wide vs. narrow-spread candles (t
FREE

FREE
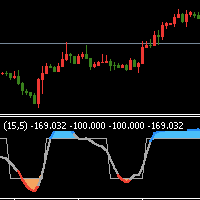
指标简介: 该指标来自网络,相对RSI或CCI更加稳定; 该指标绘制趋势线和高低价格区域,它可以用来分析市场趋势并根据趋势设计新的交易系统; 该趋势指标适用于 M1 及以上时间范围; 指标的简单实用方法:如果指标下跌出现橙黄色区域,则可以选择开多或平仓空头,若指标上涨到蓝色区域,则可以选择开空或平仓多头,当出现上或下箭头信号时候可以开启消息提醒功能,前两个参数框“UpMessages/DownMessages”用于修改邮件消息提醒文字; 需要特别说明的是:任何指标都不是万能的,指标是否有用取决于对指标的使用,而不是试图寻找到一个完美无暇的指标,然后凭借这种指标一劳永逸,那是不可能的。 我的其他指标和 EA 可以在这里找到 : https://www.mql5.com/zh/users/hzx/seller
FREE

The MACD Overlay Pro brings the classic Moving Average Convergence Divergence (MACD) indicator directly onto your main price chart . By plotting the MACD Line, Signal Line, and an additional trend-confirming SMA directly over price candles, this tool eliminates the need to constantly glance at a separate indicator window, allowing for more focused technical analysis . Designed for clean visualization, this indicator uses dynamic color-coding to highlight trend direction and a semi-transparent fi
FREE

TradeVisualizer is a dynamic chart-based indicator for MetaTrader 5, designed to visually display recent trades directly on the chart. It includes: Trade arrows for entry and exit points, color-coded by direction and profit/loss. Dotted lines connecting open and closed trades. Profit/loss labels in pips and currency. Interactive toggle button to show/hide drawings. Trade history panel showing time, ticket, type, lot size, pips, and P/L. Customizable appearance via inputs for colors, fonts, and
FREE
MetaTrader市场是您可以下载免费模拟自动交易,用历史数据进行测试和优化的唯一商店。
阅读应用程序的概述和其他客户的评论,直接下载程序到您的程序端并且在购买之前测试一个自动交易。只有在MetaTrader市场可以完全免费测试应用程序。
