 MetaTrader 5
 专家
专家
 指标
指标
 程序库
程序库
 实用工具
实用工具
 窗口小部件
窗口小部件
 规则
规则
适用于MetaTrader 5的免费技术指标 - 24
 技术指标的信号外汇和股票市场的开仓交易和平仓交易起着至关重要的作用。指标的本质就是一种交易品种的数学转换,旨在预测未来的价格变化。
测试技术指标可以更有利于预测市场行为并从中获利。
技术指标的信号外汇和股票市场的开仓交易和平仓交易起着至关重要的作用。指标的本质就是一种交易品种的数学转换,旨在预测未来的价格变化。
测试技术指标可以更有利于预测市场行为并从中获利。 
BEHOLD!!!
One of the best Breakout Indicator of all time is here. Multi Breakout Pattern looks at the preceding candles and timeframes to help you recognize the breakouts in real time.
The In-built function of supply and demand can help you evaluate your take profits and Stop losses
SEE THE SCREENSHOTS TO WITNESS SOME OF THE BEST BREAKOUTS
INPUTS
MaxBarsback: The max bars to look back
Slow length 1: Period lookback
Slow length 2: Period lookback
Slow length 3: Period lookback
Slow
FREE

LongTerm 是一种方向性分析指标,旨在解读中长期趋势的力量和质量,并特别专注于 long oriented 分析。 它不是入场指标,也不是操作时机工具,而是一种帮助交易者理解市场何时为 long trend 提供有利或不利条件的工具,同时减少短期波动中典型的噪音。 目标
LongTerm 旨在: 识别强劲且结构化的 long trends 区分扩张、放缓和衰竭阶段 提供对主导方向性背景的清晰解读 它是面向 swing trading 和 long term 分析的交易者的理想工具。 颜色和市场条件的解读
LongTerm 使用一种颜色结构,旨在立即读取 long trend 的不同阶段,清楚地突出市场的最佳和最差条件。 绿色线 正向倾斜并位于蓝色线之上
这种配置代表最佳条件。 Long trend 强劲、稳定且结构良好 运动显示连续性和方向性 市场处于趋势扩张阶段 这是中长期 long 分析最有利的背景。 黄色或橙色线 位于蓝色线之上
表示市场仍然偏向 long,但处于放缓或逐步衰竭阶段。 主要方向仍然是上涨 趋势推动力减弱 运动变得不那么高效 这一阶段是成熟趋势的典型阶段,在这
FREE

Inverse Probability Distribution — 枢轴密度与 K-Means 聚类指标 平台: MetaTrader 5 概述 本指标是 MetaTrader 5 的纯技术分析可视化工具。它在历史 K 线上识别确认的枢轴高点和低点,使用 K-Means 聚类对枢轴价格分组,并在图表右侧绘制反向分布剖面。该剖面显示不同价位上历史枢轴价格的密度。指标不生成交易信号,不执行交易。 计算 枢轴识别使用用户设定的左/右 K 线数。 枢轴点存入内存,并按存储上限和计算回看范围裁剪。 K-Means 聚类对存储的枢轴价格分组。聚类数和迭代次数由用户设定。 剖面在计算回看范围内按价格分箱统计枢轴点。分箱数量由 Profile Resolution 设定,并应用平滑。计数最高的箱位标记为 POC。 基于 ATR 的过滤使用 ATR Period 和 ATR Multiplier 减少重叠的支撑/阻力线。价格突破后线条变为虚线。 功能 图表右侧绘制反向分布剖面,宽度和偏移可调。 高亮 POC 及集群颜色。 K-Means 集群中心参考线。 基于枢轴的支撑/阻力线。 可选枢轴点圆点标记
FREE

Stop Switching Timeframes! Are you tired of constantly clicking back and forth between timeframes just to check key levels? Sniper Multi-SR is the ultimate multi-timeframe dashboard designed for traders who demand precision, clarity, and speed. This indicator plots critical Support and Resistance levels from your selected timeframes directly onto your active chart. It gives you a "Sniper's View" of the market, allowing you to identify institutional-grade levels at a glance without cluttering you
FREE

Trend Direction Filter: 我们可以将其定义为一种专业指标,旨在识别市场的主导方向,帮助交易者理解整体背景并更加有意识地操作。 它不是入场指标,而是一种高级方向过滤器,设计用于突出趋势结构并减少市场噪音的影响。 如何运作
该指标通过一种先进的平滑结构分析价格行为,能够区分: 明确的方向性阶段 放缓或过渡阶段 市场犹豫阶段 结果是对主导方向的清晰且稳定的呈现,有助于评估操作所处的背景。 视觉解读
Trend Direction Filter 使用一种简单但极具信息量的图形表示: 深绿色线
代表市场的主要方向。
当它向上倾斜时,表示正在形成上涨结构;当它失去斜率时,表示推动力减弱。 绿色虚线
表示上涨趋势增强。
它出现在主要深绿色线之上,突出显示运动表现出更大稳固性和连续性的阶段。 红色线
突出显示上涨趋势力量的丧失。
它不代表下跌阶段,而是表示市场可能放缓或进入过渡。 清晰度和视觉整洁
Trend Direction Filter 的主要优势之一是它显示市场方向的清晰度。 该指标旨在提供一种简洁且没有多余元素的可视化,使背景能够被立即且无歧义地读取。
这种图形整洁性有
FREE

TM QuantShift Regime Matrix 是一款适用于 MetaTrader 5 的自适应市场状态分析指标。它旨在从日常价格噪音中识别并清晰展示重要的市场行为变化。
该指标结合了三个量化分析模块:
1. 变化点检测 CUSUM 模块分析标准化价格收益率和累积方向压力,用于识别具有意义的市场结构变化。
2. 概率市场状态 状态模型通过评估价格方向、走势效率和波动特征,估算市场当前处于看涨、看跌、震荡或高波动状态的可能性。
3. ATR 波动持续性 波动模块用于判断异常幅度的价格运动是一次性事件,还是持续波动扩张的一部分。
如何解读指标
绿色线段表示看涨结构压力,红色线段表示看跌结构压力,中性线段表示市场尚未形成清晰方向。中央阶梯线标记最近一次检测到结构变化时对应的价格水平。周围的压力线展示正向和负向统计压力的累积过程。
这些线不是支撑位、阻力位、止损位或止盈位。它们用于提供市场分析背景,应与交易者自己的交易策略结合使用。
主要功能
- 自适应 CUSUM 变化点检测 - 看涨、看跌、震荡和高波动状态分析 - 正向与负向压力可视化 - 基于 ATR 的波动
FREE

Mini Charts MTF EMA Mini Charts MTF EMA is a MetaTrader 5 indicator that displays multiple mini charts from selected timeframes directly on the main chart. It helps traders monitor multi-timeframe price movement and EMA direction in one clean visual layout. Main Features Multiple mini charts on the main chart Custom timeframe selection for each mini chart Up to 4 EMA lines for every mini chart Custom EMA period, shift, method, applied price, color, style, and width Custom mini chart width, heigh
FREE

Divergence Signal Alerts is a free indicator for MetaTrader 5 that finds RSI and MACD divergences on the chart. It draws a line between the two price pivots. It puts an arrow on the bar where the divergence became known, and it can send alerts. Signals come from closed bars only. A pivot is known only a few bars after it forms. The arrow goes on that later bar and never moves or disappears. It places no orders. Quick start Attach the indicator to any chart and timeframe. It scans the last 2000 c
FREE

Market Hours Pro shows Tokyo, London, and New York trading sessions directly on your MT5 chart, including scheduled overlap periods. It’s designed to give you a clear view of global market timing so you can plan trades, spot high-activity periods, and align strategies with standard Forex hours. How It Works Displays scheduled session times visually on your chart. Highlights session overlaps for London/New York and Tokyo/London. Automatically adjusts times for your timezone or broker time. Shows
FREE

POI Detector – Automatic Smart Money Points of Interest (POI) Structure Identifier The POI Detector is a MetaTrader 5 indicator developed for traders who use Smart Money Concepts (SMC) and Price Action methodologies. It automates the identification of relevant Points of Interest (POIs) on the chart through strict detection of the ABCD pattern with growing legs and C-Level breakout confirmation (DE extension). Key Features ABCD Pattern Detection Algorithm: Identifies complete structures where
FREE

MT5 锤子与启明星形态指标 这个强大的 MT5 指标可以帮助交易者快速识别图表中的关键反转形态,包括 锤子(Hammer) 和 启明星(Star Bar) 。无论市场趋势如何,这个工具都能帮助你抓住潜在的反转机会。 主要功能与优势: 高/低点检测 :自动比较当前K线与前 X 根K线的高低点,确保信号准确可靠。 影线与实体比例 :顶部或底部影线必须大于实体 X 倍,过滤掉无效信号。 反向影线确认 :确保反向影线大于信号影线 X 倍,提高交易信心。 多种提醒方式 :推送通知到手机,或在图表上显示提示信息,不错过任何机会。 高时间框架推荐 :H4 或以上,让信号更加稳定可靠。 适合所有交易者 :新手可以快速上手,资深交易者可结合自己的策略优化交易。 不重绘 :信号一旦出现就固定,避免误导。 使用这个指标,你可以在市场出现潜在趋势反转时提前布局,优化入场和出场点位。无论是日内交易还是波段操作,这个工具都能显著提高你的决策效率和盈利机会。 立即获取 MT5 锤子与启明星指标,让你的交易更专业、更高效、更稳健!
FREE

VProfile Rebounce Scanner Pro Institutional Volume Profile Entries — Automated Across Your Entire Market Watch Stop guessing where price will react. Let the market's own volume tell you. Every session, the market builds a footprint — where the heaviest trading actually happened, not just where price wandered. That footprint is the Value Area and its center, the Point of Control (POC). Institutions build positions around these levels. Retail traders usually can't see them at all, let alone act o
FREE
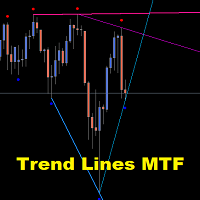
Gold TL MTF - this is a fine stock technical indicator. The indicator algorithm analyzes the movement of the asset price and reflects trend lines along the fractals of a specific timeframe (TF).
Benefits of the indicator: The indicator produces signals with high accuracy. The confirmed signal of the indicator does not disappear and is not redrawn. You can trade on the MetaTrader 5 trading platform of any broker. You can trade any assets (currencies, metals, cryptocurrencies, stocks, indices e
FREE

FTU Moving Average Alert mt5
Alert for price touch and close of moving average Any moving average type Alert sound file option Alert on touch or close over
Usage : Attach indicator from market folder, change type of moving average, style etc
Set alert type
Note: sound folder location is within appdata folder see image, copy wav file into this folder, then change file name within input eg: news.wav / chime.wav / 'anysound'.wav
FREE

查看上下文中的价格 价格背景图是一个免费的 MetaTrader 5 指标,适用于每日、每周和 ADR(平均每日范围)水平。它使与当前会话最相关的参考价格在一张干净的图表上可见。 您无需每天手动标记开盘价、前一交易日的极值和范围边界,而是获得一个结构化地图,其中显示价格现在的位置、正在接近的价格以及已使用了多少典型的每日范围。 为了清晰而不是混乱而构建。 该指标是为那些想要基本背景而不用不必要的工具填充图表的交易者而设计的。级别按类别进行颜色编码,标签放置在图表右侧的专用区域中,附近的标签会自动间隔以保持可读。 专为希望了解每日、每周和 ADR 背景而没有图表混乱的全权日内和价格行为交易者 而设计。 关键级别一览 每日开放 前一日最高价、最低价和收盘价 当日最高价和最低价 每周开放 上周高点和低点 ADR 高位和 ADR 低位 每个可见级别都可以显示其简称、确切价格以及与当前价格的符号距离。外汇交易品种的距离可以自动显示为点,其他工具的距离可以显示为点,也可以手动选择。 了解当前会话 紧凑的仪表板总结了您交易时最重要的信息: 已使用的 ADR:今天覆盖了所选平均每日范围的多少 日内头寸
FREE

NY Opening Range 9:30 Indicator: The NY Opening Range 9:30 indicator is a precision-engineered tool for MetaTrader 5, specifically designed for "Opening Range Breakout" (ORB) traders. It focuses on the high-volatility window that occurs during the New York market open—the most liquid period for indices, equities, and major currency pairs. By identifying and visualizing the price boundaries established in the first few minutes of trading, it provides a definitive structural framework for the rest
FREE

AlphaTrend - Professional Trend Tracking Indicator for MT5 AlphaTrend - Advanced Trend Following System AlphaTrend is a sophisticated trend-following indicator designed for MetaTrader 5, based on the world-renowned algorithm developed by Kıvanç Özbilgiç. This version has been significantly enhanced with a professional Signal History & PnL Dashboard , making it a complete trading workstation for trend traders. Overview AlphaTrend goes beyond simple moving averages. It combines Volatility (ATR) an
FREE

### ADX and DI v1.00
将TradingView上BeikabuOyaji的"ADX and DI"指标忠实移植到MQL4/MQL5。该指标是TradingView上使用最广泛的ADX实现之一,拥有超过43,000名用户。在单个子窗口中显示+DI、−DI和ADX,采用混合平滑方法:方向性指数使用Wilder平滑法,ADX线使用简单移动平均线。
#### 计算原理
该指标实现了Welles Wilder的方向性运动系统,在ADX的最终计算中有一个显著区别:
- **True Range、+DM、−DM** 按照Wilder的原始定义计算,方向性运动之间遵循互斥规则 - **TR、+DM、−DM的平滑** 使用Wilder的滚动求和法:S(i) = S(i−1) − S(i−1)/N + 值 - **+DI和−DI** 为平滑后的方向性运动与平滑后True Range的比值,以百分比表示 - **DX** 衡量+DI与−DI之间的标准化差异 - **ADX** 计算为所选周期内DX的 **简单移动平均线(SMA)** ,而非经典公式中Wilder的SMMA
基
FREE

Multi-Timeframe Candle Timer - Professional Edition Never miss a candle close again. Monitor countdown timers for 7 timeframes simultaneously with visual progress bars and smart alerts. What Makes This Special? This isn't just another candle timer. It's a complete visual timing system designed for professional traders who need precision timing across multiple timeframes. Core Features 7 Timeframe Monitoring - M1, M5, M15, M30, H1, H4, D1 all in one panel Visual Progress Bars - See candle complet
FREE

CORVUX RADAR - 市场与交易条件监控器 MetaTrader 5 的观察型市场条件监控器。 [ 安装指南 | 更新指南 | 故障排除 | 常见问题 | 所有产品 ] 概述 CORVUX RADAR 是一款观察型指标,可实时显示 MetaTrader 5 上的交易条件。 它监控波动性、点差行为、账户风险和交易时段背景,并将它们呈现在一个固定在图表顶部的紧凑水平面板中。 该指标不生成信号、不执行交易、不预测市场方向。 它提供结构化的确定性指标,使交易者能够评估当前条件是正常、升高还是相对于近期历史异常。 CORVUX RADAR 是 CORVUX 生态系统的一部分,这是一个围绕可见性、控制和分析原则设计的交易基础设施工具家族。 主要功能 使用 ATR 比率与近期基准进行实时波动性监控。 点差分析采用自适应 EMA 和异常检测。 账户风险跟踪:保证金水平、回撤百分比和持仓数量。 市场状态检测:趋势、区间、死寂或敌意。 实时点差历史迷你图,带悬停十字线。 适应图表宽度的紧凑水平面板。 仅供观察 — 无信号、无交易执行、无财务建议。 工作原理 输入。 该指标读取所选符号的实时市场数据
FREE

Confluence Bias Map 将关键的市场指标整合为一个单一的实时评分,以支持您的交易分析。 在分析图表时,单独查看多个独立的指标(均线、MACD、ADX、RSI、Stochastic、布林带、MFI、ATR)往往会导致信号冲突和决策瘫痪。在没有结构化方法的情况下,对比不同时间框架的趋势、动能、波动率和成交量很难定义真实的市场偏向。 Confluence Bias Map 通过将这 4 个核心市场维度跨 3 个时间框架整合为一个单一的实时评分,解决了这一问题。 它显示的内容: 圆环仪表盘 (Donut Gauge): 在仪表盘中心显示 0 到 100 的综合汇聚评分 (Confluence Score)。 类别拆解: 显示趋势(基于 EMA、MACD、ADX)、动能(基于 RSI、Stochastic)、波动率(基于布林带)和成交量(基于 MFI)的各自平均评分。 时间框架扫描: 显示 3 个时间框架的独立评分和实时进度条:当前图表周期以及两个更高周期(例如 M15、M30、H1)。 历史实证: 直接在面板上计算并显示信号触发(评分 >= 75 或 <= 25 在 10 根
FREE

Gann Hilo — Precision and Clarity in Trend YouTube Channel: @BotPulseTrading
GannHilo is a technical indicator designed to identify precisely and visually trend changes in the market. Combining price structure with Gann theory, this system draws dynamic lines that act as smart guides of direction and support . Its minimalist design and optimized algorithm allow for a clean and effective reading, showing exactly when momentum shifts direction without noise or unnecessary delays. Ideal for both
FREE

Wyckoff fans, enjoy!
Ideally to be used with the Weis Waves indicator, but it can be easily used alone, the Waves Sizer puts the range (in resulting Price movement) done by the Price on its market swings. You can control how accurate or loose will be the swings. This tool is very helpful for visually know how much the Price has traveled in your Timeframe. This way you can confront this level of effort with the resulting Volume, etc... Weis Waves indicator:
https://www.mql5.com/en/market/produc
FREE
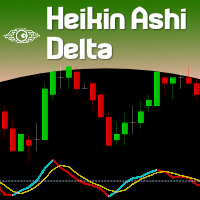
For those who love to trade using the Heikin Ashi Candlesticks, here it is a powerful ally: Heikin Ashi Delta . This indicator was presented by Dan Valcu in his book about Heikin Ashi candlesticks called " Heikin Ashi - How To Trade Without Candlestick Patterns " - and by the way this is a very cool book, we totally recommend it. Even for those of you who don't trade using Heikin Ashi candlesticks could use this Leading Indicator anyway. It is more "nervous" than let's say a Stochastic, but coul
FREE

再也不会错过K线收盘。 Sentinel Candle Timer 是一个简洁、无延迟的当前K线收盘倒计时——直接显示在您的 图表上。无论您是在收盘时入场、避免在K线的最后几秒交易,还是只想与市场时钟保持 同步,这款工具都会始终把精确的收盘剩余时间呈现在您眼前。 计时器通过内置的事件定时器每秒更新一次,因此即使在周末以及成交清淡、报价稀少的 行情中也会持续倒计时——无需等待新的报价,时钟即可继续走动。 显示内容 当前K线收盘的实时倒计时,根据您的时间周期自动格式化为 SS、MM:SS 或 HH:MM:SS。 可选的当前点差(以点为单位)——便于在下单前察觉正在扩大的点差。 可选的当前价格(买价 bid),并按照品种正确的小数位数显示。 颜色预警:在K线收盘前的最后几秒,倒计时会切换为您设置的预警颜色,让收盘绝不 会被忽略。 两种显示模式(可单独或同时使用) 角落标签:固定在您所选任意图表角落的信息面板,将倒计时 + 点差 + 价格显示在 整齐的一行中。 跟随价格文字:紧贴活动K线收盘位置的紧凑倒计时,随着K线的形成与价格一同移动。 完全可配置 选择锚定角落以及精确的 X/Y 像素偏移。
FREE

Apex Point
is a trend-following indicator for MetaTrader 5, transforming complex market data into signals for traders. It displays blue dots for uptrends, red dots for downtrends, and yellow crosses at potential reversals, helping users identify momentum shifts quickly. Key features include a confirmation system requiring multiple bars (default: 3) to validate changes, reducing false signals; dynamic ATR-based offsets for adaptive trailing, with instant ratcheting in the trend direction and smo
FREE

Gatotkaca Support Resistance Trendline Indicator is a simple indicator that detects support, resistance and trendlines. It will helps you find breakout momentum based on lines calculated by this indicator. This is conceptually based on fractals, but with customizable periods. Compatible for any timeframes. You can customize how this indicator work by setting up the period input.
FREE
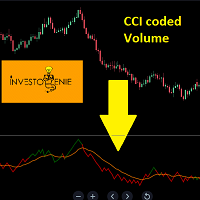
The Indicator is based on Commodity Channel Index (CCI) coded on Volume. The concept is to try and analyze the movement of Volume and Price in a certain direction
Concept:
If the Price of the indicator moves below the threshold price, it turns RED indicating the direction downwards is getting strong.
If the Price of the indicator moves above the threshold price, it turns GREEN indicating the direction upwards is getting strong.
The moving average acts as a great filter to decide entry/exit poi
FREE

CandlePulse Candle Timer MT5 shows the time remaining in the current candle, with a dashboard for up to four timeframes and optional candle-close alerts. Choose a full panel, a compact corner timer, or a countdown beside the latest candle. All features are included at no charge. There is no subscription, external account, or DLL requirement. Main features Multi-timeframe dashboard: monitor the chart timeframe plus up to three additional periods. Duplicate periods are combined into one row. Three
FREE

SMC LIQUIDITY Advanced Institutional-Grade Smart Money and Liquidity Analysis Suite for MT5 SMC LIQUIDITY is a comprehensive institutional toolkit engineered for traders who require precise liquidity mapping, market structure intelligence, smart money concepts, and order flow awareness in a single integrated interface. It is designed for professional workflow, multi-timeframe clarity, and seamless execution in fast-moving conditions. This indicator combines several institutional methodologies in
FREE

介绍强大的NRTR(Nick Rypock Trailing Reverse)指标 - 这是一个必备的技术工具,用于帮助交易员识别趋势反转并设置有效的跟踪止损水平。由Nick Rypock开发,该指标采用独特的算法,可以适应不断变化的市场条件,成为任何交易者工具箱中不可或缺的一部分。
以下是交易员使用该指标的两种常见方式:
1. 趋势反转:NRTR指标在趋势即将反转时生成清晰的信号。留意指标线穿过价格图表,这是潜在趋势方向转变的信号。
2. 跟踪止损:NRTR还可作为可靠的跟踪止损工具,可在趋势市场中保护利润。当价格朝着预期方向移动时,NRTR线会动态地跟随价格,提供灵活的止损水平。
可自定义参数:通过调整指标的参数,将NRTR指标调整为适合您的交易偏好和时间框架。尝试不同的设置,找到最适合您独特交易风格的配置。为了提升交易策略,考虑将NRTR指标与其他技术指标结合使用。使用多个指标可以验证信号,并提高整体交易准确性。
总之,NRTR指标对于希望识别趋势反转并实施有效的跟踪止损的交易员来说是一个宝贵的资产。其适应性和用户友好的设计使其成为交易者中受欢迎的选择,有助于提高交易
FREE

Investment Castle 指标 — 一眼看懂趋势
一款简洁、不重绘的趋势指标,能在任何时间周期上即时告诉您市场倾向哪个方向。它与 Investment Castle EA 内置的趋势引擎完全相同——让您的决策始终站在行情的正确一侧。
它能为您做什么 清晰的趋势方向: 在每个时间周期上一眼看清主导方向。 图表上的表现数据: 命中率和胜率直接显示在图表上,您可自行判断。 不重绘: 信号固定不变——您看到的就是实际发生的。 体系的一部分: Investment Castle EA 的趋势核心,可与心理关键价位(支撑与阻力)指标自然搭配。 处处适用: 任何品种、任何周期。
适合人群: 希望在入场前快速、真实地判断方向的趋势交易者。
风险提示: 交易存在重大亏损风险。请务必先在模拟账户上测试,并使用您能接受的风险设置。过往表现不代表未来结果。
FREE

Short Description Yesterday H/L, Today H/L and ADR% on any chart. Color-coded gradient signals overextension at a glance. Full Description Mattrix Day Levels is a clean, lightweight indicator that displays the four key reference levels every day trader needs: Yesterday High and Low (YH, YL) Today High and Low (TH, TL) Average Daily Range percentage (ADR%) Drawn directly on the chart, the indicator marks the current trading day's progression against its historical range. The today range is shown
FREE

Trading can be quite tiring when you need to look at several things at the same time.
Format of candles, supports, resistances, schedules, news and indicators.
This tool aims to facilitate the analysis of the ADX indicator. It colors the candles based on the levels of the indicator and the DI lines.
The period, the limit of the indicator and the colors of the candles are customizable. You can also place a visual aid on the lower right side of the graph to view the values of ADX, DI + and DI-
FREE

A trend channel indicator based on a rolling linear regression. Over a window of the last N closed candles, it computes the regression line (center line), then plots two parallel bands at a distance of coefficient × standard deviation of the residuals (the distance between each close and the regression line) on either side. The channel is recalculated on every new candle and displayed as a straight segment over the current window only — no curve, no retroactive recalculation across the whole his
FREE

免费 — 用回测从未展示过的方式看清你的点差:逐根K线、与其自身均值对比、以及与你设定的上限对比。
完全免费,无任何限制。如果它在您的图表上派上用场,一条简短的评价对我们帮助最大——只需30秒,这也是其他交易者发现这款工具的唯一途径。
平台: MetaTrader 5(本页面)。MetaTrader 4 版本: https://www.mql5.com/en/market/product/185749
大多数人用指标来过滤入场。在我自己的测试中,我给趋势系统加上的几乎每一个"聪明"的过滤器都让结果变差了 — 它剔除了亏损交易,但同时也剔除了那些本会变成大盈利的突破,净利润因此下降。唯一始终物有所值的过滤器是点差上限。它根本不是一个行情过滤器:它剔除的是那些一开始就不可能盈利的交易,因为入场成本在交易开始之前就吃掉了优势。
要使用这个过滤器,你首先得看清自己的点差究竟在做什么。这个指标的全部用途就在于此。
=== 它画什么 ===
- 每根K线的点差柱状图,以点(point)为单位。
- 最近 N 根K线的点差移动平均 — 你所交易品种的"正常水平"。
- 一条上限线:可以是
FREE

Linear Regression Channel Pro The ultimate tool for statistical trend analysis. Automatically identifies the "Fair Value" of price and volatility extremes. Overview Linear Regression Channel Pro is a professional-grade indicator that automatically draws and updates the Linear Regression Channel for the current market trend. Unlike standard indicators that curve like Bollinger Bands, this tool draws precise straight-line channels based on the "Least Squares" mathematical method. It is designed fo
FREE

This is a simple Volume Weighted Average Price (VWAP) indicator. Simply add it to the chart and adjust the vertical line that is used as start anchor point and it is done.
Volume Weighted Average Price (VWAP) is a trading benchmark that represents the average price a security has traded at throughout the day, based on both volume and price. It is calculated as the sum of price times volume for each trade, divided by total volume.
FREE

Pip Value Calculator - Instant Risk Assessment on Your Chart This powerful and lightweight utility instantly calculates the precise monetary value for any pip movement, displaying it directly on your chart so you can assess risk and potential profit at a glance. At its core, the indicator's sophisticated calculation engine runs silently with every price tick, ensuring the information you see is always up-to-date. It automatically detects the instrument you are trading—whether it's a Forex pair,
FREE

If you like BTC Speed Alpha Indicator, you can also check BTC Speed Alpha EA on my MQL5 profile. The EA version is designed for automated BTCUSD trading with risk control, Break Even, trailing stop, position assist and dashboard panel.
BTC Speed Alpha is a free MetaTrader 5 indicator designed for Bitcoin / BTCUSD traders who want a clean visual tool for reading market direction, impulse movement and potential BUY / SELL opportunities directly on the chart.
The indicator combines an adaptive t
FREE

本指标绘制 累积成交量差值(Cumulative Volume Delta,CVD) —— 即每根 K 线成交量按其收盘方向累加后的运行总和 —— 并将其置于自适应的标准差通道之中。它回答了一个仅靠价格无法回答的问题:这波行情是由市场参与度推动的,还是仅仅在惯性漂移? 累积总和会在您选择的 锚定周期(anchor) 重新开始 —— 每日、每周或每月 —— 因此读数始终相对于当前交易日、当周或当月,而不是相对于图表历史的起点。正是这一个设置,使同一个指标既适用于五分钟的外汇图表,也适用于日线级别的股票图表;它也正是本指标区别于普通累积成交量线的地方,后者只会从您的历史数据碰巧开始的位置一直累加下去。 工作原理 每根 K 线将自身成交量计入运行总和:收盘价高于前一根收盘价时累加,低于时扣减,收盘价持平时保持不变。默认使用跳动量。也可以选择真实成交量;若经纪商未提供,该K线将回退为跳动量。 随后在该累积序列上计算 20 周期的基准线及其标准差,上下通道则按所选的标准差倍数绘制。由于通道由序列自身的波动性构建,因此在参与度变得剧烈时自动扩张、在趋于平静时收缩 —— 无需为每个品种重新调整固定阈
FREE

LIVE TRADES CHARTS – MQL5 INDICATOR
DESCRIPTION Live Trades Charts is a MetaTrader 5 indicator that displays active trading positions directly on the chart.
The indicator reads open trades and shows basic trade and account information in real time.
It updates on every tick.
FUNCTIONS Displays open trades on chart
Per trade information: Symbol Lot size Direction (Buy or Sell) Floating profit or loss Trade duration
Account information: Total floating profit/loss Number of open trades Balanc
FREE

Индикатор для синхронизации и позиционировании графиков на одном и более терминалах одновременно. Выполняет ряд часто необходимых при анализе графиков функций: 1. Синхронизация графиков локально - в пределах одного терминала при прокрутке, изменении масштаба, переключении периодов графиков, все графики делают это одновременно. 2. Синхронизация графиков глобально - тоже самое, но на двух и более терминалах, как МТ5, так и МТ4. 3. Позиционирование графика на заданном месте при переключении периодо
FREE

Market Structure Fractals The structure layer MetaTrader 5 was missing Most traders stare at candles and draw structure manually — imprecisely, inconsistently, and always too late. You know what a fractal high and low look like. The question is whether you can spot every one, mark it cleanly, and track it the moment price breaks through. You can't. Market Structure Fractals can.
MetaTrader 5 shows you price. It doesn't show you structure.
That gap — between a candle pattern and a confirmed bre
FREE
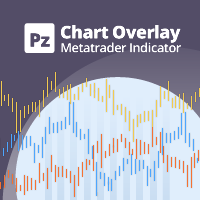
图表覆盖 指标在同一张图表上显示几种工具的价格走势,使您能够评估货币对相对彼此波动的差异。 [ 安装指南 | 更新指南 | 故障排除 | 常见问题 | 所有产品 ]
轻松找到超买或超卖的货币对 在同一图表上绘制最多六个货币对 必要时显示倒置符号 适应图表大小,缩放和时间表 自动价格水平计算 可定制的价格水平密度 可自定义的颜色和尺寸
什么是反向货币对? 反转货币对意味着显示两种货币之间的汇率,从而反转交易的主要货币。例如,如果要将EURUSD,GBPUSD和USDJPY绘制到同一覆盖图中,则有必要反转USDJPY以使价格反映反向汇率:JPYUSD。这样,日元/美元价格将与覆盖图的其他两个符号呈正相关关系移动,从而使图表更易于研究。
测试指标 该指标使用来自多个交易品种的价格数据绘制单个图表。由于MetaTrader 4测试仪(在撰写本文时)不支持多货币回溯测试,因此该指标无法回溯测试,因为它将不会收到来自其他本应覆盖的交易品种的报价。要测试它,请租用一个月。
输入 符号设置-键入要在覆盖图上显示的货币对或符号的名称。您需要至少输入其中之一,以便覆盖图具有两个货币对(本机和外
FREE

ICT TURTLE SOUP PRO Advanced Smart Money Concepts Trading System
ICT Turtle Soup Pro is a comprehensive trading indicator built on ICT (Inner Circle Trader) methodology, designed to identify high-probability trade setups through liquidity sweep detection and multi-timeframe confluence analysis.
FREE

TradingViewMACD TV MACD Pro + SNR 支撑阻力指标是一款专业的交易工具,融合了 TradingView 经典 MACD 配色与自适应支撑阻力检测功能。
本指标包含两大核心模块,可独立开启或关闭。
MACD 模块:完全复刻 TradingView 经典 MACD 配色方案,采用蓝绿色和红色柱状图,清晰区分放量与缩量。支持自定义快线周期(默认12)、慢线周期(默认26)、信号线周期(默认9)以及柱状图放大倍数。
支撑阻力模块:自动检测并绘制当前有效的支撑位和阻力位。价格突破后,水平线会自动更新到下一个有效位置。可设置确认K线数量来过滤假信号,被突破的线会自动变为虚线,便于识别。
两个模块可同时使用,也可单独关闭。所有颜色和线宽均可自由调整。
本指标适用于趋势跟踪、突破交易、波段交易和日内短线交易。支持任何时间周期和任何交易品种,包括外汇、加密货币、指数和大宗商品。
FREE

该指标显示的信号买入和卖出。
时间栏:任意。
情侣:任何。
参数alertsMessage - 禁用和启用的消息框。
参数alertsSound - 关闭或开启声音。
参数箭头类型 - 选择射手的图标,
三是没有过滤的信号指示灯的复杂方式:
1)检查指标的方向更高级的时间表。 2)使用标准图表MACD。 3)使用的指标抛物线。
它应该也不会忘记利用资金管理和止损。 中国传统:
该指标显示的信号买入和卖出。
时间栏:任意。
情侣:任何。
参数alertsMessage - 禁用和启用的消息框。
参数alertsSound - 关闭或开启声音。
参数箭头类型 - 选择射手的图标
三是没有过滤的信号指示灯的复杂方式:
1)检查指标的方向更高级的时间表。 2)使用标准图表MACD。 3)使用的指标抛物线。
它应该也不会忘记利用资金管理和止损。
FREE
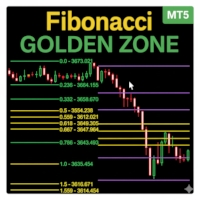
Fibonacci Sessions 指标是一款强大的交易工具,专为精准剥头皮和日内策略而设计。它会自动绘制纽约、伦敦和亚洲交易时段的关键斐波那契水平,为交易者提供主要市场时段的价格动态清晰视图。每个交易时段都会突出显示独特的“黄金区域”,这是价格最常反应的地方。这为反转、突破和趋势延续交易创造了高度可靠的区域。该指标直观展示了价格如何经常从一个黄金区域移动到另一个黄金区域,帮助交易者捕捉持续性的机会。该指标针对 XAUUSD 的 M5 时间框架进行了优化,同时在其他外汇货币对和全球指数上也表现出色。无论您交易的是黄金、外汇还是指数,这个基于交易时段的斐波那契指标都会为您提供额外优势,帮助识别高概率交易区域。主要功能:自动绘制亚洲、伦敦和纽约时段斐波那契水平;清晰显示每个时段的黄金区域;识别价格从一个黄金区域到另一个黄金区域的重复走势;优化用于 XAUUSD M5 时间框架;适用于外汇和全球指数;适合剥头皮交易者和日内交易者。 红线:极限盈利目标位 黄线:黄金区域(高概率反应区) 其他彩色线条:基于交易时段的斐波那契水平
FREE

Now free. Plan every trade before you click, see your real risk, reward and lot size right on the chart.
Plan the trade. See the risk. Trade with confidence.
Trade Planner Pro turns any chart into a visual trade-planning workspace. Drag three lines — Entry, Stop Loss and Take Profit — and instantly see your risk/reward ratio, the exact lot size for your chosen risk %, the real money you put on the line, the spread cost, and clear warnings before you commit. No more manual lot math, no more gu
FREE
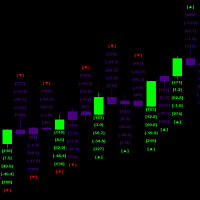
This indicator helps identify the start of significant market movements by analyzing candle patterns and their relative price action strength
the indicator runs multiple simultaneous calculation every millisecond and it also does a triple set verification historically in order to calculate future probabilities the historical processing has to be completed before new Candlestick can be processed as one total set out of the total available history from the starting date and time in order to
FREE

Smart MCD (Hot Money) is a MetaTrader 5 indicator that visualizes three market-participant groups as color-coded histograms in a separate window, all normalized to a 0-20 scale. It uses a sensitivity-weighted, offset-adjusted RSI engine to suggest when large capital is entering or leaving the market. Features Three participant views: Retailer (a fixed ceiling reference at 20), Hot Money (short-term institutional flow) and Banker (longer-term smart-money flow). Normalized scale: all groups read o
FREE

The Average Directional Index (ADX) is a technical analysis indicator developed by J. Welles Wilder in 1978. Its primary function is to measure the strength of a trend, regardless of its direction, and to determine whether the price has entered a sideways trend. It is also mentioned by John Murphy in *The Visual Investor* (2005) as an indicator that helps determine whether a market is ranging or is about to start a new trend. As for Exponential Moving Averages (EMAs), some authors believe that
FREE

Jireh RSI MA Breakout Jireh RSI MA Breakout 是一款多重过滤技术指标,用于在 RSI 出现相关超买或超卖条件后,识别价格对移动平均线的突破。 该指标将 移动平均线突破、RSI 条件、突破K线强度、高时间周期趋势确认以及成交量分析 整合到一个可视化系统中。 所有交易信号均基于已收盘K线进行确认,使突破信号更加清晰和客观。 可视化界面 指标提供完整的图表可视化分析界面: 蓝色线 — 主移动平均线 RSI 子窗口 — 启用后持续显示在图表中 绿色箭头 — 买入信号 红色箭头 — 卖出信号 红色线 — 每个信号对应的止损水平 绿色线 — 每个信号对应的止盈水平 统计面板 — 盈利、亏损、待定信号和胜率 启用 RSI 子窗口后,RSI 将持续显示在图表中,用户可以随时观察 RSI 的变化以及超买和超卖区域,而不是只在出现交易信号时显示。 当有效突破信号得到确认时,指标会在对应的信号K线上显示买入或卖出箭头,并自动计算相应的止损和止盈水平。 SL 和 TP 以短信号水平线的形式显示在信号附近,而不会无限延伸至整个图表。用户可以设置线段长度、宽度和颜色,也可
FREE

The Penta-O is a 6-point retracement harmonacci pattern which usually precedes big market movements. Penta-O patterns can expand and repaint quite a bit. To make things easier this indicator implements a twist: it waits for a donchian breakout in the right direction before signaling the trade. The end result is an otherwise repainting indicator with a very reliable trading signal. The donchian breakout period is entered as an input. [ Installation Guide | Update Guide | Troubleshooting | FAQ | A
FREE

RadarSignal XAUUSD — Multi-Timeframe Radar Dashboard for Gold Trading Stop guessing where Gold is heading. Let the Radar scan it for you. RadarSignal XAUUSD is a multi-timeframe technical dashboard built specifically for XAUUSD (Gold) traders who want a single, clean, visual answer to three questions every trade requires: Where do I enter? Where is my safe invalidation zone? Where is my realistic target? Instead of flipping between five indicators on three charts, RadarSignal fuses ADX, RSI, CCI
FREE

Session Breakout & Range Indicator
Overview A lightweight, clean utility indicator designed to plot the high and low of the Asian trading session while clearly dividing the Asian, London, and New York sessions on your MetaTrader 5 charts. Ideal for session breakout strategies, ICT concepts, and liquidity sweeps.
Key Features
Asian Session Range Box: Automatically calculates and highlights the exact High and Low formed during the Asian session.
Session Separators: Distinct visual dividers ma
FREE

趋势,趋势指标,动量,振荡器,直方图,趋势强度,市场流动,趋势确认,看涨,看跌,技术分析
Trend Flow Oscillator 是一个市场流动性与动量指标,旨在帮助交易者清晰、简洁、快速地识别价格走势的强度和方向。 在 M5 时间周期中效果尤为显著,因为该周期中市场流动变化更加频繁。 功能 识别买卖力量的变化与延续 显示价格运动的加速与减速 帮助确认顺势入场 以独立柱状图形式展示市场流动 作为方向性动量振荡指标使用 适用人群 主观交易者 短线和日内交易者(特别是 M5) 寻求流动性确认而非自动信号的交易者 趋势及回调交易者 喜欢简洁直观指标的用户 使用方法 推荐使用时间周期:M5 柱状图解读: 正值柱表示买方力量增强 负值柱表示卖方力量增强 柱体越大,动量越强 该指标可用于: 确认顺势交易入场 避免逆势交易 验证突破及趋势延续 建议结合以下方法使用: Price Action 支撑与阻力 市场结构 说明:该指标为确认工具,不应作为单一入场信号使用。 限制 不是交易机器人 不会自动开仓或平仓 不预测市场走势 不替代风险管理 不保证盈利 风险提示 金融市场交易具有高风险。
历史表
FREE

Trend Rapture 是一款先进的算法指标,基于自适应波动率分析识别高概率的趋势入场和出场点。采用卡尔曼滤波引擎过滤市场噪音,提供清晰、可操作的信号。 主要功能 双核策略引擎:在回调交易和突破交易逻辑之间即时切换。 自适应波动率通道:通过动态Z-Score自动适应市场条件。 内置交易模拟器:在图表上直接可视化入场点、出场点和盈亏。 完全可定制界面:无需打开设置即可实时管理策略的交互式控制面板。 专业警报:支持终端弹窗、推送通知和电子邮件警报。 策略模式 TACTICAL(回调):均值回归交易,价格回调至均衡线时发出入场信号。 RAPID(突破):趋势跟踪和动量交易,价格突破波动率通道时发出信号。 出场逻辑(RAPID模式) TREND RIDER:持仓至趋势反转,适合捕捉长期宏观趋势。 MOMENTUM FADE:价格回到通道内时立即退出,适合动量减弱时锁定利润。 适用周期 M5–M15:适合RAPID模式,日内频繁信号。 M30–H1:通用最佳区间,两种模式均适用。 H4–日线:适合TACTICAL模式,波段交易。 周线+:宏观趋势过滤器。 技巧:结合两个周期使用——高周期判断
FREE

-- 简单而有效。 反转指标 - 是什么?
一种结合超级趋势逻辑与指数曲线技术的趋势跟随叠加指标。它能识别趋势方向,在图表上绘制动态通道,并在趋势反转时发送实时警报。
工作原理
该指标通过ATR与超级趋势因子计算指数基准线。当价格收盘突破该基准线时,确认趋势反转。绿色箭头标记买入趋势启动,红色箭头标记卖出趋势启动。
功能特性:
基于ATR的指数趋势基准线与动态通道 绿色/红色趋势线及填充通道 趋势反转时的买入/卖出箭头信号 内置警报:弹窗、推送通知、邮件、声音 重复警报防护(每根K线仅触发一次警报) 完全可定制:颜色、线条粗细、箭头尺寸、通道宽度 无延迟的简洁图表叠加层
输入参数:
指数速率、超级趋势因子、ATR周期、通道宽度 开关控制:通道填充、箭头、各警报类型 所有视觉元素支持全色系定制
最佳适用场景:任意品种、任意周期。适用于外汇、指数、大宗商品及加密货币图表。
FREE

Magnet Wall 指标是适用于 MetaTrader 5 的、基于 ATR 的 无重绘 趋势通道系统。它在价格上方和下方绘制两条自适应通道,像“磁性墙”一样:在趋势完好时把价格包裹在内部,一旦价格有效突破墙体,趋势即发生翻转。K 线和通道会根据当前有效趋势自动变色,买入或卖出信号在趋势反转的那一刻被确认。该指标基于 Wilder ATR(倍数可配置)构建,采用非对称突破‑锚定算法(不是标准 Supertrend),并内置完整的提醒系统,支持弹窗、推送通知、邮件和声音提醒。 MT4 版本地址: Magnet Wall MT4 更多产品请见: 所有产 品 如需查看真实账户示例和最新工具,请访问我的个人主页并发送好友请求,以免错过更新! 工作原理 非对称 ATR 趋势通道 在每一根收盘 K 线上,指标会按照可配置的回溯长度(默认:5 根 K 线)计算 Wilder ATR,并乘以通道宽度倍数(默认:7.6),得到一个 Δ 值,用来确定上下通道相对于源价格的距离。当源价格收盘于某一侧通道之外时,对应的“墙”会贴合到新的极值位置;当价格保持在通道内部时,两侧墙体保持不动。上下通道之间
FREE

BluePrint Adaptive Trader - Professional Trading System Advanced Channel Trading System based on our proprietary TrenderFlex PRO algorithm Learn more about TrenderFlex PRO KEY FEATURES • TrenderFlex PRO Channel Technology - Advanced channel calculation based on our proven algorithm
• Adaptive Risk Management - Automatic TP/SL calculation based on channel width
• Win Rate Statistics - Real-time tracking of TP1, TP2, TP3 success rates
• Multi-Timeframe Analysis - Monitor 7 timeframes simultaneou
FREE

Dual Period Filter — 双周期滤波 Coppock 曲线指标 指标简介 Coppock 曲线(估波曲线)由长、短两段动量变化率相加后平滑得到,用于观察中期动量的方向与强度。本指标在经典算法基础上做了两点扩展: 一是先对价格源做一次可选的自适应滤波,提供 9 种处理方式(关闭、SMA、EMA、RMA、Double WMA、Triple VWMA、HMA、LLAMA、Kalman),先用滤波压制噪音,再计算动量,曲线更平滑; 二是把计算结果拆成三种可视化形式——彩色曲线、四态柱状图、零轴穿越箭头,方向、强度、转折一次看全。 指标运行在独立的副图窗口,适用于外汇、贵金属、指数、加密货币等任意品种和任意周期。所有历史柱的数值基于已收盘数据计算,不会重绘。 图表显示内容 Coppock 曲线 上升时显示为多头色,下降时显示为空头色,走平时为中性灰色。颜色只反映曲线的变化方向,不代表买卖建议。 四态柱状图 以零轴为界,用四种颜色表达动量状态: 零轴上方且上升:多头动能较强 零轴上方但下降:多头动能减弱 零轴下方但上升:空头动能减弱 零轴下方且下降:空头动能较强 同侧颜色的深浅变
FREE
Vertical Margin is a lightweight MT5 chart scaling utility for MetaTrader 5 that adds configurable vertical space above and below the visible price action. It improves the standard MT5 auto-scale behavior by keeping additional chart margin around the highest and lowest visible candles. This makes the chart easier to read, analyze and draw on without constantly adjusting the price scale manually. The indicator automatically recalculates the vertical margin when you zoom, scroll or change the visi
FREE
This indicator was developed to support multiple timeframe analysis. In the indicator settings, the user can set the color, width, and style of the horizontal lines for each timeframe. This way, when the horizontal lines are inserted into the chart, they will be plotted with the timeframe settings.
MTF Lines also allows visibility control of another objets like rectangles, trend lines and texts.
This is a product developed by Renato Fiche Junior and available to all MetaTrader 4 and 5 users!
FREE

MTF RSI Fusion Basic 是 MetaTrader 5 振荡器,将一个基础相对强弱指数(RSI)与最多两个可选 RSI 来源组合。每个来源可设置时间周期、计算周期和应用价格,两个附加来源各自具有权重和组合模式。 指标显示 Fusion RSI 曲线、基于平均真实波幅(ATR)的动态超买和超卖区域,以及可选的快慢移动平均线。均线可在指标窗口中基于 Fusion RSI 绘制,也可在主图中基于价格绘制。功能不包括背离检测、买卖信号、趋势方向着色或成交量加权平均价格(VWAP)振荡器。 RSI1 Period、RSI2 Period、RSI3 Period 默认分别为 7、14、28,三个来源初始均使用当前图表周期。Enable RSI2 和 Enable RSI3 控制附加来源;RSI2 Weight 和 RSI3 Weight 控制其贡献。组合模式包括 ADD、SUB、AVG、ADDSUB、SUBADD。Clamp output to 0..100 将结果限制在 0 至 100。 Enable Dynamic OB/OS、OB/OS Timeframe、ATR Lengt
FREE

ICONIC TRENDLINE 适用于 MetaTrader 5 标题: ICONIC TRENDLINE:带多周期(MTF)面板与提醒的高级趋势指标 简要说明 还在总是 太晚 识别趋势、并在震荡市里被 假信号 误导吗?MT5 指标 ICONIC TRENDLINE 正是为此而生。它将 智能 EMA 逻辑 与 ADX 趋势强度 结合,提供 清晰、提前、已过滤 的趋势信号。借助 动态趋势线 、 多周期仪表盘 和 即时推送通知 ,你的交易将比以往更 自信 、更 精准 。 指标关键特性 动态变色趋势线 在图表上绘制一条清晰的趋势线,并依据当前方向自动变色: 蓝色: 已确认上升趋势(多头)。 红色: 已确认下降趋势(空头)。 在 中性 阶段,趋势线保持 上一个颜色 ,以避免不必要、易误导的频繁变色(“拉锯/假突破”)。 基于 ADX 的智能趋势过滤(核心) 仅当关键 EMA( 9、21、50 ) 按正确顺序排列 且 ADX 达到 最低强度 (默认 > 20 )时才发出趋势信号。该过滤器能有效排除大多数假信号高发的 弱势/横盘 市场。 多周期(MTF)GUI 面板 一眼把握“大局观”!图表右侧
FREE

這是最終的RVI指標。 添加警報箭頭 他可以確定潛在的阻力水平 額外的2個過濾器,以提高讀數 另外平滑以顯示良好的效果 它被配置為從m1到m30的短時間範圍 也不會很糟糕 我建議使用此指示器和屏幕截圖macd中的其他過濾器 這是最終的RVI指標。 添加警報箭頭 他可以確定潛在的阻力水平 額外的2個過濾器,以提高讀數 另外平滑以顯示良好的效果 它被配置為從m1到m30的短時間範圍 也不會很糟糕 我建議使用此指示器和屏幕截圖macd中的其他過濾器 這是最終的RVI指標。 添加警報箭頭 他可以確定潛在的阻力水平 額外的2個過濾器,以提高讀數 另外平滑以顯示良好的效果 它被配置為從m1到m30的短時間範圍 也不會很糟糕 我建議使用此指示器和屏幕截圖macd中的其他過濾器
FREE
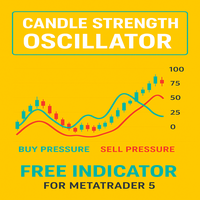
Candle Pressure Index (CPI) is a powerful yet easy-to-use indicator designed to reveal the hidden buying and selling pressure behind every candle. Instead of simply showing whether the price moved up or down, CPI digs deeper into how strongly buyers or sellers controlled the market within each candle. This makes it a unique tool for identifying trend strength, spotting reversals early, and confirming entry or exit points with higher accuracy.
Unlike traditional oscillators that only react to p
FREE

Adiciona marca d'água com nome do ativo em negociação. Pode ser ajustado definindo tamanho da fonte e coloração do texto. Testado com vários ativos do mercado B3 e Forex Adione ao gráfico e configure de acordo com a necessidade. Caso tenha problemas sinta-se a-vontade para nos avisar e providenciaremos a correção logo que possível. ______________________________
FREE
MetaTrader市场是您可以下载免费模拟自动交易,用历史数据进行测试和优化的唯一商店。
阅读应用程序的概述和其他客户的评论,直接下载程序到您的程序端并且在购买之前测试一个自动交易。只有在MetaTrader市场可以完全免费测试应用程序。
