 MetaTrader 5
 专家
专家
 指标
指标
 程序库
程序库
 实用工具
实用工具
 窗口小部件
窗口小部件
 规则
规则
适用于MetaTrader 5的免费技术指标 - 16
 技术指标的信号外汇和股票市场的开仓交易和平仓交易起着至关重要的作用。指标的本质就是一种交易品种的数学转换,旨在预测未来的价格变化。
测试技术指标可以更有利于预测市场行为并从中获利。
技术指标的信号外汇和股票市场的开仓交易和平仓交易起着至关重要的作用。指标的本质就是一种交易品种的数学转换,旨在预测未来的价格变化。
测试技术指标可以更有利于预测市场行为并从中获利。 
Accurate Buy Sell System is a clean and reliable swing-based indicator designed to identify trend reversals and entry zones with high precision. The algorithm follows the original “Accurate Swing Trading System” concept from TradingView (by ceyhun) and has been fully re-engineered for MetaTrader 5. 1:1 match with TradingView behavior
Works on all symbols and timeframes
Clean non-repainting signals when used after candle close
Visual BUY/SELL arrows + colored dynamic trendline
Popup ale
FREE

NWOG Ndog Midnight Open Ict Tjmas is a 100% Free institutional MetaTrader 5 indicator for Inner Circle Trader (ICT) traders. It automatically calculates and plots the full High/Low Opening Gap Ranges, 50% Consequent Encroachment (CE) midpoints, and 00:00 New York Midnight Open with automatic US Daylight Saving Time (EST/EDT) synchronization. KEY INSTITUTIONAL FEATURES: 1. Full New Week Opening Gap (NWOG) Range & 50% CE Automatically measures the gap between Friday 17:00 EST close and Sunday 18:0
FREE

SnR Levels for MT5 SnR Levels is a smart support and resistance indicator for MetaTrader 5 designed to help traders identify important price levels where the market is likely to react. It brings more structure and clarity to the chart by highlighting key areas that can serve as potential reversal zones, breakout points, entry areas, stop loss references, and take profit targets. This indicator is built for traders who want a cleaner and more disciplined way to read market structure. Instead of
FREE

Imagine VWAP, MVWAP and MIDAS in one place... Well, you found it! Now you can track the movement of Big Players in various ways, as they in general pursue the benchmarks related to this measuring, gauging if they had good execution or poor execution on their orders. Traders and analysts use the VWAP to eliminate the noise that occurs throughout the day, so they can measure what prices buyers and sellers are really trading. VWAP gives traders insight into how a stock trades for that day and deter
FREE

核心用途 一款专为 MetaTrader 5(MT5)设计的常驻十字光标指标。它解决了 MT5 原生十字光标的核心局限,包括需手动激活、点击后自动消失、实线遮挡 K 线等问题,通过提供顺滑的专业级十字光标体验,优化图表分析流程。 核心特性 自动激活:加载后立即生效,替代原生 Ctrl+F 功能。点击图表任意位置仍保持十字光标状态,无需手动切换。 优化视觉设计:默认采用点状线条,避免遮挡 K 线、技术指标等图表核心内容,视觉呈现更简洁。 可自定义设置:支持调整十字线颜色、线条样式(点状 / 虚线 / 实线等,兼容 ENUM_LINE_STYLE 全系列)及线条宽度,适配不同图表背景与个人使用习惯。 实时鼠标跟随:十字线随鼠标移动精准更新,快速定位价格与时间坐标,助力高效对比历史 K 线关联关系,提升分析效率。 低干扰设计:禁用鼠标悬停工具提示,避免弹窗遮挡;卸载指标时自动清理十字线对象,无残留图表垃圾,不改动原图表设置。 快速设置指南 下载指标文件后,导入 MT5 平台(导航栏 > 指标 > 导入)。 在 MT5 图表中加载指标(导航栏 > 自定
FREE

Volume Arrow Scanner MT5 The Volume Arrow Scanner is a professional multi-timeframe trend and momentum indicator designed to identify high-probability buying and selling opportunities by analyzing market direction, momentum changes, and crossover events. It displays all trading signals directly on the price chart, allowing traders to quickly identify potential entries and exits without using a separate indicator window. Key Features Multi-Timeframe Trend Analysis The indicator can analyze price
FREE

产品简介 Dynamic Fibonacci Deviation 是一款专为 MT4 和 MT5 双平台设计的自适应斐波那契水平线主图指标。它创新性地将 EMA 动态中线、标准差波动率与斐波那契比例相结合,构建出能够随市场波动自动伸缩的智能支撑阻力系统。该指标通过超买超卖识别与回落反弹信号,帮助交易者在均值回归行情中精准捕捉高概率的买卖时机,并提供完善的实时状态监控与多通道信号提醒。 核心功能 自适应斐波那契通道与 K 线染色 系统以 EMA 作为动态中线,结合标准差计算当前市场的波动幅度,并通过 EMA 平滑后的最大偏离倍数动态调整斐波那契比例。通道上下各绘制 6 条水平线,涵盖 0.191、0.5、0.75、1.0、1.382、1.618 等经典斐波那契比例,颜色从绿色(低位)渐变到紫色(高位),让价格所处的波动区间一目了然。图表右侧会实时显示当前的 中线价格 和 标准差数值 。 MT5 版本额外支持趋势 K 线染色功能 ,让超买超卖状态通过颜色变化更加直观。 做多信号 Oversold (超卖) :当价格收盘价跌破下轨第 4 水平线 (Dn4, 1.0
FREE
This indicator calculates support and resistance prices in multi-timeframe with different formulation and draw them on the chart that style do you choose. And If you want, Indicator can alert you when the current price arrive these pivot levels. Formulations: Classic, Camarilla, Woodie, Demark, Floor, Fibonacci
Alert Options: Send Mobil Message, Send E-mail, Show Message, Sound Alert
Levels: PP, S1, S2, S3, S4, S5, R1, R2, R3, R4, R5, TC, BC and Middle Points Why do you need this indicator:
Ti
FREE

Candlestick Signal Alerts is a free indicator for MetaTrader 5 that marks 13 classic candlestick patterns on the chart. Each gets an arrow and a short label on the bar that completes it, and the indicator can alert you when one appears. It is for traders who read candles and want the patterns found for them. It works on closed bars only. A mark appears when its bar has closed and never moves or disappears. It places no orders. Quick start Attach the indicator to any chart and timeframe. Marks ap
FREE

Candle Countdown Pro — 产品介绍 产品是什么 Candle Countdown Pro 是一款轻量级的 MetaTrader 5 指标,可在您的图表上显示 当前 K 线收盘的实时倒计时 。它每秒都在倒计时——从一根 K 线开盘到收盘——让您随时清楚知道下一根 K 线形成前还剩多少时间。 它是为那些在 K 线收盘时 进行交易(例如在柱线收盘时入场、出场或设置警报)并且需要一个精确、始终可见、无延迟的计时器的交易者而设计的。 优势 即使市场平静也始终准确。 该计时器采用智能服务器时间估算,即使市场几乎没有波动,也能平滑倒计时(许多计时器在这种情况下会卡住)。 无杂乱、无闪烁。 只有一个干净的倒计时标签;图表对象是预先创建的,仅在文字变化时才更新。 超轻量。 仅一个 1 秒计时器,零指标缓冲区——即使在多个图表上同时运行,也几乎不占用 CPU 或内存。 绝无重复显示。 指标启动时具备自愈功能:图表上任何旧的或残留的计时器对象都会被自动清理(v1.01)。 一目了然。 自适应时间格式——小时及以上图表显示 H:MM:SS ,更低周期显示 MM:SS ——固定宽度,文字不会
FREE

Strifor Pivot ATR Target
MetaTrader 5 的 ATR 目标枢轴指标及分析面板 Strifor Pivot ATR Target 是一款用于日内和中期交易的工具,将经典枢轴点与动态 ATR 目标和扩展分析面板结合。该指标帮助交易者提前评估交易区间、可能的价格反应区域及价格潜力,免去手动计算和主观判断。 主要功能 自动绘制枢轴水平(PP, R1–R3, S1–S3) 根据平均波动率计算 ATR 目标百分比 上涨与下跌的独立目标(ATR Long / ATR Short) 信息面板显示: 当前 ATR 值 当日区间已完成百分比 剩余潜力 从高点/低点的运动评估 可考虑前一交易日的数据 灵活设置线条和面板显示 支持所有类型的工具:指数、货币、商品、加密货币 完全兼容 MT5(套期保值和净额账户) 工作逻辑
指标根据前一日的数据绘制枢轴水平,并确定 ATR(14) 运动目标。
ATR 目标显示统计上可能的日内区间,帮助判断: 是否有足够潜力进入交易 市场是否已完成大部分日内波动 基于波动率的潜在支撑/阻力水平 分析面板实时更新,方便追踪市场关键波动参数,减少
FREE

SMART SD ARROW INDICATOR
Trade Smarter, Not Harder: The Smart SD Arrow Indicator That Paints Clear Buy & Sell Signals Right On Your Chart!
Finally, an All-in-One Supply & Demand Tool That Doesn’t Just Draw Zones—It Gives You Precise, Actionable Entry Arrows. Stop Analyzing, Start Executing.
Dear Trader,
Let's be honest. You've tried indicators that draw complicated zones all over your chart. They look smart, but when it's time to pull the trigger, you're left with the same old question:
FREE

Yoshi Adaptive RSI Adaptive Confirmed Momentum for MetaTrader 5 Momentum tools are useful only when their signals are read in context. A standard RSI can react quickly to small price changes while the current candle is still forming. That may tempt traders to act before the move is confirmed. The real challenge is not simply finding an overbought or oversold reading, but understanding whether momentum is holding, weakening, or leaving an extreme area at a meaningful point on the chart. Yoshi Ada
FREE

THE BRAIN SMC ULTIMATE "Trade Like an Institution, Analyze Like a Professional" Are you tired of cluttered charts, lagging indicators, and conflicting signals? Welcome to the era of Clean Trading.
The Brain SMC Ultimate is engineered for traders who prioritize visual clarity without sacrificing data accuracy. Utilizing the latest Smart Money Concepts (SMC) algorithms, this indicator maps institutional footprints directly onto your MetaTrader 5 chart.
CORE PREMIUM FEATURES Smart Entry Guidan
FREE

EA Performance Dashboard: Trading Account Analytics Panel for MT5
A dark, draggable performance dashboard that runs directly on your MT5 chart. It shows balance and equity curves, drawdown, trade statistics, a per-EA (Magic Number) table and prop firm limits (FTMO, FundedNext). It works from your account history, with no DLLs and no external services.
EA Performance Dashboard brings the kind of account analysis you would see on Myfxbook or FXBlue into MetaTrader 5. It analyzes your clo
FREE

RSI Adaptive T3(中文说明) 说明:MQL5 市场要求产品描述中的输入参数名称、输出信息与截图均为英文,因此正式上架请以英文版描述为准;本中文版用于对照阅读,参数名称保留英文原文。 简介 RSI Adaptive T3 是一款用于 MetaTrader 5 的趋势与动量指标,直接叠加在价格图表上显示。它由两部分组成:一条平滑长度随 RSI 数值自动变化的 T3 均线,以及同一条线向后平移两根 K 线的副本。两条线之间的间距与相互穿越,用来观察当前方向与短期动能的变化。指标还可选显示波动率带与交叉标记。 图表上显示的内容 自适应 T3 线 主线是基于收盘价计算的 T3(Tillson)均线,其平滑长度不是固定的:每根 K 线都会根据 RSI 数值重新计算长度,并限制在用户设定的区间内。RSI 走高时长度变短,均线更贴近价格;RSI 走低时长度变长,均线更平滑。当该线高于其两根 K 线前的数值时显示为上涨色,低于时显示为下跌色。 延迟线(两根 K 线前的 T3) 第二条线显示同一条自适应 T3 向后平移两根 K 线的结果。用两条线而不是一条线,可以让短期斜率变得直观:两线张开
FREE
该指标会在您设定的时间自动绘制垂直线,并可选择性地在这些时刻的开盘价处添加水平线。它帮助交易者标记关键事件,例如市场开盘时间、策略时间或自定义的日内水平。 Features: 每天最多绘制 两条可自定义的垂直线 。 可选择从指定时间的开盘价绘制 水平线 。 完全可自定义 颜色、样式和线条宽度 。 轻量、快速,不会拖慢图表。 适用于任何 交易品种和周期 。 如果只需要 一条线 ,将第二个时间留空即可。 如果不想要任何线条,请将两个时间都留空。 How to Use: 将指标加载到任意图表。 在输入参数中设置所需时间(如 07:00, 14:30)。 调整线条的样式、颜色和宽度。 可选:选择哪个时间生成水平线。 如果需要更少甚至不需要线条,请留空输入。 该工具非常适合需要 清晰视觉标记 的交易者,用于标注交易时段、策略或日常操作。
FREE

This indicator finds Double Top and Double bottom Example : What is Double Top When price establishes a new high and then falls, then reverse to the same candle area of High then its considered a valid double top and vice versa for double bottom. 1. It plots and high and low on visible chart if ChartChange is set to true else it searches on new bar opening
2. If there is double top and double bottom found in visible chart window then it plots a line 3. It has options to customize text color, tex
FREE

The Mirror Chart MT5 is a overlay indicator specifically designed to project a second financial instrument directly onto the main chart window. This tool is invaluable for traders who rely on correlation analysis, as it visualizes the price movements of two different instruments in real time. Unlike traditional overlays, this indicator utilizes intelligent, dynamic centering and scaling logic. It continuously analyzes the visible price range in the current window for both symbols and calculates
FREE

Williams %R Trend Exhaustion Scanner & Signal Generator
The Ultimate Multi-Confirmation Trading System for Serious Traders
---
Introduction: A New Era of Precision Trading
In the fast-paced world of forex and CFD trading, success hinges on one critical factor: the ability to identify high-probability reversal opportunities before they unfold. The Williams %R Trend Exhaustion Scanner represents a quantum leap forward in technical analysis, combining the timeless power of Williams %R with sop
FREE
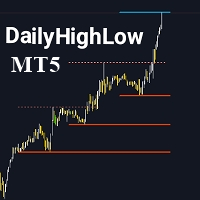
请不要忘记给指标评分,以帮助我提高其可见性。 DailyHighLow 指标是专为 MetaTrader 5 (MT5) 平台设计的强大工具,旨在帮助交易者跟踪每日的价格波动。该指标可以自动绘制趋势线,基于自定义时间段内的最高价和最低价,为需要准确市场信息的交易者提供清晰的视觉辅助。 主要特点: 趋势线个性化设置: 根据您的交易偏好,调整趋势线的颜色、样式和宽度,包括破位线和未破位线。 动态更新: 自动根据最新的市场数据调整趋势线,并使用明显的视觉标记来显示破位情况。 灵活参数设置: 选择显示趋势线的天数,设置破位后趋势线的结束时间,并为最高价和最低价自定义趋势线的外观。 清晰的视觉效果: 通过不同的颜色和线条样式轻松区分破位和未破位的趋势线,使您可以一目了然地识别市场的关键水平。 此指标非常适合希望通过清晰且可自定义的趋势线来增强技术分析的交易者,无论是分析短期趋势还是长期市场动向,DailyHighLow 指标都能为您的交易策略提供宝贵的信息支持。
FREE

This indicator can be considered as a trading system. It offers a different view to see the currency pair: full timeless indicator, can be used for manual trading or for automatized trading with some expert advisor. When the price reaches a threshold a new block is created according to the set mode. The indicator beside the Renko bars, shows also 3 moving averages.
Features renko mode median renko custom median renko 3 moving averages wicks datetime indicator for each block custom notification
FREE

SY Edge MT5 is a clean signal indicator designed to highlight structured buy and sell opportunities directly on the chart.
It displays clear entry-based trade ideas with mapped Take Profit and Stop Loss levels, while keeping the chart layout simple and readable. The indicator is designed for traders who want a clean visual tool without unnecessary clutter.
SY Edge works across multiple symbols and timeframes and is built to give a straightforward chart view with: buy and sell signal markers TP
FREE
在真的发生什么之前,它一直闭着嘴。Volatility Explosion MTF度量动量在K线之间的变化,只有当它同时越过两个阈值时才报告:一条布林带的宽度,以及由一百根K线的真实波幅搭起的死区。同时越过两者的那根K线,是一次带方向的真实波动率扩张,而在它们之下的一切,什么都不是。它是免费的:没有试用期,没有锁定功能,没有升级页面。 喷发是这根K线的MACD与上一根K线的MACD之差,再乘以一个把它放到价格尺度上的灵敏度。爆发阈值是收盘价上一条布林带的宽度,也就是乘数的两倍乘以标准差。死区取自该方法的第二版:在一百根K线上按Wilder方式平滑的真实波幅,乘以它自己的乘数。 当喷发的幅度同时高于阈值和死区时,这根K线被算作爆发性的,而喷发的符号说明是哪个方向。信号是一次爆发的开始,也就是它第一次同时越过两者的那根K线。强度倍数只是把它评为2而不是1;真正起过滤作用的只有爆发阈值本身,与原作完全一致。 图表上显示的内容 在独立窗口里:爆发阈值和死区画成两条线,喷发画成柱状图,它的方向就是它的符号,浓淡则说明它在扩大还是在消退。背离在喷发序列上寻找,而不是在阈值上,因为阈值没有方向,在它
FREE

Aurex Resistance & Support Dynamic PRO An adaptive support/resistance zone indicator built on swing-pivot detection, ATR-scaled zone sizing, volume validation, and an automated mitigation protocol that removes zones once they've been invalidated. Zone detection Zones are anchored to confirmed swing highs and swing lows (symmetric pivot window, default length 10). Each zone's thickness is derived from a 50-period ATR rather than a fixed pip/point value, so zone width automatically adapts to the c
FREE

BBMA by RWBTradeLab
BBMA read as one running sequence, not as a pile of separate signals. This indicator plots the three line families the system is built on — Bollinger Bands, Linear Weighted Moving Averages on the High and on the Low, and an EMA on the Close — and then labels the sequence those lines produce, candle by candle, on any symbol and any timeframe.
The Lines
- Bollinger Bands: Upper, Basis and Lower, from SMA 20 with deviation 2 - LW MA Low (5 to 10): the lower band, drawn in gr
FREE

The Anchored VWAP Indicator for MetaTrader 5 gives you full control over where your VWAP starts. Instead of being locked to session opens or fixed times,
you simply drag the anchor point on the chart , and the VWAP instantly recalculates from that exact bar. Indicator Based : WH KillZone VWAP MT5 This makes it perfect for analyzing:
• Institutional entry zones
• Breakout origins
• Swing highs/lows
• News reaction points
• Trend continuations Key Features Drag & Drop Anchor Point : Move the s
FREE
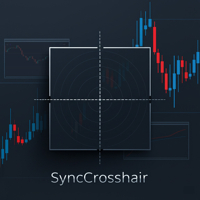
SyncCrosshair - 同步和抢拍十字准线指示器
概述: SyncCrosshair 是一款轻量级 MQL5 指标,可在多个 MT5 图表中复制 TradingView 的十字准线体验。在任何同步图表上移动鼠标或点击,即可看到垂直线和水平线在图表的时间框架(5 分钟、15 分钟、H1、H4 等)内精确捕捉到每根蜡烛的开盘时间。
主要功能 - 多图表同步: 在所有连接了 SyncCrosshair 的图表上自动镜像十字准线位置。 - 时间框架捕捉: 线条可精确锁定到当前时间框架的条形图(例如,在 M5 上每 5 分钟锁定一次,在 M15 上每 15 分钟锁定一次,在 H1 上每小时锁定一次)。 - 本地和全局切换: 按 S 仅在活动图表上启用/禁用同步。 按 H 在所有图表上同时启用/禁用同步。 - 自定义外观: 选择自己喜欢的线条颜色、样式(点/实线/虚线等)和宽度。 - 快速流畅: 基于毫秒的定时器可确保近乎实时的更新,并将 CPU 占用率降至最低。
如何使用: 1 附加: 添加到任意图表。 2 同步: 移动鼠标或单击在一个图表上设置十字线,其他图表自动跟随。 3
FREE

Buy Sell Signal Low TF gives buy/sell signals and alerts with up and down arrow at potential reversal of a pullback or a trend continuation pattern in low timeframe. This is an indicator which gives signals based on trend => It works best in trend market with the principle is to ride on the trend not trade against the trend.
The components of Buy Sell Signal Low TF: - The trend is determined by SMMA 13 , SMMA 21 and SMMA 35 ( can be changed manually to suit your preference). - The signal is b
FREE
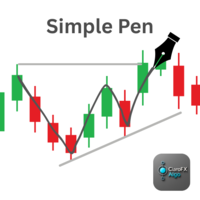
ClaroFxAlgo - Simple Pen v1.00 Free-Hand Drawing Tool for MetaTrader 5 Overview:
ClaroFxAlgo - Simple Pen is a lightweight and intuitive tool that allows traders to draw directly on the MT5 chart using just mouse movements. Designed to enhance visual analysis, this tool makes it easy to sketch trends, highlight zones, or mark chart behavior on-the-fly. Key Features: Draw on chart by simply holding Ctrl and moving the mouse — no clicks required Customizable drawing settings:
• Drawing col
FREE

The Pivot Point Supertrend indicator is a technical analysis tool designed for the MetaTrader 5 (MT5) platform. It combines two popular analytical methods: Pivot Points: Uses significant historical price highs and lows to identify potential support and resistance zones. These points are objective and stable. Supertrend: A well-known trend-following indicator that helps identify the current market trend and provides dynamic stop-loss levels. Indicator's Goal: By using the stability of Pivot Point
FREE

SWEEP PROTOCOL Essentials — 在市场触及流动性之前先看到它
在寻找信号之前,你需要知道该往哪里看。
SWEEP PROTOCOL Essentials 持续为您绘制机构瞄准的流动性水平,并在价格触及它们的那一刻向您发出警报。
前一日高点/低点、区间 50 %、午夜开盘、亚洲 / 伦敦 / 纽约完整时段区间:这些是市场不断重访的区域。Essentials 自动在您的图表上显示它们,并在正确的时间通知您,无需您持续盯着屏幕。
核心功能
- 自动流动性水平:前一日、周、月高点/低点,区间 50 %,午夜开盘,自动绘制和更新。
- 时段区间:亚洲、伦敦、纽约持续显示,每个时段按颜色编码。
- 触及警报:一旦触及关键水平立即通知(弹出和/或推送),无需守在屏幕前。
- 迷你仪表板:市场背景一目了然(活跃时段、当日水平)直接显示在图表上。
- 轻量且无干扰:对平台流畅性零影响,不向外部发送任何数据。
- 通用性:所有商品、所有时间框架,指数、外汇、金属、加密 CFD。
工作原理
市场在结构上会返回到有限数量的水平:那些集中最多待处理订单的水平。SWEEP P
FREE

Anchored VWAP + EMA(9) Bias Engine with Clean Entry & Exit Signals Elohim FX – VWAP EMA Crossover is a precision trend-and-bias tool that combines the institutional strength of an Anchored VWAP with a fast EMA(9) to define market direction, then delivers clean, bias-gated entry and exit signals — all on closed-bar confirmation so you never chase a repainting signal. No clutter. No bands. No noise. Just two lines, one bias, and clearly defined arrows. How It Works The indicator is built around a
FREE
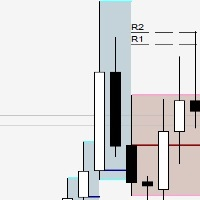
The outside bar indicator shows a range of inside bars and the breakout up and down from the range. The breakout is always displayed at the start of a new range and is extended until another breakout. The calculation always takes place at the start of a new candle. So it is displayed accordingly in all time frames. In inside bar ( insidebar ) trading you can see the top and bottom of a range.
In outside bar ( outsidebar ) trading, the breakout from a range and thus the trend following.
The col
FREE

VSA CVD Histogram (Cumulative Volume Delta) Price Doesn't Move Because of Candle Patterns. It Moves Because of Order Imbalance. Have you ever entered a trade based on a Pin Bar, Marubozu, Engulfing , or another price action pattern... only to be stopped out a few candles later? The candle looked bullish.
The setup looked perfect.
Yet the market moved in the opposite direction. The reason is simple. Price does not move because of the shape of a candle. It moves because buying pressure and sellin
FREE
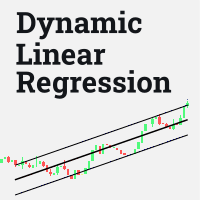
Este indicador traça uma reta baseada em regressão linear, esta reta é dinâmica e é atualizada a cada tick. O cálculo de regressão linear é feito considerando o número de candles definido pelo tamanho da janela fornecida pelo usuário. São traçadas duas linhas, uma superior e uma inferior, para guiar a estratégia do usuário, a distância dessas linhas para a linha central deve ser configurada. É possível definir os estilos, cores e espessuras de cada uma das linhas.
Esse indicador foi inicialmen
FREE

ICT Turtle Soup Complete System - MT5 Indicator Overview The ICT Turtle Soup Complete System is an advanced MT5 indicator that combines Inner Circle Trader (ICT) concepts with the classic Turtle Soup trading pattern. This sophisticated tool identifies liquidity sweep reversals at key levels, providing high-probability trade setups with complete risk management calculations. Key Features 1. Multi-Timeframe Liquidity Detection Tracks Daily, 4H, 1H, and Yesterday's High/Low levels Identifies
FREE

SMT DIVERGENCE - GOLD vs SILVER (XAUUSD / XAGUSD) All Timeframe MQL5 Market Product Description ====================================================================
PRODUCT NAME: SMT Divergence Gold vs Silver | Smart Money Scalping Tool
SHORT DESCRIPTION (max 63 chars): Catch Gold reversals before they happen using SMT Divergence
---------------------------------------------------------------------- FULL DESCRIPTION ----------------------------------------------------------------------
W
FREE

Overview The SMC indicator is a versatile tool that helps traders automate chart analysis using price action. Its main goal is to identify where large institutions place orders (liquidity) to find optimal entry/exit points.
Core Features Market Structure: Automatically labels BOS (Breakout Structure) and CHoCH (Change of Character) in real time for both internal and main swing waves.
Supply & Demand Zones: Identifies bullish and bearish Order Blocks.
Liquidity & Price Gaps: Identifies equal
FREE

BlueDigitsFx 官方生态系统入口 此免费工具是 BlueDigitsFx 交易基础设施生态系统的一部分。 通过 BlueDigitsFx 官方机器人获取更新、工作流程资源、产品发布信息以及官方生态系统访问权限。 Telegram 生态系统
官方网站
MT4 版本
BlueDigitsFx Open Trades MT5 —— 用于主动交易管理的实时点数监控工具 BlueDigitsFx Open Trades 是一款免费的 MT5 工具,可直接在图表上实时显示所有未平仓交易的总点数结果。 该工具采用清晰的颜色编码显示方式,帮助交易者快速识别盈利和亏损仓位,并监控多个活跃交易及货币对的整体表现。 它专为希望获得更清晰交易视图、更快速仓位监控以及无需频繁切换多个窗口即可管理交易会话的交易者而设计。 通过在图表上持续显示未平仓交易的整体表现,交易者无需频繁打开 MetaTrader 终端窗口即可更快做出反应。
主要功能 实时点数显示 —— 直接在图表上监控所有未平仓交易的总点数结果。 颜色编码交易概览 —— 快速识别正收益和负收益交易表现。 多交易监控 —— 适用于同时管
FREE

ALYAS Classic MACD
ALYAS Classic MACD is a MetaTrader 5 indicator based on the classic MACD calculation, presented with a color-coded histogram, MACD and Signal lines, a zero line, and an integrated information dashboard.
The indicator calculates MACD using configurable Fast EMA, Slow EMA, and Signal periods. The histogram uses four visual states based on its position relative to zero and its movement compared with the previous histogram value.
The optional dashboard provides a compact view
FREE

Persistence Trend Line 是一款适用于 MetaTrader 5 的自适应趋势线指标。它在价格图表上绘制一条平滑线,其速度会随市场自适应调整:当价格持续收在该线同一侧时,线会加速;当价格不断穿越该线时,线会减速。这条线在上升时为蓝色,在下降时为橙色。每根K线的颜色在该K线收盘时确定,已收盘的K线永不重绘。 它只使用所在图表自身的价格K线。它有五项设置和两个警报开关,所有交易品种和时间周期都使用同一套默认设置。 工作原理 该线是收盘价的双重平滑指数移动平均线:第一级平滑跟随收盘价,该线再跟随第一级平滑,两者速度相同。 计数器统计收盘价已连续多少根K线停留在该线的同一侧。当价格不断穿越该线时,计数器不断重新开始,该线以 Slow length 设定的慢速移动。当收盘价持续落在同一侧时,计数器不断增大,速度向 Fast length 设定的较快速度靠拢,因此该线能更紧密地跟随单边行情。 速度是逐步变化的:在每根K线上,速度向目标速度移动一部分距离,这一比例由 Glide rate 设定。 如何解读 蓝色表示这条线在该K线期间上升,橙色表示它下降。当这条线的变动不超过 Fl
FREE

> LUMENAXIS(TULIP 品牌)单文件 MT5 指标:六因子熵平衡评分引擎,主图绘制动态 > 平衡脊线、ATR 自适应包络与经确认的多空/离场箭头,画布逐像素渲染赛博霓虹仪表盘。 > 支持双币种界面、两级缩放、多品种扫描与 iCustom 读取。
## 标语
**六因子 · 一条平衡轴 · 零黑箱。**
## 产品概述
LUMENAXIS 是 **TULIP 品牌**系列的原创**熵平衡多因子评分引擎** 它同时做两件事:
- **主图层**:动态平衡脊线、ATR 自适应包络、经确认的多空 / 离场箭头, 可选的价格–分数背离标记,以及 N 根极值顶 / 底标记。 - **画布层**:整块仪表盘作为一张位图标签渲染,**所有像素由代码绘制** (渐变、辉光、仪表、网格、扫描线)——不用网页面板、不需要 DLL、 不在图表上堆对象。
图表、缓冲区、告警、面板共用同一套引擎,四者永不矛盾。
## 评分引擎
每根 K 线上,六个独立因子先归一化到可比较区间,再按自适应熵权加权:
| # | 因子 | 含义
FREE

Amiguinho's Bar Counter is a price action indicator to display the bar count (candles) with some interesting options.
About the "Period of analysis" parameter: if the current timeframe is in minutes, then the analysis period will be considered in days; if the current timeframe is in days, then the analysis period will be considered in months; or if the period of analysis will be considered in years.
FREE

Celeng Trend Signal Pro
Our advanced analytical tool is designed to elevate your market analysis, combining multi-layered trend tracking, precision volatility indicators, and dynamic channel mapping into a single, cohesive interface. Built for performance and clarity, it helps market participants identify shifts in momentum, gauge underlying market strength, and visualize structural boundaries effortlessly. Key Features & Advantages Precision Trend Detection: Utilizes sophisticated core algorit
FREE

用户指南:Custom Regression Signals MT5 Custom Regression Signals 是一款专为 MetaTrader 5 设计的专业技术分析工具。它利用线性回归(Linear Regression)数学方法构建动态价格通道。与标准的静态通道不同,该指标能主动分析价格动态,帮助交易者识别市场是处于活跃趋势还是侧向(横盘)震荡阶段。 1. 指标工作原理 指标根据设定的回顾周期构建通道,并根据当前市场阶段自动更改颜色: 绿色通道(牛市趋势): 价格稳步上涨。在此阶段,指标会过滤信号,仅在通道下边界产生**买入(BUY)**信号。 红色通道(熊市趋势): 价格稳步下跌。在此阶段,指标仅在通道上边界产生**卖出(SELL)**信号。 灰色通道(横盘/震荡): 市场处于侧向移动。在此阶段,允许在通道上下边界进行双向交易(均值回归)。 2. 交易信号 当价格超出计算出的回归通道边界时,指标会在图表上显示箭头: 向上箭头(绿色/灰色): 买入信号。相对于回归线,价格被视为超卖。 向下箭头(红色/灰色): 卖出信号。相对于回归线,价格被视为超买。 重要提示: 该指标
FREE

This comprehensive technical indicator calculates and plots up to 3 moving averages with 3 different periods. By employing three moving averages of distinct lookback periods, the trader can confirm whether the market has indeed experienced a change in trend or whether it is merely pausing momentarily before resuming its prior state. SX Golden MA Pack for MT4 is available here . The shorter the moving average period, the more closely it tracks the price curve. When a security initiates an upt
FREE

Trading Performance Monitor 适用于 MetaTrader 5 的多 EA 绩效面板,可自动检测在您已打开的图表上运行的 EA(智能交易系统),并实时跟踪它们各自的表现。 Trading Performance Monitor 是一款适用于 MetaTrader 5 的信息型指标。它读取账户历史记录和当前持仓,按 EA 对数据进行分组,并通过七个页面呈现:表现、交易、风险指标、回撤、月度历史以及按品种划分的结果。该指标不下达任何订单,也不修改任何持仓。 Overview 同时运行多个 EA 的交易者通常没有简单的方法查看哪个 EA 在盈利、哪个在亏损。账户历史记录将所有策略混合在一起,终端显示的是整个账户的结果,而不是每个 EA 单独的结果。 该指标会扫描每一个已打开的图表,识别每个图表上附加的是哪个 EA,并通过魔术数字(magic number)将这些图表与属于它们的持仓和已平仓交易进行匹配。没有魔术数字的持仓会被单独归类为手动交易,因此自主交易不会与自动化结果混淆。由于该指标只读取数据,因此可以附加到任何图表上,包括已经运行着 EA 的图表,而不会干
FREE

Force Scanner MT5 is a real-time market strength indicator that analyzes 10 technical indicators and summarizes them in an intuitive panel with clear BUY or SELL signals.
Works on any asset: Forex, Synthetic Indices (Crash, Boom, Volatility), Commodities, Cryptocurrencies and more.
WHAT IT DOES: - Calculates Buying and Selling Force as a percentage - Shows BUY or SELL signal with confidence level - Analyzes: RSI, ADX, EMA, Bollinger Bands, Stochastic, MFI, CCI, Williams %R, Current Candl
FREE

Vector Candles Indicator Vector Candles Indicator is a powerful MT5 tool designed for traders seeking advanced volume analysis and trend insights. It colors candles based on tick or real volume to highlight climax (exhaustion) and super climax (extreme spike) patterns, signaling potential reversals or continuations. Integrated features include 9 customizable EMAs (5-800 periods), Point of Control (POC) from volume profiles, daily pivot levels with midpoints, current day open/high/low lines, arro
FREE

TrendPulse Sniper — EURUSD M5 精准信号箭头指标 TrendPulse Sniper 是一款专业的箭头信号交易指标,专为 EURUSD 5分钟周期(M5) 设计。它通过结合趋势方向、动量确认、波动率过滤以及更高周期趋势确认,帮助交易者识别潜在的买入和卖出机会。 该指标适合希望保持图表简洁、信号清晰,并且不想面对过多复杂参数的交易者使用。 主要功能 在图表上直接显示买入和卖出箭头 专为 EURUSD M5 设计 3种信号模式: Balanced — 信号更多,适合积极的日内交易 Conservative — 信号更少,确认条件更强 Very Conservative — 狙击模式,专注于更高质量的交易机会 更高时间周期趋势确认 动量和趋势强度过滤 波动率与K线质量过滤 可自定义买入和卖出箭头颜色 新信号出现时支持手机推送通知 简洁清晰的参数设置界面 工作原理 TrendPulse Sniper 使用多种内部过滤条件来分析市场,包括趋势方向、市场动量、ADX趋势强度、RSI变化、MACD确认、ATR波动率、K线结构以及更高时间周期的趋势方向。 当条件一致时,指标
FREE

The fact that round number levels have a significant influence on the market cannot be denied and should not be overlooked. These psychological levels are used by both retail Forex traders and major banks that deal in Forex. Very simple and effective indicator and most importantly free. ////////////////////////////////////////////////////////////////////////////////////////////////////////////////////////////////////////////////////////////// The program does not work in the strategy tester.
FREE

EASY SUPPORT AND RESISTANCE Visualize support and resistance levels across multiple timeframes with dynamic color-coded lines
Overview This powerful MT5 indicator automatically identifies and highlights key price levels by drawing rectangles on the last closed candle and its first opposite-colored candle across six different timeframes (M15, M30, H1, H2, H4, D1). The lines dynamically change color based on price action confirmation, transforming into support or resistance levels when validated
FREE
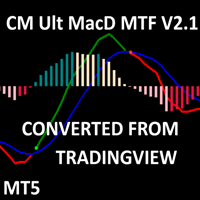
CM MACD Custom Indicator - Multiple Time Frame (V2.1) This advanced MT5 indicator, adapted from ChrisMoody’s TradingView script, delivers a powerful Multi-Timeframe MACD with customizable visuals and alerts. Plotting MACD lines, signal line, and a color-coded histogram, it highlights trend direction and momentum with distinct colors for growing/falling histograms above/below zero. Cross signals are marked with arrows, and users can enable alerts, email, or mobile notifications for buy/sell oppo
FREE

Boom Crash Zones + Spike Mitigation Lines PRO is a professional trading indicator designed for Deriv Synthetic Indices (Boom & Crash) and can also be used on Forex and other markets. It combines dynamic weekly Supply/Demand zone mapping with an advanced spike pattern mitigation line system , helping traders identify high-probability reversal areas and entry levels. This indicator is built for traders who use price reaction zones , market structure , and liquidity-based trading . Key Features W
FREE

This is the famous Sunflower indicator for Metatrader5. This indicator marks possible tops and bottoms on price charts. The indicator identifies tops and bottoms in the asset's price history, keep in mind that the current sunflower of the last candle repaints, as it is not possible to identify a top until the market reverses and it is also not possible to identify a bottom without the market stop falling and start rising. If you are looking for a professional programmer for Metatrader5, please
FREE

ATS Daily Volume Profile 显示市场今天和昨天真正成交的位置:每天一个水平成交量直方图、POC(成交最多的价格)和价值区。 显示内容 - 今天和昨天的每日成交量分布,绘制在K线后方 - 热力颜色:成交少的地方为冷蓝色,成交量最集中的地方为金色和红色 - 每一行带 3D 深度阴影(可关闭) - POC 为粗金线,价值区高点和低点为虚线,价值区之外的行变暗 - 小面板:今日 POC、价值区、价格在价值区之上 / 之内 / 之下、成交量来源 成交量来源 当经纪商提供真实交易所成交量(期货、股票)时自动使用。现货黄金、外汇和大多数 CFD 没有中央交易所,因此改用跳动成交量(价格变动次数)。这是 MetaTrader 中成交量分布的标准做法,面板始终告诉您正在使用哪一种。 设置 成交量来源(auto / real / tick)、每个分布的行数、价值区 %、直方图宽度、3D 阴影开/关、热力颜色开/关、颜色、面板开/关、主题和位置。 适用于任何品种,在 M5 到 H1 周期上效果最佳。本指标只负责绘图:从不开仓、修改或平仓。 如果这个工具对您有帮助,欢迎留下简短评价。有问
FREE

Chronovex Galacticus Gold M05 Chronovex Galacticus Gold M05 是一款专为 MetaTrader 5 开发的技术分析指标,主要用于辅助交易者分析 XAUUSD(黄金) ,并重点针对 M5(5分钟)时间周期 进行了优化。 该系统旨在让市场分析更加直观、清晰,通过综合分析趋势、动能强度、潜在反转、波动性以及关键价格区域,为交易者提供辅助参考。 主要功能 市场条件确认后显示 BUY(买入)信号 市场条件确认后显示 SELL(卖出)信号 当市场没有明确交易机会时进入 NEUTRAL(中性)模式 识别当前 市场趋势及趋势强度 显示策略计算的 ENTRY(入场价格) ️ 根据当前信号动态计算 STOP(止损) 提供 TP1、TP2、TP3 和 TP4 四个目标位 根据系统的价格扩展逻辑提供更远目标区域 新的确认信号出现时提供 声音提醒 动态K线颜色,帮助快速判断当前市场状态 ️ 在图表上直接显示买入和卖出确认箭头 ️ 信息面板显示趋势、信号、入场、止损以及目标价格 指标如何工作?
FREE

CV ZigZag Pro – Professional ZigZag Indicator for MetaTrader 5 CV ZigZag Pro is a professional ZigZag indicator for MetaTrader 5, designed for accurate market structure analysis, swing detection, and trend identification. Using adaptive filters and intelligent market logic, the indicator highlights significant highs and lows while providing a clean and professional market structure visualization. It is an ideal tool for traders who focus on trend analysis, market structure, and liquidity-based t
FREE

HalfTrend Signal Indicator
HalfTrend Signal is a trend-following indicator that identifies the market direction in real time and marks the exact moment of trend reversal with clear buy and sell arrows.
How it works
The indicator draws a dotted line directly on the price chart: - Blue line — uptrend in progress - Red line — downtrend in progress
When the line changes color, an arrow is plotted at the reversal bar: - Green arrow — trend switched to bullish - Red arrow — trend switched to
FREE
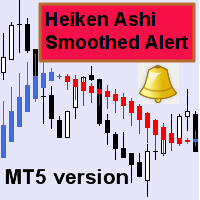
This indicator can send alerts when a Heiken Ashi Smoothed color change occurs. Combined with your own rules and techniques, this indicator will allow you to create (or enhance) your own powerful system. Features Can send all types of alerts. Option to delay the alert one or more bars in order to confirm the color (trend) change. Input parameters Candle shift for alert: Default is 1. Setting it to 0 will alert you on color change on the current candle. This should be regarded as a pending (uncon
FREE

Advanced Volume Profile Liquidity Analysis via Custom Area Selection The Advanced Manual Volume Profile is a precision tool for MetaTrader 5 designed to deconstruct market structure through price-level volume analysis. Unlike static profiles, this indicator exclusively processes the price and time range defined by the user via a rectangle object, offering a surgical view of the market auction. Elite Technical Specifications Dynamic Algorithm: Real-time calculation (400ms refresh rate) based on t
FREE

Investment Castle 趋势线 — 价格行为,自动为您绘制
出色的交易始于读懂趋势——供需、上升与下降通道、趋势线和吞没K线。Investment Castle 趋势线会在您的图表上自动整合这幅价格行为图景,让您以更少的猜测和更小的压力抓住趋势。
它能为您做什么 自动趋势线: 主导的趋势线为您绘制——无需手动作图。 价格行为背景: 结构、方向和关键转折点一目了然。 更少压力、更快判断: 把时间用在决策上,而非画线。 基于经过验证的价格行为: 专业交易者抓趋势所用的同一方法。 处处适用: 任何品种、任何周期。
适合人群: 希望入场前就看到趋势的价格行为交易者。
风险提示: 交易存在重大亏损风险。请务必先在模拟账户上测试,并使用您能接受的风险设置。过往表现不代表未来结果。
FREE

MT5 Chart Object Sync is a powerful utility indicator for MetaTrader 5 that automatically synchronizes drawing objects between multiple charts of the same trading symbol. Create or modify a drawing object on one MT5 chart and the changes can be synchronized automatically to other charts using the same symbol, including different timeframes. No master chart or slave chart is required. Install the indicator on the charts you want to synchronize, and the charts communicate automatically. KEY FEATUR
FREE

Converted an existing TradingView Pine Script VWAP indicator into a fully native MQL5 version for MetaTrader 5, maintaining 1:1 calculation accuracy, visual formatting, and functional parity. Technical Implementation: Line-by-Line Logic Translation: Successfully translated Pine Script's ta.vwap() vector calculations and session anchoring into MQL5 dynamic price/volume arrays ( CopyBuffer , CopyTicks ). Multi-Session Anchoring: Retained all customizable session boundaries (Daily, Weekly, Monthly,
FREE
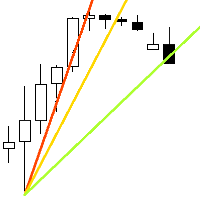
速度阻力线是确定趋势和阻力线的有力工具。 该指标使用图表极值和特殊的数学公式构建线条。 该指标可用于确定趋势方向和枢轴点。
<---------------------------->
指标参数:
"Depth of search" -搜索图表极值的深度(以条形为单位) "Back step of search" -极值之间的最小距离(以条为单位) "Deviation of price" -同一类型极端之间的允许价格差异 "Line color" -带有相应索引的线条颜色 "Line style" -带有相应索引的线条样式 "Line width" -具有相应索引的线宽 <---------------------------->
你可以在"艾德森*古尔德的稀有作品集"一书中找到更多信息,也可以在私人信息中与我联系。
<---------------------------->
提前感谢所有有兴趣的人,祝你好运征服市场!
FREE

No Wick Candles is a powerful price action indicator that identifies candles with no upper or lower wick (also known as Marubozu candles ) and automatically draws horizontal compensation lines from their open price with a "Compensation" label . These wickless candles represent strong momentum and are often used by professional traders as key support/resistance zones . The indicator helps you visualize potential reversal or continuation zones instantly. Key Features Detects Bullish (no lower wick
FREE

TransitX1 indicator is very useful, with unlimited signals and works on all the timeframes and all the piers. TransitX1 draws two trend lines very short trendlines (+/-20 bars) which can be considered as support and resistance. The support is in red trendline and the resistance is in green trendline. TransitX1 gives buying and selling signals, with only 3 being previous signals and the 4th one being the current signal. Buying signals are in green arrows and are always on the support trendline an
FREE

SnR CC Level by RWBTradeLab
A clean, non-repainting Confirmation Candle (CC) level detector for MetaTrader 5, built for price action traders who don't just want Support/Resistance levels — they want levels the market has already CONFIRMED with a proper reaction candle. Every level on the chart comes with its own confirmation, all from CLOSED candles only.
What This Indicator Does
The indicator detects 6 types of SnR CC levels. A CC (Confirmation Candle) is a candle that touches a key level w
FREE

ICT - Market Structure (MSS • BOS • IDM) - Tjmas is a 100% FREE institutional market structure mapping indicator for MetaTrader 5. It automatically identifies real-time Swing Points, Internal Inducement (IDM), Market Structure Shifts (MSS), Multi-Timeframe M5/M15 MSS, and Break of Structure (BOS) with zero repaint and zero lag. Key Features: Primary Swing Structure: Automatically labels Higher Highs (HH), Lower Lows (LL), Lower Highs (LH), and Higher Lows (HL). Internal Inducement (IDM): Maps in
FREE
MetaTrader市场是一个简单方便的网站,在这里开发者可以出售自己的交易应用程序。
我们将帮助您发布您的产品,并向您解释如何为市场准备您的产品描述。市场上所有的应用程序都是加密保护并且只能在买家的电脑上运行。非法拷贝是不可能的。
