 MetaTrader 5
 专家
专家
 指标
指标
 程序库
程序库
 实用工具
实用工具
 窗口小部件
窗口小部件
 规则
规则
适用于MetaTrader 5的免费技术指标 - 23
 技术指标的信号外汇和股票市场的开仓交易和平仓交易起着至关重要的作用。指标的本质就是一种交易品种的数学转换,旨在预测未来的价格变化。
测试技术指标可以更有利于预测市场行为并从中获利。
技术指标的信号外汇和股票市场的开仓交易和平仓交易起着至关重要的作用。指标的本质就是一种交易品种的数学转换,旨在预测未来的价格变化。
测试技术指标可以更有利于预测市场行为并从中获利。 
Apex Pulse – Professional Market State Dashboard by KuntahFx Transform raw market noise into crystal-clear trading decisions. Apex Pulse is a premium MT5 dashboard indicator that condenses complex market analysis into one elegant, real-time HUD. No more juggling multiple indicators — get instant insight into trend strength, momentum, volatility, liquidity positioning, and reversal danger, all in a sleek, professional dark-themed panel. Why Traders Love Apex Pulse Instantly see the true market re
FREE

Markov Prime 是一款新一代专业分析指标,它将经典技术分析与概率论(马尔可夫链)和分形几何(时间指数)相结合。 与大多数具有“记忆”且严重滞后的标准指标不同,Markov Prime 以不同的方式分析市场:它实时计算当前市场状态(趋势或盘整)持续的概率。该指标旨在过滤市场噪音期间的虚假入场信号,并寻找最有可能的建仓点。 该指标不重绘(Non-Repainting),在已收盘的 K 线上不滞后,并在图表上配有便捷的信息面板。 核心技术: 马尔可夫链过滤器 (Markov Chain Filter):分析过去 100 根 K 线并构建状态转移矩阵。如果出现信号,但马尔可夫模型显示趋势延续的概率很低,则该信号将被阻止。 时间指数 (Time Exponent, TE):评估价格运动的“质量”。它过滤掉混乱(噪音)的运动,防止在震荡市中入场。 混合信号核心:您可以通过方便的下拉菜单直接在图表上选择三种内置策略之一。 三种内置策略: RSI + EMA Trend:顺着全局趋势的方向进行回调交易(使用 RSI 超买/超卖区和 EMA 21/50 过滤器)。 EMA 21/50 Cros
FREE

Smart Money Structure XAUUSD H1 Smart Money Structure XAUUSD H1 is a technical indicator designed to help traders analyze market structure on XAUUSD (Gold) , with a primary focus on the H1 timeframe . The indicator automatically analyzes closed candles and displays various market structure elements directly on the chart. Main Features The indicator can identify and display: HH — Higher High : a higher swing high. BH : a structural level supporting bullish continuation. HB : a structural level as
FREE

更多工具
我的全部指标、EA 和工具都在这里: https://www.mql5.com/en/users/amrosama77/seller
Market Regime Detector - 知道自己身处哪一种市场
突破方法在区间中亏钱。均值回归方法在趋势中亏钱。两种方法本身都没有问题,只是被用在了错误的条件下。Market Regime Detector 说明当前的市场条件,让你判断自己的方法是否与之匹配。
三项独立测量被合并为一个标签,而且只有当新的状态维持足够长的时间、值得相信时,标签才会改变。
三项测量
方向。用 ADX 衡量趋势强度,加上快慢移动平均线的关系以及两者之间以 ATR 表示的间距,这样同一个阈值在平静的货币对和波动剧烈的指数上都能合理运作。
效率。在回溯区间内,净移动距离与价格实际走过的总路程之比。接近一表示走势笔直而有目的;接近零表示市场走了很多路却哪里也没到。
波动率。当前 ATR 与其自身长期平均值的比值。这是比值而非绝对数值,正因如此才能在不同品种之间比较。
七种状态
STRONG TREND UP 和 STRONG TREND D
FREE

1. 产品名称:智能多时间框架移动平均线 (MTF MA)
产品简介:一款一体化交易解决方案,可让您在单个图表上实时查看 7 个主要时间框架的移动平均线。
2. 产品描述
交易者必须同时分析多个时间框架才能把握整体趋势。智能 MTF MA 可将 M1 至 D1 的移动平均线直观地投射到当前图表上,无需切换图表,让您一目了然地掌握多个时间框架的市场趋势。
主要功能:
完美同步:自动计算并显示 7 个时间框架(M1-D1)的移动平均线,与当前图表的走势同步。
自定义:您可以为每个时间框架单独设置周期、颜色和线条粗细,打造个性化的图表环境。
灵活设置:使用“关闭”功能可以轻松隐藏不需要的时间框架。
性能优化:针对 MQL5 环境进行了优化,即使在移动图表时也能提供流畅无缝的性能。3. 使用方法(用户手册)
安装:将下载的 .ex5 文件放入 MetaTrader 5 的 Indicators 文件夹,然后将其拖放到图表上。
配置:
全局设置:选择计算方法(SMA、EMA 等)和适用价格(收盘价、开盘价等)。
时间周期设置:设置是否使用 T1 (M1) 到 T7 (D
FREE
具有多时间框架支持、可自定义视觉信号和可配置警报系统的OsMA(MACD柱状图)指标。
自由职业编程服务、更新和其他TrueTL产品可在我的 MQL5主页 获取。
非常欢迎您的反馈和评价!
什么是OsMA? OsMA(移动平均振荡器)是MACD与其信号线之间的差值,也称为MACD柱状图。正值表示MACD位于信号线上方(看涨动量),负值表示MACD位于信号线下方(看跌动量)。零线穿越对应MACD/信号穿越,标志着潜在的趋势转变。增长的柱体显示动量增强,缩小的柱体显示动量减弱。 OsMA信号在零线穿越(趋势转变)、OsMA与价格之间出现背离以及检测到柱状图峰谷时生成。该指标帮助交易者高精度地测量动量运动的强度和方向。 功能特点: 带箭头和垂直线的视觉信号标记 三个独立信号缓冲区,具有可配置触发器 信号检测选项:方向变化、级别穿越、峰/谷 每个信号可配置警报(电子邮件、推送、声音、弹出窗口) 具有插值方法的多时间框架(MTF) 柱状图或折线图显示模式 多种颜色模式(单色、基于方向、基于级别) 通过iCustom访问缓冲区,可与专家顾问(EA)集成 输入参数: 基本设置: 快速EMA周期
FREE

该指标会实时扫描您的交易账户,分析已持仓单,并可选择是否计算挂单,然后通过数学方式计算出两个关键价格。 保本线(BE)
在该价格平仓后,您的总利润将正好为零。指标会计入手续费和库存费,避免您因为忽略交易成本而意外亏损平仓。 目标线(Target/TP)
价格需要达到该水平后,您才能获得指定金额的利润,例如正好 100 美元,或者获得账户余额的指定百分比,例如余额增长 2%。 两种计算模式,适合不同策略 您可以在设置中选择指标如何处理您的交易。 独立模式
非常适合对冲账户。指标会分别计算多单和空单。图表上会分别显示多单的保本线和目标线,以及空单的保本线和目标线。如果您双向交易或使用锁仓,非常适合该模式。 合并模式
非常适合净额结算账户以及锁仓交易。指标会将所有多单和空单合并计算,得出整体净头寸,并为该交易品种上的所有持仓显示一条统一的保本线和一条统一的目标线。 主要优势与功能 灵活的目标设置
您可以将目标利润设置为账户货币金额,例如 50 美元,也可以设置为当前余额的百分比,例如 1.5%。当余额变化时,指标会自动重新计算目标线。 精确计算
可选择是否计入库存费和手续费,使
FREE
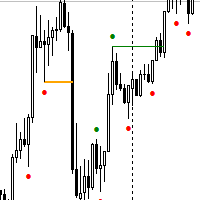
Next Arrival : Flip or Die Trading Arena. Flip a trading account: https://flipordie.com/chapter-1-thirteen-doublings-double-a-trading-account/ NOTE: Turn Pattern Scan ON
This indicator identifies Swing Points, Break of Structure (BoS), Change of Character (CHoCH), Contraction and Expansion patterns which are plotted on the charts It also comes with Alerts & Mobile notifications so that you do not miss any trades. It can be used on all trading instruments and on all timeframes. The non-repaint
FREE

FTU Moving Average Alert mt5
Alert for price touch and close of moving average Any moving average type Alert sound file option Alert on touch or close over
Usage : Attach indicator from market folder, change type of moving average, style etc
Set alert type
Note: sound folder location is within appdata folder see image, copy wav file into this folder, then change file name within input eg: news.wav / chime.wav / 'anysound'.wav
FREE

這是最終的RVI指標。 添加警報箭頭 他可以確定潛在的阻力水平 額外的2個過濾器,以提高讀數 另外平滑以顯示良好的效果 它被配置為從m1到m30的短時間範圍 也不會很糟糕 我建議使用此指示器和屏幕截圖macd中的其他過濾器 這是最終的RVI指標。 添加警報箭頭 他可以確定潛在的阻力水平 額外的2個過濾器,以提高讀數 另外平滑以顯示良好的效果 它被配置為從m1到m30的短時間範圍 也不會很糟糕 我建議使用此指示器和屏幕截圖macd中的其他過濾器 這是最終的RVI指標。 添加警報箭頭 他可以確定潛在的阻力水平 額外的2個過濾器,以提高讀數 另外平滑以顯示良好的效果 它被配置為從m1到m30的短時間範圍 也不會很糟糕 我建議使用此指示器和屏幕截圖macd中的其他過濾器
FREE

Trend-Filtered Breakout Signals This is a clean, signal-only indicator that marks potential entries directly on your chart with simple buy and sell arrows. It's built for traders who want clarity instead of clutter: no tangle of lines or oscillators to interpret — just a clear arrow when the conditions it's looking for line up. The indicator reads the market's underlying price structure, waits for that structure to be broken with conviction, and then confirms the move against the prevailing tren
FREE

SMC LIQUIDITY Advanced Institutional-Grade Smart Money and Liquidity Analysis Suite for MT5 SMC LIQUIDITY is a comprehensive institutional toolkit engineered for traders who require precise liquidity mapping, market structure intelligence, smart money concepts, and order flow awareness in a single integrated interface. It is designed for professional workflow, multi-timeframe clarity, and seamless execution in fast-moving conditions. This indicator combines several institutional methodologies in
FREE
This is one of the most popular and highly rated volatility index (VIX) indicators on the market. It provides the same readings as the VIX does for stock indexes. However, this indicator works across all asset classes. VIX Fix Finds Market Bottoms. This indicator is not for inexperienced traders. Use it for day and swing trading. MT4 Version - https://www.mql5.com/en/market/product/112238 Join To Learn Market Depth - https://www.mql5.com/en/channels/suvashishfx
Bernard Baruch summe
FREE

IMR is a multi-layered quantitative reversal finder designed for discretionary price-action traders who refuse to trade blind. It does not generate entry signals, nor does it draw buy/sell arrows. Instead, it answers the three questions that matter most before you ever place a limit order: What is the market's statistical DNA right now? (Hurst Exponent) Is the current move backed by genuine strength, or is it exhausted? (ADX) Has price moved too far, too fast, with too much conviction — suggest
FREE

轻松在图表上绘制进场价、止盈和止损水平,用于分析和跟踪交易信号。 兼容 MetaTrader 4 和 MetaTrader 5,在 Market 上作为独立产品出售。 主要功能 轻松输入进场价、TP1、TP2、TP3 和 SL 值 可选的垂直线用于标记信号时间 每条线支持自定义标签和颜色 直观评估信号的准确性与风险回报比 适用于所有品种和所有时间周期 无重绘、无延迟,线条清晰稳定 应用场景 可视化来自 Telegram、WhatsApp 或其他渠道的交易信号 分析历史信号并学习市场反应 向社群或客户展示清晰的信号布局 搭配手动或自动策略使用 关键词 signal , draw lines , entry , take profit , stop loss , forex , visual signals , manual trading , signal analysis , TP , SL , chart , levels , evaluation , education , indicator , tool
FREE

MovingAverage Cloud
Imagine this, you want to know when all moving averages between 20 to 100 are all moving in one direction. This indicator does that. You enter in the first period of the smallest moving average, and the last period of the highest moving average. If all the moving averages are moving in the same direction, the indicator will plot the colour for that direction, e.g blue, more than half of the moving averages in that range change colour to the opposite direction, a yellow/oran
FREE

Market Structure Scanner is a professional Smart Money Concepts (SMC) indicator designed to help traders identify high-probability market opportunities through advanced price action analysis. The indicator automatically detects and displays: Market Structure (BOS & CHoCH) Higher Highs (HH), Higher Lows (HL), Lower Highs (LH), and Lower Lows (LL) Order Blocks (Bullish & Bearish) Fair Value Gaps (FVG) Equal Highs (EQH) and Equal Lows (EQL) Buy and Sell Signals based on institutional price behavior
FREE

Deviation Trend Profile(偏离趋势分布) 概述 Deviation Trend Profile 是一款 MetaTrader 5 图表指标,在同一个主图窗口中提供三层可视化信息:带动量渐变的移动平均线、基于波动率计算的偏离带,以及绘制在当前价格右侧的横向分布剖面。 本指标是分析工具。它不执行开仓、平仓或仓位管理操作,也不是完整的交易系统。它的作用是帮助用户观察趋势方向、动量强弱以及价格在波动区间内的分布情况。 指标显示的内容 1. 渐变色移动平均线 主图中绘制一条简单移动平均线。线条颜色会根据该均线的归一化动量,在用户设定的两种颜色之间连续变化。均线向上加速时,颜色向正向色过渡;向下加速时,向负向色过渡。过渡是平滑的,因此无需读取数值即可判断当前走势的强弱。 2. 偏离带 在最后一根 K 线右侧,以移动平均线加减一、二、三倍波动率为单位,绘制六条短线。第七条线标出移动平均线本身,并使用当前的动量颜色。每条线都带有标签,因此可以直接以波动率为单位读出价格与均线之间的距离。线条向右延伸数根 K 线,便于查看。 3. 方向变化标记 当归一化动量由下向上穿越内部正向阈值时
FREE

The Penta-O is a 6-point retracement harmonacci pattern which usually precedes big market movements. Penta-O patterns can expand and repaint quite a bit. To make things easier this indicator implements a twist: it waits for a donchian breakout in the right direction before signaling the trade. The end result is an otherwise repainting indicator with a very reliable trading signal. The donchian breakout period is entered as an input. [ Installation Guide | Update Guide | Troubleshooting | FAQ | A
FREE

Deriv Synthetic Indices Symbol Changer Developed by Tshepo David The Symbol Changer for Deriv Synthetic Indices is a professional utility designed for MetaTrader 5 (MT5) to streamline your market analysis. Instead of manually dragging symbols from the Market Watch or right-clicking to change timeframes, this tool places a sleek, interactive dashboard directly on your chart. It is specifically pre-configured for synthetic indices (Step Index, Jump Index, and Volatility Index), but it is fully c
FREE

Presentation
Another indicator that makes scalping on tick charts easier, it displays an Heiken Ashi graph in Ticks.
It allows to detect entry points and trend reversals. Recommended number of ticks in a candle : 5, 13 or 21.
Parameters Ticks in candle: Number of ticks in a candle (default 5), Displays Trend arrows : displays a trend arrow based on EMA8 and EMA20 crossing, Displays MM50, Displays MM100, Max Candle (CPU): number of candles max to manage, low value will save ressources of your
FREE

MT5 锤子与启明星形态指标 这个强大的 MT5 指标可以帮助交易者快速识别图表中的关键反转形态,包括 锤子(Hammer) 和 启明星(Star Bar) 。无论市场趋势如何,这个工具都能帮助你抓住潜在的反转机会。 主要功能与优势: 高/低点检测 :自动比较当前K线与前 X 根K线的高低点,确保信号准确可靠。 影线与实体比例 :顶部或底部影线必须大于实体 X 倍,过滤掉无效信号。 反向影线确认 :确保反向影线大于信号影线 X 倍,提高交易信心。 多种提醒方式 :推送通知到手机,或在图表上显示提示信息,不错过任何机会。 高时间框架推荐 :H4 或以上,让信号更加稳定可靠。 适合所有交易者 :新手可以快速上手,资深交易者可结合自己的策略优化交易。 不重绘 :信号一旦出现就固定,避免误导。 使用这个指标,你可以在市场出现潜在趋势反转时提前布局,优化入场和出场点位。无论是日内交易还是波段操作,这个工具都能显著提高你的决策效率和盈利机会。 立即获取 MT5 锤子与启明星指标,让你的交易更专业、更高效、更稳健!
FREE

M5 Scalp Wick Entry Arrows This indicator displays two independent types of arrows directly on the chart. Both arrow types are calculated strictly from M5 data, while the indicator can be attached to any timeframe for convenient viewing and analysis. Arrows help visually mark potential moments of interest without overloading the chart. You can adjust arrow size and colors in the settings to match your template. Tested on XAUUSD (Gold) and EURUSD.
FREE

Smart Finder Order Block The Ritz Smart Finder Order Block is a next-generation market structure recognition tool, designed to intelligently detect and highlight institutional footprints within price action. Built on a dynamic blend of order block theory, consolidation tracking, and adaptive volatility modeling, it provides traders with a sophisticated lens to anticipate high-probability market reactions. Core Capabilities Smart Order Block Detection Identifies both Bullish and Bearish Order Blo
FREE

Chandelier Exit PRO A precise and reliable trend-following indicator for MetaTrader 5 Chandelier Exit PRO is a professionally engineered implementation of the Chandelier Exit indicator, designed to closely match the original version in both logic and signal behavior. It provides clear trend direction, dynamic stop levels, and well-timed reversal signals, making it suitable for traders who require consistency and accuracy in their decision-making. Core Features Accurate Logic This indicator repli
FREE
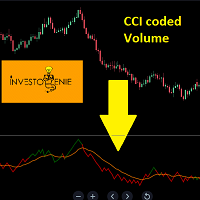
The Indicator is based on Commodity Channel Index (CCI) coded on Volume. The concept is to try and analyze the movement of Volume and Price in a certain direction
Concept:
If the Price of the indicator moves below the threshold price, it turns RED indicating the direction downwards is getting strong.
If the Price of the indicator moves above the threshold price, it turns GREEN indicating the direction upwards is getting strong.
The moving average acts as a great filter to decide entry/exit poi
FREE

Price Action 6 Pattern Pro 是一款适用于 MetaTrader 5 的技术分析指标,可在图表上自动识别并显示六种经典 Price Action 价格行为形态。 该指标用于市场分析。它不会自动开仓、修改订单或平仓。信号基于已确认的价格结构生成,并可通过箭头、文字标签以及可选的形态结构图形直接显示在图表上。 指标支持以下六种形态: Inside Bar Breakout Outside Bar Pivot Point Reversal(PPR) Move-Congestion-Move(MCM) 1-2-3 Reversal 2B Reversal 所有信号均基于 已收盘 K 线 进行判断。 主要功能 一个指标内集成 6 种 Price Action 模型 分别识别多头和空头信号 基于已收盘 K 线确认信号 图表内交互式控制面板 每种形态可独立开启或关闭 全局 BULL / BEAR 方向过滤 Confluence 共振模式 每种形态的信号计数 显示最近一次检测到的信号 可选的形态结构可视化 三种标签显示模式:OFF、RECENT、ALL 弹窗、Push 和 Em
FREE

Velora Equity Monitor Free — No strings attached. Except one. I built this for myself. After running multiple EAs simultaneously on the same terminal, I kept asking the same question: which one is actually making money? The default MT5 account history mixes everything together. You get a number. You don't get clarity. So I built Velora Equity Monitor. Attached it. Left it running. Forgot it was there — until I needed it. That's the best compliment I can give my own tool. What it does Velora Equi
FREE

Ritz Volume Statistic – Color Volume Histogram & Market Flow Insight Ritz Volume Statistic is a clean and powerful volume analysis indicator designed to visualize bullish and bearish market pressure through a dynamic color-graded volume histogram . The indicator transforms raw tick volume into an intuitive color spectrum , allowing traders to instantly identify volume expansion, exhaustion, and dominance shifts between buyers and sellers. A built-in statistical panel summarizes total volume, bul
FREE

Squeezer — Sniper Entries on Pullbacks
Squeezer is built to time pullback entries with precision. It draws ascending lines with a Sell signal in downtrends and descending lines with a Buy signal in uptrends — a simple, proven way to catch sniper entries in the direction of the trend.
What it does for you Pullback timing: Buy signals in uptrends, Sell signals in downtrends — trade with the trend, not against it. Clear visual guides: ascending/descending lines show where the pullback may turn. S
FREE

Multi Currency Strength Dashboard Mini (FREE) – Currency Strength Meter for MetaTrader 5 Multi Currency Strength Dashboard Mini 是一款适用于 MetaTrader 5 的免费指标,以清晰快读的仪表板形式实时显示 8 大主要货币 (USD、EUR、GBP、JPY、CHF、CAD、AUD、NZD)的相对强弱。 目标:在几秒内识别强势和弱势货币,帮助您构建有针对性的关注列表(例如,选择强势货币对弱势货币的交易对)。 2.00 版本新功能 全新视觉刷新 – TradingTips UI(深蓝面板、霓虹边框、蓝色标题栏)。 分区方框内的彩色强度条(绿 / 金 / 红)。 8 个货币每行显示趋势箭头(上 / 下 / 中性)。 面板拖放 – 抓取标题栏即可在图表上移动。 最小化按钮 – 紧凑模式不占用图表空间。 面板位置在 MT5 重启后自动保存。 主要功能 在单个面板中分析 8 大主要货币。 自动实时更新。 适用于所有时间周期(在所选时间周期上计算)。 兼容大多数经纪商(
FREE

MTF Currency Strength Panel for MetaTrader 5 多时间框架货币强度指标:全部 28 个主要货币对集中显示在一张图表上。 这款货币强度面板显示八大货币当前的相对位置,以及 28 个主要货币对在九个时间框架(M1 至 MN1)上的走势。两组读数同处一张图表,并按计时器刷新。 单纯对货币对进行排名容易产生误导。当某一种货币出现波动时,所有包含它的货币对都会随之波动,因此排名的顶端往往是同一种货币重复出现七次。本面板将整个矩阵分解为各货币自身的强弱,从而把真正的驱动因素与重复项区分开来。 分解的原理 八种货币中的每一种都出现在 28 个货币对中的 7 个之中。它的强弱是这 7 个读数的平均值,并在该货币作为报价货币时反转符号——AUDJPY 下跌意味着日元走强,而不是走弱。 每个货币对恰好影响两种货币:对基础货币为正、对报价货币为负。因此在完整的 28 个货币对中,这些贡献相互抵消,八个强弱值之和为零。面板将此作为内部校验:如果这些数值无法相互平衡,说明分解出了问题。这同时意味着,读数是彼此相对的,而非绝对的。一种货币本身并不"强",它只是相对于这一组
FREE
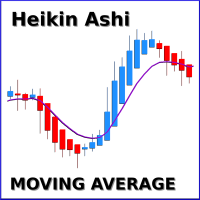
This is a moving average indicator with multiple calculation methods available, including exponential, linear, smoothed and linear weighted approaches. The indicator is designed to work on smoothed Heikin Ashi candles, which are included in the 'Examples' folder of Meta Trader 5. By applying this tool, traders can significantly reduce unwanted market noise.
FREE

Kito Order Block & FVG Detector Clean market structure. Relevant zones. Less chart noise. Kito Order Block & FVG Detector is a standalone MT5 indicator designed to identify important Order Blocks and optional Fair Value Gaps directly on your chart. Instead of filling the screen with every possible imbalance, the indicator is configured to start with Order Block detection enabled and Fair Value Gap detection disabled by default . This gives traders a cleaner first view of the market while keeping
FREE

Volume Profile FAN 成交量分布指标
一句话介绍: 在图表右侧/左侧显示成交量分布柱状图,直观展示每个价格区间的成交量大小,帮助识别关键支撑阻力位。
核心功能: - 成交量分布柱状图:将价格范围分成N个格子,统计每个格子的成交量 - POC(控制点):成交量最大的价格水平,橙色加粗线 - 价值区域(VAH/VAL):占70%成交量的价格区间,红/绿色线 - 高量柱标记:成交量超过阈值80%的柱子自动高亮 - 价格突破警报:价格突破POC/VAH/VAL时可弹窗/声音提醒 - 可拖拽范围:绿色垂直线可拖动,调整计算范围 - 左右切换:柱状图可显示在图表左侧或右侧
可调节参数: 计算设置: - 回测K线数量:计算多少根K线(默认100) - VP柱数量:价格分成多少个格子(默认100) - 价值区域百分比:价值区域占比(默认70%)
颜色设置: - 普通柱/POC/VAH/VAL/高量柱颜色全可自定义
显示设置: - 柱状图位置:左侧/右侧 - POC/VAH/VAL延伸线开关
警报设置: - POC/VAH/VAL突破警报独立开关
适用场景: - 支撑阻力
FREE

KDJ Indicator for MT5 The KDJ Indicator for MT5 is a professional-grade momentum and trend analysis tool designed to help traders identify trend reversals , overbought/oversold conditions , and entry or exit opportunities with high accuracy. Originally developed as an enhancement of the Stochastic Oscillator , the KDJ adds a powerful J-line that reacts faster to price movement, giving traders earlier warnings of potential reversals. Key Features Three-Line System (K, D, J):
The K and D lines r
FREE

This indicator is a simple tool to spot a possible trend.
When the ribbon below the price bars, It will turn to Green color and the trend is seen to be bullish When the ribbon above the price bars, it will turn to Red color and the trend is seen to be bearish. It can be used a either Entry Signal Exit Signal or trailing stop, so it is very versatile. By default color : Green is UP trend and Red is Down trend and this work perfect with Bar4Colors.ex5
FREE

TM QuantShift Regime Matrix 是一款适用于 MetaTrader 5 的自适应市场状态分析指标。它旨在从日常价格噪音中识别并清晰展示重要的市场行为变化。
该指标结合了三个量化分析模块:
1. 变化点检测 CUSUM 模块分析标准化价格收益率和累积方向压力,用于识别具有意义的市场结构变化。
2. 概率市场状态 状态模型通过评估价格方向、走势效率和波动特征,估算市场当前处于看涨、看跌、震荡或高波动状态的可能性。
3. ATR 波动持续性 波动模块用于判断异常幅度的价格运动是一次性事件,还是持续波动扩张的一部分。
如何解读指标
绿色线段表示看涨结构压力,红色线段表示看跌结构压力,中性线段表示市场尚未形成清晰方向。中央阶梯线标记最近一次检测到结构变化时对应的价格水平。周围的压力线展示正向和负向统计压力的累积过程。
这些线不是支撑位、阻力位、止损位或止盈位。它们用于提供市场分析背景,应与交易者自己的交易策略结合使用。
主要功能
- 自适应 CUSUM 变化点检测 - 看涨、看跌、震荡和高波动状态分析 - 正向与负向压力可视化 - 基于 ATR 的波动
FREE

Daily Support and Resistance Levels 是一款专业指标,基于经典枢轴点方法自动计算并显示日内交易关键价格水平。 主要功能: 自动计算枢轴点(PP) 三个阻力位(R1, R2, R3) 三个支撑位(S1, S2, S3) 显示前一天高点/低点 实时信息面板 市场趋势方向(多头/空头)提示 显示与最近价格水平的距离 完全自定义颜色与样式 每日自动更新 支持所有周期 计算方法:基于昨日最高价、最低价、收盘价的经典枢轴点算法。 交易用途: 支撑/阻力反弹交易 突破策略 区间震荡交易 市场方向判断 盈利目标设置 使用方法: 将指标加载到图表 自动生成水平线 价格 > PP = 多头倾向 价格 < PP = 空头倾向 S1-S3 = 支撑区域 R1-R3 = 阻力区域 自定义设置: 枢轴点/支撑/阻力颜色 线条宽度与样式 显示/隐藏价格标签 显示/隐藏信息面板 面板位置与字体大小 显示/隐藏前日高低点 优点: 专业界面 无重绘 资源占用低 支持所有经纪商 适合剥头皮与日内交易 免费用于展示我的MQL5能力 如果喜欢,请留下评价。
FREE

Wave Breath Indicator 是一款适用于 MetaTrader 5 的 不重绘 自适应趋势流动工具。它基于典型价格 (HLC/3) 应用一快一慢两条指数移动平均线跟踪市场方向,在得到的基准线外侧包裹按波动率缩放的灵敏度通道,并锁定一个只有在收盘价穿越反向通道时才翻转的“状态型”趋势。输出是一幅干净、按颜色编码的主导趋势图:双色基准线、紧贴当前通道的水平线、填充在二者之间的半透明云层、按趋势上色的 K 线、随同向趋势连续延伸而逐步加深的背景渐变,以及标记每次确认反转的 ASCII L(多头)和 S(空头)标签。 查看 MT4 版本: Wave Breath MT4 更多产品请访问: 全部产品 想查看实盘示例和最新工具,请访问我的个人主页并添加好友,这样就不会错过任何更新! 工作原理 自适应趋势流动引擎 指标通过五个步骤构建核心视图。第一步,对每根 K 线计算典型价格(最高价 + 最低价 + 收盘价,再除以 3)。第二步,在这条序列上运行两条指数移动平均线,一条使用设定周期,另一条使用其两倍周期,然后将两条均线再平均成一条平滑的基准线。第三步,在同一长度区间上计算典型
FREE
用於Boom 和Crash 合成的MFI 和RSI 狙擊進場訊號配備了強大的進場警報系統,對於更高級的過濾訊號,請考慮Harmonic Hybrid Pilot Pro。當交易尖峰時,您有三個訂單邏輯地放置來分配風險,第三個訂單最後是接近峰值的最高機率。 訊號在最終訂單下達十五分鐘後失效,且必須立即平倉。 對於 Tp,我建議您在對您有利的峰值出現後立即退出。 透過私人訊息部分向我發送訊息,以獲得全面的使用者指南。 用於Boom 和Crash 合成的MFI 和RSI 狙擊進場訊號配備了強大的進場警報系統,對於更高級的過濾訊號,請考慮Harmonic Hybrid Pilot Pro。當交易尖峰時,您有三個訂單邏輯地放置來分配風險,第三個訂單最後是接近峰值的最高機率。 訊號在最終訂單下達十五分鐘後失效,且必須立即平倉。 對於 Tp,我建議您在對您有利的峰值出現後立即退出。 透過私人訊息部分向我發送訊息,以獲得全面的使用者指南。
FREE

Fibonacci Pro Fibonacci Pro is an automatic Fibonacci indicator for MetaTrader 5 designed to identify the current market movement and draw clean retracement and extension levels directly on the chart. It detects the relevant swing high and swing low of the active move, then plots key Fibonacci levels with clear labels, making it easier to analyze pullbacks, continuation zones, and potential reaction areas. Main Features Automatic Fibonacci drawing based on the current market movement Detects swi
FREE

INTRODUCTION : The breakout strength meter is a trading tool that is used to identify which currencies are the strongest to breakout, and which currencies are the weakest to breakout. The settings for the indicator are easy, and if you cannot find the settings, please leave a comment The tools are completely free to use Please, if you like the indicator, please leave a comment and rate the indicator in order to develop it
FREE

Supertrend 趨勢指標 Supertrend 是一款用於判斷市場趨勢方向與趨勢轉換的技術指標,透過市場價格與波動幅度的變化,自動繪製趨勢線,協助交易者快速辨識目前市場偏多或偏空。 當市場趨勢發生改變時,指標會在圖表上顯示對應的 Buy / Sell 訊號 ,讓使用者更直觀地掌握可能的趨勢轉折位置。 此指標適合用於外匯、黃金、指數、加密貨幣等不同市場,也可搭配其他技術分析工具作為交易方向過濾、進場確認或趨勢追蹤使用。 主要功能包含: 自動判斷目前市場趨勢方向 顯示多頭與空頭 Supertrend 趨勢線 趨勢轉換時顯示 Buy / Sell 訊號 ATR 週期可自由調整 ATR 倍數可自由設定 支援不同價格計算來源 可自由開啟或關閉交易訊號 支援趨勢切換提醒 可自訂線條顏色與顯示方式 適用於不同商品與時間週期 Supertrend 可以單獨作為趨勢判斷工具,也可以搭配均線、支撐壓力、價格型態或其他交易策略使用,協助交易者更快速地辨識市場方向與趨勢變化。 注意:本指標僅提供市場分析與交易訊號參考,不代表任何獲利保證。實際交易前建議先進行充分測試,並搭配適當的資金與風險管理。
FREE

TrendSync Heikin Ashi — Trend, Structure & Confluence in One Indicator A color change is not a signal. Most Heikin Ashi tools flip color and call it a trade. TrendSync Heikin Ashi is built on a different idea: a signal only appears when short-term context, long-term structure and a genuine point of interest all line up. The result is a clean, low-noise chart that shows you where a setup forms, where your stop belongs, and when momentum is fading — without the clutter of generic arrows. TrendSync
FREE
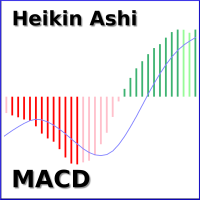
This is the moving average convergence divergence (MACD) indicator based on Heikin Ashi calculations. Here you find multi-colored histogram which corresponds to bull (green) / bear(red) trend. Dark and light colors describes weakness/strenght of price trend in time. Also you can switch calculations between normal and Heikin Ashi price type.
Note: Buffers numbers for iCustom: 0-MACD, 2-Signal line
FREE

Automatic supply and demand zones built from real base-and-departure price action. How it works The indicator looks for a base of one to three small candles (body below a set share of ATR) followed by a strong departure candle (body above a larger ATR multiple) that closes beyond the base. A bullish departure creates a demand zone around the base, and a bearish departure creates a supply zone. Each zone is then tracked candle by candle. A fresh zone has not been revisited. When price comes back
FREE

Fast EMA cross signals for scalping, filtered by trend, momentum and candle strength. How it works A buy signal appears when EMA 8 crosses above EMA 21 and the candle closes above EMA 100, so you only trade with the larger trend. RSI 7 must not be overbought, so buys are skipped when momentum is already stretched. The candle body must be at least a set multiple of ATR 14, which filters out weak crosses. Sell signals use the mirror conditions. Each signal shows a small red dot at a Stop Loss and
FREE

Clear BUY and SELL arrows that come with a ready-made Stop Loss, three Take Profit levels and a suggested lot size. How it works A signal needs four conditions on the same closed candle. Price must be on the trend side of the EMA 50 and the EMA must slope in that direction. RSI 14 must have crossed the 50 line within the last few bars. The candle must close beyond the high (for buys) or the low (for sells) of the previous candle. ATR 14 must be above a set share of its own average, so quiet and
FREE
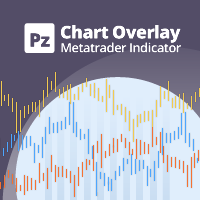
图表覆盖 指标在同一张图表上显示几种工具的价格走势,使您能够评估货币对相对彼此波动的差异。 [ 安装指南 | 更新指南 | 故障排除 | 常见问题 | 所有产品 ]
轻松找到超买或超卖的货币对 在同一图表上绘制最多六个货币对 必要时显示倒置符号 适应图表大小,缩放和时间表 自动价格水平计算 可定制的价格水平密度 可自定义的颜色和尺寸
什么是反向货币对? 反转货币对意味着显示两种货币之间的汇率,从而反转交易的主要货币。例如,如果要将EURUSD,GBPUSD和USDJPY绘制到同一覆盖图中,则有必要反转USDJPY以使价格反映反向汇率:JPYUSD。这样,日元/美元价格将与覆盖图的其他两个符号呈正相关关系移动,从而使图表更易于研究。
测试指标 该指标使用来自多个交易品种的价格数据绘制单个图表。由于MetaTrader 4测试仪(在撰写本文时)不支持多货币回溯测试,因此该指标无法回溯测试,因为它将不会收到来自其他本应覆盖的交易品种的报价。要测试它,请租用一个月。
输入 符号设置-键入要在覆盖图上显示的货币对或符号的名称。您需要至少输入其中之一,以便覆盖图具有两个货币对(本机和外
FREE

Know exactly when the market is active. Session Map displays the major Forex trading sessions directly on your chart and in a live panel.
WHAT IT SHOWS ON THE CHART: - Colored background boxes for each session: Tokyo (blue), London (green), New York (orange) - London and New York overlap highlighted in yellow — the most volatile period of the day - Draws the last 3 days automatically so you can compare session behavior
WHAT THE PANEL SHOWS: - Live server time clock updated every second - Stat
FREE
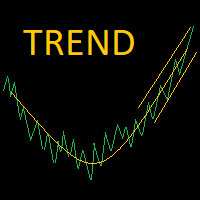
Automatic Trend Line Fit. This indicator automatically plots the straight line and parabolic (curved) trend to any symbol at any timeframe. The plotted straight line is a good indication of the current trend and the curved line is an indication of a change momentum or change in the current trend. Plotting the straight line over about 2/3 the number of candles as the curved line is usually a good way to determine entry and exit points as it shows the current trend and momentum of the market. This
FREE

======================================================== GANN CLUSTERS - INSTITUTIONAL SIGNAL PANEL - MQL5/MT4 MARKET DESCRIPTION (formatting: **bold** = Bold button; lines with • = bullet list; UPPERCASE = heading) ========================================================
OVERVIEW ------------------------------------------------------- **Gann Clusters** finds where three independent Gann systems agree and draws those **confluence clusters** across multiple timeframes, with a signal panel that
FREE

CCI with Dynamic OSB Zones The CCI indicator you have been using is broken. Not because of the formula — because of the fixed levels. Every market condition is different. A reading of +150 in a low-volatility pair is extreme. The same reading in a trending, high-volatility session is completely normal. Yet every standard CCI indicator treats both situations identically. Crystal AI Systems built this indicator to fix that problem permanently. Two Modes. One Indicator. Full Market Coverage. This i
FREE
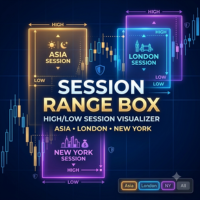
Session Range Box — Session High/Low Visualizer Overview Session Range Box draws live, color-coded rectangles on your chart marking the high and low reached during the Asia, London, and New York trading sessions. As each session unfolds, its box grows in real time to reflect the range built so far, then locks in place once the session closes. A simple on-chart control panel lets you show or hide any session instantly, so you can study one session's range in isolation or view all three overlaid a
FREE

DiNapoli Stochastic Predictor V2.02 DiNapoli Stochastic Predictor 是一款基于传奇交易员乔·迪纳波利(Joe DiNapoli)提出的特定平滑方法的经典随机振荡器(Stochastic)进阶优化版。与通常过于“敏感”且包含大量噪音的标准随机指标不同,迪纳波利版本应用了双重平滑处理,能够有效过滤市场噪音,提供更可靠的超买和超卖信号。 该工具的最大亮点在于其 实时预测面板 。它直接在图表上投影出资产需要达到的精确价格水平,以便指标触及 25(底部)、75(顶部)水平或实现指标线交叉(反转)。这使您能够在行情发生之前就预见到市场的潜在波动。 核心优势 迪纳波利平滑算法: 卓越的计算算法,显著减少横盘震荡市场中的错误信号。 动态目标面板: 直观显示趋势改变或入场信号所需的精确价格。 实时 Tick 计算: 面板显示当前价格与指标目标之间的距离(以点/Ticks为单位)。 视觉警报: 当价格接近关键水平时,面板会自动变色(黄色),提示即将到来的执行机会。 简洁界面: 预设 25 和 75 水平,严格遵循乔·迪纳波利的原版方法论。
FREE

Magnet Wall 指标是适用于 MetaTrader 5 的、基于 ATR 的 无重绘 趋势通道系统。它在价格上方和下方绘制两条自适应通道,像“磁性墙”一样:在趋势完好时把价格包裹在内部,一旦价格有效突破墙体,趋势即发生翻转。K 线和通道会根据当前有效趋势自动变色,买入或卖出信号在趋势反转的那一刻被确认。该指标基于 Wilder ATR(倍数可配置)构建,采用非对称突破‑锚定算法(不是标准 Supertrend),并内置完整的提醒系统,支持弹窗、推送通知、邮件和声音提醒。 MT4 版本地址: Magnet Wall MT4 更多产品请见: 所有产 品 如需查看真实账户示例和最新工具,请访问我的个人主页并发送好友请求,以免错过更新! 工作原理 非对称 ATR 趋势通道 在每一根收盘 K 线上,指标会按照可配置的回溯长度(默认:5 根 K 线)计算 Wilder ATR,并乘以通道宽度倍数(默认:7.6),得到一个 Δ 值,用来确定上下通道相对于源价格的距离。当源价格收盘于某一侧通道之外时,对应的“墙”会贴合到新的极值位置;当价格保持在通道内部时,两侧墙体保持不动。上下通道之间
FREE

欢迎使用 HiperCube Renko Candles Darwinex Zero 25% 折扣码:DWZ2328770MGM 此指标为您提供真实的市场信息,将其转换为 Renko Candle Style。
定义 Renko 图表是一种金融图表,用于测量和绘制价格变化,使用砖块(或条形)表示价格变动。与传统烛台图不同,Renko 图表不显示基于时间的信息,仅关注价格波动。 特点: 单独窗口中的指标 自定义蜡烛颜色 自定义蜡烛/砖块大小(以点为单位) Chatgpt 和 AI 被用于开发它 Renko 策略示例: 识别趋势 等待回调和使用 Renko 蜡烛吞没 输入您的入场点 SL 吞没的较低点 TP 风险回报 1:2、1:3... 请注意,这是一个示例,可以作为基础或新策略,无论如何在真实账户中尝试和测试它,这些信息仅供您了解如何使用 Renko Candles Hipercube 指标
FREE

Force Candle Pro is an advanced indicator designed to identify strong momentum candles in the market, helping traders detect high-probability movements and institutional activity.
This tool analyzes candle strength based on body size, volatility, and directional consistency, filtering out weak and indecisive movements.
Unlike common indicators, Force Candle Pro focuses on market impulse, allowing traders to identify when the market is truly moving with strength.
MAIN FEATURES:
- Detection o
FREE
DS Candle Countdown Timer V2.0 Multi-Timeframe Candle Timing Indicator for MetaTrader 5 Overview DS Candle Countdown Timer V2.0 is a MetaTrader 5 indicator that displays real-time candle countdown information directly on the trading chart. The indicator helps traders monitor remaining candle time, candle progress, and important timing events across multiple timeframes. It is designed for traders who use structured chart analysis and require a clear visual reference for candle opens and closes. V
FREE
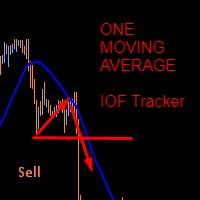
This indicator was created based on posts from forex factory thread titled There is no Magic Moving Average - You need only one - by @andose2 a.k.a Andrei Florin. If you want to know about how to use this trading strategy please go and read https://www.forexfactory.com/thread/691864-there-is-no-magic-moving-average-you.
Note: Below are extracts some of the posts .
Estabilish a trend, based on Market Cycles, then go only long in the Markup Phase and only short in the Decline phase , st
FREE

Meridian Flow — MT5 Smart Money Structure 指标 Meridian Flow 是一款专为使用 Smart Money Concepts (SMC) 和 ICT Price Action 方法论的交易者打造的 MetaTrader 5 指标。它可以在任意品种和时间周期上自动识别 BOS(Break of Structure)和 CHoCH(Change of Character),并为每个信号绘制完整的风险地图——Entry、Stop Loss、TP1、TP2 和 TP3,包括历史信号。 信号只会在确认后的已收盘 K 线上触发。 不重绘,不猜测。 Meridian Flow 的独特之处 大多数结构指标只显示当前活跃交易。Meridian Flow 会为图表上的每一个历史信号绘制 SL 和 TP 水平,并让每个信号拥有独立的未来 K 线显示范围。这样,你可以在投入真实资金之前,直观地检查指标在不同市场环境下的表现。 Stop Loss 根据 ATR(Average True Range)计算,因此会自动适应当前品种的波动率。当 TP1 被触发后,S
FREE
能量潮(OBV)指标,支持多时间框架,可自定义视觉信号及可配置警报系统。
自由职业编程服务、更新和其他TrueTL产品可在我的 MQL5主页 获取。
非常欢迎您的反馈和评价!
什么是OBV? 能量潮(On Balance Volume)指标由乔·葛兰碧(Joe Granville)开发,基于成交量先于价格的理论。在上涨日加入成交量,在下跌日减去成交量,创建累积成交量指标。价格横盘或下跌时OBV上升表明看涨积累。价格稳定或上涨时OBV下降则预示看跌分发。OBV与价格的背离可能是即将发生趋势变化的强烈领先指标。 OBV信号通过OBV指标的趋势线突破、OBV与价格之间的背离以及OBV平均水平穿越来生成。该指标对于确认趋势强度和检测价格走势的早期信号特别有用。 功能特点: 带箭头和垂直线的视觉信号标记 三个具有可配置触发器的独立信号缓冲区 信号检测选项:方向变化、穿越水平线、峰值/谷值 每个信号的可配置警报功能(邮件、推送、声音、弹窗) 支持插值方法的多时间框架(MTF)功能 柱状图或折线图绘制模式 多种颜色模式(简单、基于方向、基于水平) 通过自定义指标调用(iCustom)访问缓冲区
FREE

Price Volume Trend (PVT) Oscillator Description: The PVT Oscillator is a volume indicator that serves as an alternative to the standard On-Balance Volume (OBV). While ordinary volume indicators can be noisy and hard to read, this tool converts volume flow into a clear Histogram Oscillator, similar to a MACD, but for Volume. It is designed to detect first Trend Reversals and Divergences by analyzing the difference between a Fast and Slow PVT moving average. Why is this better than standard OBV?
FREE

Investment Castle Supply & Demand — Zones That Don't Repaint
Price flows between supply and demand. This non-repainting indicator maps those zones for you by counting how many times each level has been tested and retested in the past, so you trade from the areas the market actually respects.
What it does for you Non-repainting zones: levels are based on real, historical tests and retests — they don't redraw on you. Trade from strength: see the supply and demand areas where price is most likely
FREE

自适应斐波那契追踪系统 (AFT) 自适应斐波那契追踪系统 (AFT) 是一款专为 MT5 和 TradingView 设计的高级非重绘(non-repainting)趋势 shadow 指标。 它结合了自适应斐波那契结构、 智能移动止损(trailing)逻辑和基于波动率 junction 的确认, 旨在帮助交易者捕捉高概率的买入(BUY)和卖出(SELL)机会。 与传统的移动止损指标不同, AFT 通过将市场结构分析、 ATR 波动率过滤、 ADX 趋势强度检测以及斐波那契回调位融为一体, 构建出一套专业的交易系统, 从而能够针对不断变化的市场环境做出动态调整。 该指标专为外汇、 黄金 (XAUUSD)、 股指、 大宗商品和加密货币市场设计, 提供更干净的入场信号、 更强有力的趋势确认、 动态移动支撑/阻力、 实时警报以及内置的风险管理功能(自动绘制止损位 Stop Loss 和 TP1/TP2/TP3 目标 trade )。 无论您是高频头寸持有人(黄牛/scalper)、 日内交易者还是波段交易者, AFT 都能帮助您在所有主要时间周期内提高趋势准确性、 减少市场噪音并更高效地
FREE
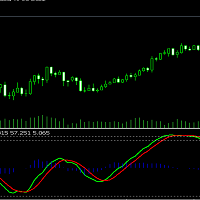
The WaveTrend (LazyBear) indicator is a momentum-based oscillator designed to identify reversal points , trend strength , and overbought/oversold conditions in the market. It is widely used in both Forex and Cryptocurrency trading due to its ability to detect turning points earlier than traditional oscillators like RSI or Stochastic.
(I have Converted from the original TradingView Pine Script version)
FREE

持 仓 监 控 面板 我在 自己 的 真实 交易 中 使用 这 款 指标。 我 不仅 希望 展示 交易 结果, 也 希望 让 大家 了解 我在 实际 市场 交易 中 使用 的 工具。 您 可以 在 MQL5 Signals 中 查看 我的 交易 历史、 未 平 仓 和 已 平 仓 交易, 以及 真实 交易 账户 的 统计 数据。 我的 真实 交易 账户: https://www.mql5.com/ru/signals/2385035?source=Site +Signals+My 这 款 指标 有 什么 用途? 当 同时 管理 同一 交易 品种 的 多个 仓 位 时, 了解 整体 持 仓 结构 非常 重要, 包括 Buy 和 Sell 的 总 手数、 净 敞口、 平均 价格, 以及 在 指定 亏损 限 额 下 可能 对应 的 价格 变动。 该 指标 将 这些 参数 整合 到 一个 信息 面板 中, 帮助 您 监 控 当前 持 仓 结构, 并 将 计算 出 的 价格 水平 与 当前 市场 价格 及 Equity 的 变化 进行 对比。 主要 功能 1. 计算 回 撤 价格 水平 指
FREE

Momentum Candle MT5 - Professional Trading Indicator Overview Momentum Candle Detector V4 is a powerful and intelligent indicator designed to identify high-probability momentum candles across all timeframes and instruments. Built with advanced filtering technology, this indicator helps traders spot explosive price movements before they happen. Key Features Core Detection System Universal Compatibility: Works on all pairs - Forex (EURUSD, GBPUSD, USDJPY, etc.), Gold (XAUUSD), Bitcoin (BTCUSD), a
FREE
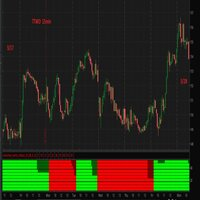
I think you all know Donchian Channels. so I am not going to write about it.
With this indicator I tried to create Donchian Trend Ribbon by using Donchian Channels.
How it works ?
- it calculates main trend direction by using the length that is user-defined. so you can change it as you wish
- then it calculates trend direction for each 9 lower lengths. if you set the length = 20 then the lengths are 19, 18,...11
- and it checks if the trend directions that came from lower lengths is same
FREE
MetaTrader市场是 出售自动交易和技术指标的最好地方。
您只需要以一个有吸引力的设计和良好的描述为MetaTrader平台开发应用程序。我们将为您解释如何在市场发布您的产品将它提供给数以百万计的MetaTrader用户。
