
Bagayoda System
- 指标
- 版本: 1.0

The BAGAYODA TREND indicator is a highly advanced, multi-asset trend-following system designed for MetaTrader 5. It is built to generate precise entry signals with a strict 100% No-Repaint policy.
The core engine combines two Parabolic SAR (Stop and Reverse) indicators running at different frequencies: a highly reactive trigger (Fast SAR) filtered by a strong underlying macroeconomic trend (Big SAR). Signals are only generated when both align, filtering out market noise.
2. CHART ANATOMY & VISUAL ELEMENTS
The indicator overlays specific visual cues on your main chart to help you instantly identify market conditions and entry points.
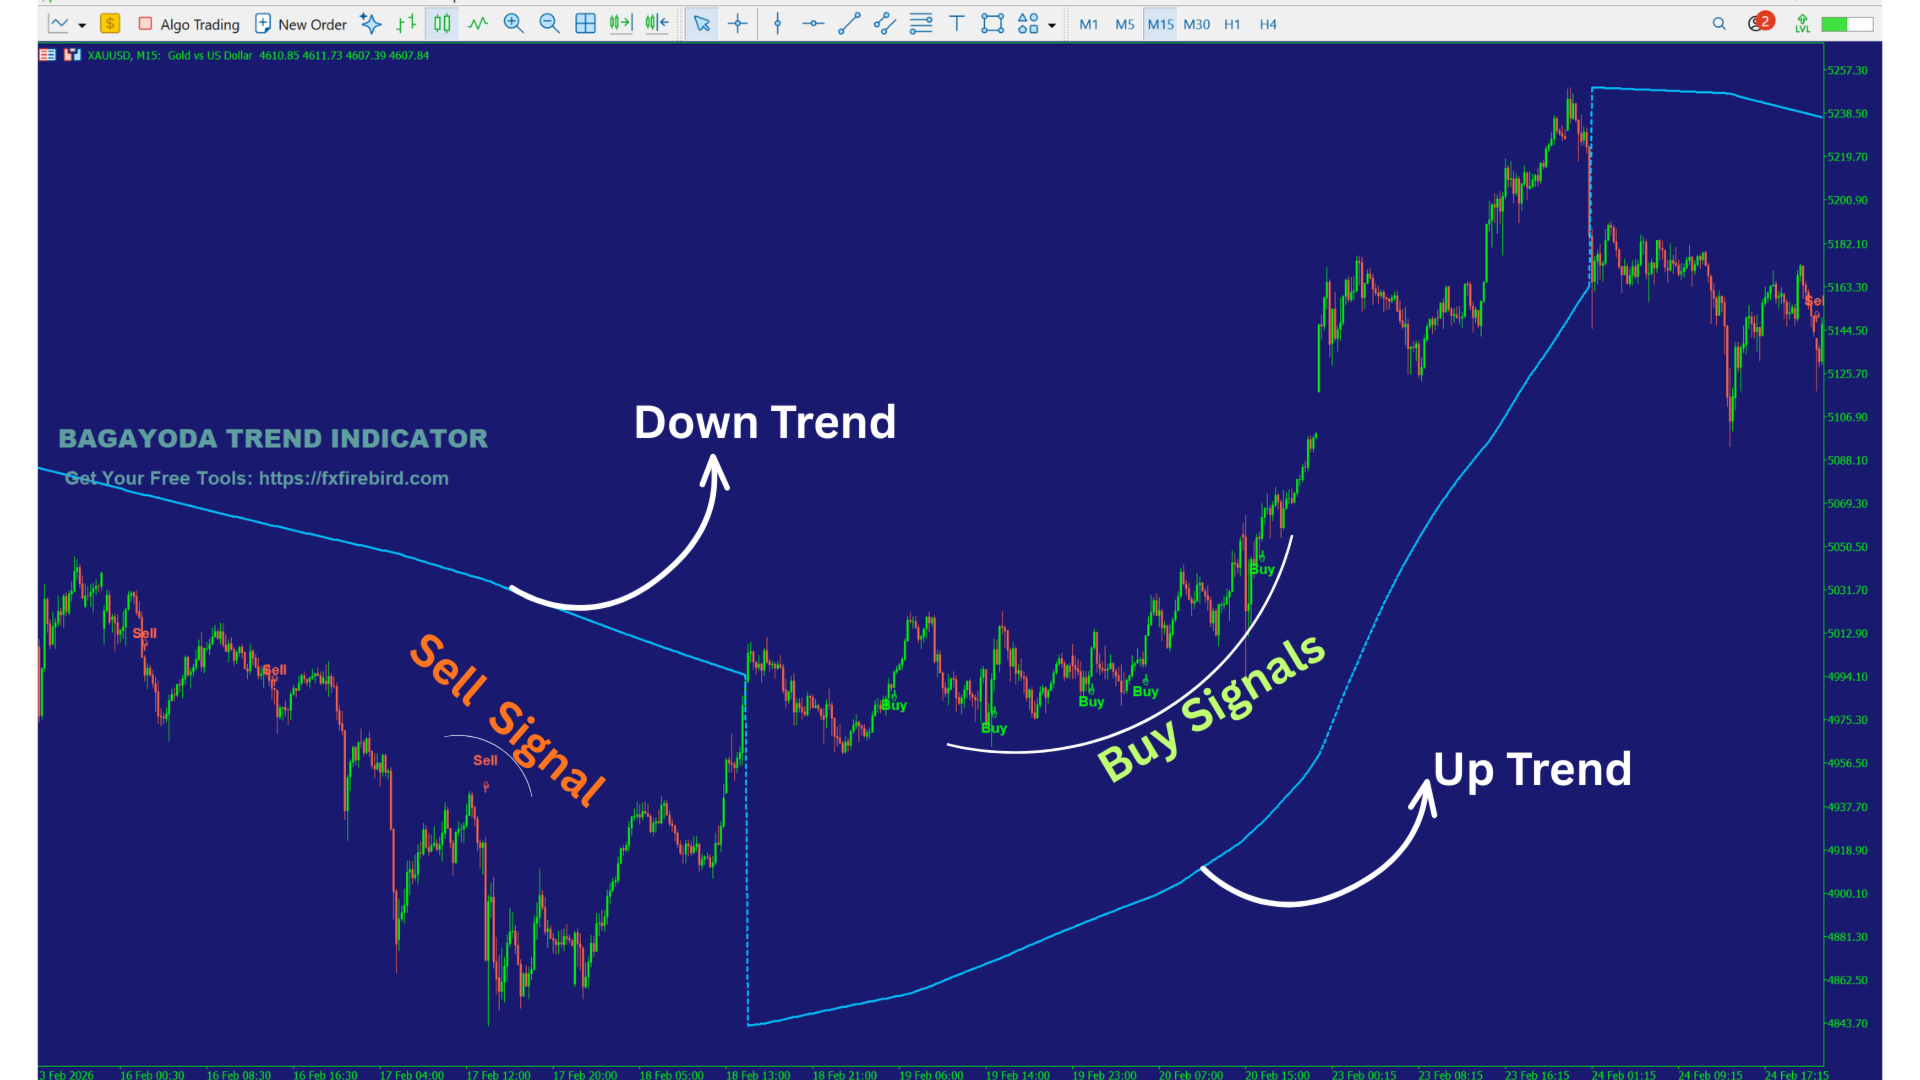
Green Hand + "Buy" Text (Below the candle) Buy Signal: Triggered when short-term momentum aligns with a bullish global trend.
Red Hand + "Sell" Text (Above the candle) Sell Signal: Triggered when short-term momentum aligns with a bearish global trend.
- Blue Dashed Global Trend Filter (Big SAR): Acts as dynamic Line Support/Resistance. Validates or invalidates trade (Continuous line) entries.
3. SIGNAL EXECUTION RULES
The system is strictly rules-based. The indicator will only print an alert if the fast trigger and the background trend are perfectly aligned.
BUY SIGNAL (Long Entry)
A buy signal is triggered when the short-term dynamics join the overarching bullish trend.
- Condition 1 (Macro Filter): The current closing price is above the Blue Dashed Line (Big SAR).
- Condition 2 (Trigger): The Fast Parabolic SAR crosses the price from above to below (switching from bearish to bullish configuration).
Visual Confirmation: A Green Hand icon appears pointing up beneath the candle, directly accompanied by the word "Buy".
Action: Open a BUY position at the open of the next candle following the signal.
SELL SIGNAL (Short Entry)
A sell signal is triggered when the short-term dynamics join the overarching bearish trend.
- Condition 1 (Macro Filter): The current closing price is below the Blue Dashed Line (Big SAR).
- Condition 2 (Trigger): The Fast Parabolic SAR crosses the price from below to above (switching from bullish to bearish configuration).
- Visual Confirmation: A Red Hand icon appears pointing down above the candle, directly accompanied by the word "Sell".
Web Site:
Video Youtube Tutorial: https://youtu.be/UDmkBa0pig4
















































用户没有留下任何评级信息