 MetaTrader 5
 专家
专家
 指标
指标
 程序库
程序库
 实用工具
实用工具
 窗口小部件
窗口小部件
 规则
规则
适用于MetaTrader 5的免费技术指标 - 20
 技术指标的信号外汇和股票市场的开仓交易和平仓交易起着至关重要的作用。指标的本质就是一种交易品种的数学转换,旨在预测未来的价格变化。
测试技术指标可以更有利于预测市场行为并从中获利。
技术指标的信号外汇和股票市场的开仓交易和平仓交易起着至关重要的作用。指标的本质就是一种交易品种的数学转换,旨在预测未来的价格变化。
测试技术指标可以更有利于预测市场行为并从中获利。 
Breakout Confirm Zones is a MetaTrader 5 indicator designed for manual traders who want cleaner support and resistance breakout confirmation. The indicator detects relevant market zones using closed candles only, highlights confirmed breakouts, and monitors possible retests after price breaks through a support or resistance area. It helps traders identify potential buy and sell opportunities without overcrowding the chart. Features Non-repainting confirmed breakout logic Support and resistance z
FREE

QQE Mod Pro (MT5) is a momentum indicator inspired by the well-known QQE Mod concept. It combines a fast histogram-based momentum view with a volatility filter , helping traders distinguish between bullish, bearish, and neutral market conditions more clearly. This version includes two smoothing methods , allowing you to choose between the Original ( TradingView-style) EMA logic and the more traditional Classic/Wilders logic , while keeping the original indicator behavior intact. How the indicato
FREE

Schaff Trend Cycle (STC) "CON ALERTAS"
El Indicador Schaff Trend Cycle (STC) es una herramienta técnica utilizada en el trading e inversión para identificar tendencias y generar señales de compra o venta. ¿Qué es el Schaff Trend Cycle? El STC fue desarrollado por Doug Schaff para mejorar las medias móviles incorporando análisis de ciclos. Su objetivo es identificar tendencias y cambios de tendencia midiendo la fuerza y velocidad de los cambios de precio. Es un oscilador que mide la velocidad
FREE

SuperTrendNew 2.0 is a clean, non-repainting SuperTrend indicator for MetaTrader 5. It draws one trend line you can actually trade from, marks every reversal with an arrow, tells you about it by popup, sound and mobile push, and keeps a live dashboard on the chart with the trend state, the line price, the distance to the line in points and in ATR, and the age of the current trend. Free, no time limit, no ad banner on your chart. What is new in 2.0 Version 1.1 has been on the Market since January
FREE

TITAN Chart Notes – a kereskedési jegyzetfüzeted közvetlenül a diagramon található, riasztókkal.
Írd meg a tervedet, a pályádat és a szabályokat, ahol ténylegesen kereskedsz. Kattints egy sorra, és írd be – minden szimbólumhoz automatikusan elmentődnek a jegyzetek, és újraindítás után visszatérnek.
RIASZTÁSOK – csak írd őket egy sorba: - 14:30 US CPI – 14:30-kor csörög (a számítógép ideje) - >4180 take profit – cseng, amikor az ár eléri vagy meghaladja a 4180-at - <4120 vásárlási zóna – cseng
FREE

TIRED OF FALSE SIGNALS AND DISAPPEARING ARROWS?
Test the logic of Trend Reverting PRO MT5 completely for FREE on EURUSD (M5 & M15) and see the accuracy for yourself!
Hey trader, I know how frustrating it is to look at a beautiful chart history, only to realize the indicator changes its mind during live trading. That’s why I want you to test my algorithm completely risk-free. This is a fully functional free/demo version designed specifically for EURUSD on the M5 and M15 timeframes (works wit
FREE

Converted an existing TradingView Pine Script VWAP indicator into a fully native MQL5 version for MetaTrader 5, maintaining 1:1 calculation accuracy, visual formatting, and functional parity. Technical Implementation: Line-by-Line Logic Translation: Successfully translated Pine Script's ta.vwap() vector calculations and session anchoring into MQL5 dynamic price/volume arrays ( CopyBuffer , CopyTicks ). Multi-Session Anchoring: Retained all customizable session boundaries (Daily, Weekly, Monthly,
FREE

Auto Candle Sequence Counter – MT5指标 概述
Auto Candle Sequence Counter 是一款专业的 MetaTrader 5 指标,可以自动检测并标记连续的多头/空头K线序列。该工具提供实时可视化、统计和提醒,帮助交易者快速分析价格动能和趋势。 主要功能 检测2–7根连续K线(看涨或看跌)。 实时信号,无遗漏。 Doji检测(灵敏度0.01–0.10可调)。 过滤弱势/噪音K线。 专业可视化(绿色=看涨序列,红色=看跌序列,黄色=Doji)。 实时统计面板:多头/空头序列数量。 报警系统:弹窗、声音、推送通知。 优势 快速识别趋势延续或动能衰竭。 与供需、支撑/阻力、SMC结合使用。 适合剥头皮、波段和日内交易。 节省时间,不再手动数K线。 参数设置 序列阈值:2–7根K线。 回溯范围:50–500根。 Doji灵敏度:0.01–0.10。 主题:黑/白背景。 提醒:弹窗、声音、推送。 兼容性 平台: MetaTrader 5 市场: 外汇、黄金、指数、股票、大宗商品、加密货币 时间周期: 所有 (M1–MN1) 免责声明
该指
FREE
因为风格很重要
我知道每次都要点击属性来改变蜡烛的颜色、背景是浅色还是深色,以及放置或删除网格是多么令人厌烦。这里有一个一键式的解决方案。 三个可定制的按钮可以选择交易者想要的蜡烛样式。 一个按钮可以在白天和夜晚模式之间切换。 一个按钮可以在图表上显示或隐藏网格。 ***** 在设置中,你可以选择按钮在屏幕上的显示位置*****。 请考虑查看我的其他产品 https://www.mql5.com/en/users/javimorales.fer/seller
什么是随机RSI?
随机RSI(StochRSI)是技术分析中使用的一个指标,其范围在0和1之间(或在某些图表平台上为0和100),是通过将随机震荡器公式应用于一组相对强度指数(RSI)值而不是标准价格数据来创建的。
作者简介
Javier Morales,交易算法的创始人。
FREE

NWOG Ndog Midnight Open Ict Tjmas is a 100% Free institutional MetaTrader 5 indicator for Inner Circle Trader (ICT) traders. It automatically calculates and plots the full High/Low Opening Gap Ranges, 50% Consequent Encroachment (CE) midpoints, and 00:00 New York Midnight Open with automatic US Daylight Saving Time (EST/EDT) synchronization. KEY INSTITUTIONAL FEATURES: 1. Full New Week Opening Gap (NWOG) Range & 50% CE Automatically measures the gap between Friday 17:00 EST close and Sunday 18:0
FREE

The Advanced Support and Resistance Indicator for MetaTrader 5 leverages sophisticated pivot point detection algorithms to autonomously identify and visualize critical price levels on the chart. Utilizing a configurable pivot period (default: 20 bars) and data source (High/Low or Open/Close), it intelligently scans historical price action within a user-defined loopback window (default: 290 bars) to pinpoint pivot highs and lows with strict validation criteria for enhanced precision. Pivots are d
FREE

This is an indicator for Quasimodo or Over and Under pattern. It automatically finds the swing points and can even place virtual trades with stop loss and take profit. Press the "Optimize" button to automatically find the most effective settings. The pattern consists of four legs A,B,C,D as shown in the pictures. Open and close prices of the virtual trades are Bid price but the statistics in Display Panel take current spread into account. Its parameters are explained below. Buffer - Pips dista
FREE

SnR PREMIUM Smart Support & Resistance Indicator Trade from the Zone. Manage with Precision. SnR Premium adalah indikator Support & Resistance yang dirancang untuk membantu trader membaca area penting pada chart dengan visual yang bersih, sederhana, dan mudah digunakan. Tidak hanya menampilkan zona Support & Resistance, SnR Premium juga dilengkapi dengan panel trading management untuk membantu trader melakukan pengelolaan posisi secara lebih praktis. KEY FEATURES SMART SUPPORT & RESISTANCE
FREE

ATOM Choppiness Zone is an advanced volatility filter designed to eliminate market noise and instantly reveal whether the market is ranging or trending. Based on the classical Choppiness Index formula developed by E.W. Dreiss , this tool converts complex mathematical calculations into a clean, color-coded visual histogram. The Mathematics & Formula The indicator measures market efficiency using fractal dimension logic. It calculates the ratio between the total True Range over $N$ periods and the
FREE

Here's the full product description text: MTF PA Tracker Monitor up to 10 symbol/timeframe combinations — all from a single chart window. MTF PA Tracker renders live, miniature price-action charts directly on your MT5 chart as an overlay panel. No extra windows, no tab switching. Everything you need to read the market across multiple timeframes is in one place, always visible. What It Does The indicator displays up to 10 fully independent mini-charts , each with its own symbol and timeframe. Yo
FREE

Session lines that are actually correct. Marks Sydney, Tokyo, London, and NY open/close in your broker's local time — with automatic DST adjustment for all three regions. You set your session times once in GMT, toggle DST for Sydney/London/NY, and forget about it. The indicator handles the rest - broker offset, daylight saving, label positioning - all in the background. Clean labels, toggleable sessions, zero CPU drag. Built for traders who need the market rhythm on their chart without the clut
FREE

ADR Target Zones — Indicator Description Brief Description ADR Target Zones is a MetaTrader 5 indicator that displays target zones of probable price movement based on the Average Daily Range (ADR) and Average Weekly Range (WADR). The zones are built symmetrically above and below a base price, helping traders identify potential areas of price completion within a day and a week. How It Works The indicator calculates the average High − Low range over a specified number of periods: ADR — Average Dai
FREE
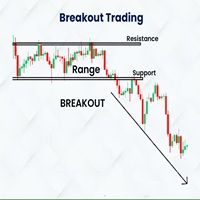
Indicador Basado en la estrategia de ruptura del rango de londres de Amaury Benedetti.
Este indicador dibuja automaticamente el rango, el maximo y minimo y sus correspondientes lineas de stoploss, entrada y takeprofit.
SE RECOMIENDA USAR EN M1 EN EL US30 (DE ACUERDO A LA ESTRATEGIA)
Los valores se pueden modificar de acuerdo a la necesidad del usuario, tambien se tienen mas configuraciones para dibujar cualquier rango en diversos horarios y con diferentes configuraciones de sl, tp, etc
Detal
FREE

Trend Lines Cross This indicator will alert you on any cross of a Trendline. You can draw up to two trend lines and form a channel, a pennant , a triangle or a simple trend and when the price crosses either trend line the indicator will provide you with alerts that you define plus an up or down arrow when the cross happened. How to: Draw the 1st trendline and name it tl1. Draw the 2nd trendline and name it tl2. Select which type of alerts you would like in the indicator properties and you a
FREE

The OHLC indicator shows the current and historical values of High, Low, Open, Close and Mid for a specific time period. It can plot the current values or the values from the previous session. The indicator's range can be calculated from a daily, weekly, monthly, or user-specified session.
Levels High of the current or previous session. Low of the current or previous session. Open of current or previous session. Close of the current or previous session. Midpoint of the current or prev
FREE

更多工具
我的全部指标、EA 和工具都在这里: https://www.mql5.com/en/users/amrosama77/seller
Market Regime Detector - 知道自己身处哪一种市场
突破方法在区间中亏钱。均值回归方法在趋势中亏钱。两种方法本身都没有问题,只是被用在了错误的条件下。Market Regime Detector 说明当前的市场条件,让你判断自己的方法是否与之匹配。
三项独立测量被合并为一个标签,而且只有当新的状态维持足够长的时间、值得相信时,标签才会改变。
三项测量
方向。用 ADX 衡量趋势强度,加上快慢移动平均线的关系以及两者之间以 ATR 表示的间距,这样同一个阈值在平静的货币对和波动剧烈的指数上都能合理运作。
效率。在回溯区间内,净移动距离与价格实际走过的总路程之比。接近一表示走势笔直而有目的;接近零表示市场走了很多路却哪里也没到。
波动率。当前 ATR 与其自身长期平均值的比值。这是比值而非绝对数值,正因如此才能在不同品种之间比较。
七种状态
STRONG TREND UP 和 STRONG TREND D
FREE

Fibonacci MT5 Converted from MT4, Optimized MT5 Version. original MT4 code by Awran5. Non-Repainting Fibonacci Tool for MT5. Fibonacci indicator with a stable non-repainting swing detection engine. Support and questions via MQL5 product comments. For questions, updates, and to connect with other traders, join my official MQL5 group ForexEAandMore
Main Functions Custom Swing Detection Uses proprietary Reverse-Scan plus Peak-Climbing algorithm to find reliable swing highs and lows without repai
FREE
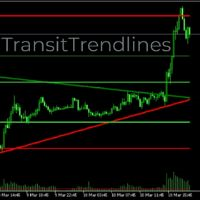
TransitTrendlines this is a automatically trendline drawer, it draw both horizontal and diagonal trendlines. The horizontal trendlines are the pivot points of the day timeframe and the diagonal trendlines are based on the current time frames. You can adjust the diagonal trendlines by increasing the number of bars to draw the diagonal trendline and can also adjust the steepness. Note that the Horizontal trendlines are based on the day pivot points not currant time frame. Join mql5 transitbk98 cha
FREE

This MT5 indicator provides real-time updates of classic Renko charts. Renko charts focus on price movement, filtering out noise and highlighting trends. What are Renko candles? Renko charts display price movement using "bricks" of equal size, ignoring time. A new brick is drawn only when the price moves by a specified amount. They help visualize trends by removing time-based noise.
Parameters - BrickSizePoints (20): Renko brick size in points - HistoryDepthSec (3600): Historical data to ini
FREE

SuperTrend MTF Analytics is a high-performance trend intelligence system engineered to eliminate chart switching and bring institutional-grade multi-timeframe alignment directly to a single workspace. By combining a proprietary, noise-filtering modified ATR algorithm with advanced multi-timeframe overlays, this utility transforms the classic SuperTrend from a simple lagging indicator into a definitive trend-alignment and entry engine. JOIN OUR SUPERTREND MTF COMMUNITY Stop trading in a silo. Con
FREE

Aurum Premium Chart Themes - make MetaTrader 5 look premium in one click.
Combine it with our other FREE PRoducts/Tools
Five hand-tuned colour themes with a soft glow, a clean layout and a subtle symbol watermark. Drop it on any chart and it looks finished instantly. Remove it and your original colours come back automatically.
THEMES - Noir Gold: deep black with gold candles. The signature Aurum look. - Midnight Glass: dark navy with teal and rose. - Carbon: minimal black and white. - Ivor
FREE

MovingAverage Cloud
Imagine this, you want to know when all moving averages between 20 to 100 are all moving in one direction. This indicator does that. You enter in the first period of the smallest moving average, and the last period of the highest moving average. If all the moving averages are moving in the same direction, the indicator will plot the colour for that direction, e.g blue, more than half of the moving averages in that range change colour to the opposite direction, a yellow/oran
FREE

Risk Calculator Lines is a position size calculator for MetaTrader 5. Place the Entry line and the Stop Loss line where you plan to trade, and the panel shows the lot size for the percentage of your account you chose to risk. The indicator does not open, modify or close trades. It only calculates and displays. How to use Attach the indicator to a chart. Two horizontal lines appear: Entry and Stop Loss. Drag them to your planned entry price and stop loss price, then read the lot size from the pan
FREE

QCL Bollinger Trend Trail Follow trend direction with a clear, adaptive line directly on your price chart. QCL Bollinger Trend Trail combines trend detection with integrated volatility filtering to display a trailing reference line. Its two-color presentation helps you identify rising, falling, and unchanged trend conditions without adding a separate indicator window. The line advances as the trend develops and holds its position when conditions do not support further movement. Key Features Adap
FREE

Apex Zone Reversal 产品概述 Apex Zone Reversal 是专为 MetaTrader 5 (MT5) 开发的技术分析指标。它旨在帮助交易者根据 ZORRO 框架和市场结构反转来识别市场支撑位、阻力位和反转区。 核心功能 区域绘制 :使用源自 ZORRO 框架的系统逻辑自动识别支撑、阻力 and 反转区。 时间周期过滤 :包含内置参数,可限制在 M1、M2 和 M3 等较小时间周期上的绘制,保持图表清晰。 回撤缩放 :正确地从起点到终点绘制内部分析叠加层。 多资产兼容性 :经过工程设计,可用于各种金融工具,包括黄金 (XAUUSD) 和货币对等主要资产。 规格 平台 :MetaTrader 5 (MT5) 产品类型 :自定义技术指标(编译为 EX5 文件) 语言 :英语(所有输入和消息均为英语)
FREE

HA Flow Mean HA Flow Mean is a free adaptive equilibrium indicator for MetaTrader 5. It brings candle structure, directional persistence and smoothing together in one color-coded line on the main price chart. An optional information panel provides a clear summary of the most recently closed candle. What the indicator measures The calculation combines three elements of each candle: the direction and relative size of its real body, the imbalance between its upper and lower wicks, and the position
FREE

Genaro RSI 是一款高级技术指标,用于识别价格与 RSI 之间的背离,并自动改变振荡器线条颜色,以便于实时图表阅读。当检测到看涨背离时(价格形成较低的低点,RSI 形成较高的低点),RSI 线条变为绿色。当检测到看跌背离时(价格形成较高的高点,RSI 形成较低的高点),线条变为粉色。正常情况下,线条保持蓝色。该指标在初始化时执行完整历史扫描,识别图表开始以来的所有背离,并在每个新 K 线上继续监控新的背离。 背离用连接对应枢轴的线条标记,箭头指示精确信号点。信息面板显示当前 RSI 状态(上涨、下跌、超买、超卖、看涨背离、看跌背离),颜色动态变化。可为背离和 70/30 水平穿越启用声音提醒、弹出提醒和推送通知。该指标适用于 MetaTrader 5 上的任何品种和时间周期。 如何使用 将 Genaro RSI 附加到所需品种的图表上。 RSI 线条将根据检测到的背离自动改变颜色。 绿色线条连接低点(看涨背离 / 买入信号)。 粉色线条连接高点(看跌背离 / 卖出信号)。 黄色箭头标记最近背离的信号点。 左上角面板显示当前状态。 在图表上按 R 键可清除所有标记并强制重新扫描历
FREE

Liquidity Grab X — Liquidity Sweep & Grab Detector (MT5) Full Description Liquidity Grab X is a free rule-based indicator for MetaTrader 4 and MetaTrader 5 that identifies liquidity grabs — moments where price sweeps above a prior swing high or below a prior swing low, triggers resting stop orders, and then rejects back into range. These sweeps are commonly used by price-action and smart-money-concept (SMC) traders as a sign of exhaustion or a potential reversal trigger. How It Works Pivot Detec
FREE

Volume Profile FAN 成交量分布指标
一句话介绍: 在图表右侧/左侧显示成交量分布柱状图,直观展示每个价格区间的成交量大小,帮助识别关键支撑阻力位。
核心功能: - 成交量分布柱状图:将价格范围分成N个格子,统计每个格子的成交量 - POC(控制点):成交量最大的价格水平,橙色加粗线 - 价值区域(VAH/VAL):占70%成交量的价格区间,红/绿色线 - 高量柱标记:成交量超过阈值80%的柱子自动高亮 - 价格突破警报:价格突破POC/VAH/VAL时可弹窗/声音提醒 - 可拖拽范围:绿色垂直线可拖动,调整计算范围 - 左右切换:柱状图可显示在图表左侧或右侧
可调节参数: 计算设置: - 回测K线数量:计算多少根K线(默认100) - VP柱数量:价格分成多少个格子(默认100) - 价值区域百分比:价值区域占比(默认70%)
颜色设置: - 普通柱/POC/VAH/VAL/高量柱颜色全可自定义
显示设置: - 柱状图位置:左侧/右侧 - POC/VAH/VAL延伸线开关
警报设置: - POC/VAH/VAL突破警报独立开关
适用场景: - 支撑阻力
FREE

SMC Sentinel — Smart Money Concepts 指标 顺应市场结构交易,以不同视角洞察市场。 SMC Sentinel 是一款面向 MetaTrader 5 的高级 Smart Money Concepts(SMC)分析指标 ,将多种价格行为分析概念整合到一个简洁、可自定义的图表分析系统中。 SMC Sentinel 不依赖单一信号,而是综合分析市场结构、流动性、价格失衡、机构区域、回撤区域以及趋势背景,帮助交易者理解 价格从哪里来、正在对什么产生反应,以及潜在交易机会正在什么位置形成。 核心功能 市场结构 直接在 MT5 图表上识别重要的市场结构变化: Swing Highs & Swing Lows BOS — Break of Structure CHoCH — Change of Character 主要结构过滤 可配置的摆动与结构强度 高周期市场偏向 结构分析引擎可以帮助你专注于重要的市场运动,同时减少图表中的无关噪音。 流动性分析 SMC Sentinel 映射重要的流动性区域以及价格互动: Buy-Side Liquidity (
FREE

Plus FlowProfile — MT5 买入与卖出方向区域 Plus FlowProfile 通过将分析分为买入和卖出的方向阶段,扩展了传统的 Profile 分析方式。 单独使用时,紧凑的 FLOW BUY / FLOW SELL 按钮可以快速在下方买入 Profile 和上方卖出 Profile 之间进行切换。当与 Indicator Center 或 EA Assistant 集成时,状态将直接由系统控制项进行控制。 主要功能: BUY 和 SELL 方向模式; 单独使用时提供切换按钮; 可选择使用自动或手动的更高时间周期进行分析; 方向性 POC; HVN 和 LVN 区域; 智能突出显示最重要的区域; Flow Score、置信度、质量和区域 DNA 可配置; 可视化入场区域; 买入和卖出使用独立颜色; 支持实时图表和策略测试器可视化模式; 为 Indicator Center 和 EA Assistant 提供集成功能。 该指标将订单流和成交量信息进行组织,以辅助决策。它不会自动开仓,也不保证任何结果。 指标是辅助分析工具,不构成投资建议。点差条件会根据资产、经纪商、
FREE

RBM SMC Liquidity Hunter MT5 — Institutional Structure and Liquidity Indicator The RBM SMC Liquidity Hunter is a professional tool developed to map Smart Money Concepts (SMC) dynamics directly on your charts. The indicator tracks market structure breaks, validates supply and demand zones using price displacement, and detects liquidity sweeps confirmed by volume, integrating all confluences into an executive on-chart dashboard. Key Features Market Structure Mapping (BOS / CHoCH): Automatic
FREE

This SMT (Smart Money Technique) divergence indicator identifies discrepancies in price movement between two different trading symbols, helping traders detect potential market reversals. This tool compares the price action of two correlated assets, such as two currency pairs or indices, to spot divergences where one asset's price moves in the opposite direction of the other. For example, while one symbol may be making higher highs, the other might be making lower highs, signaling a divergence. T
FREE
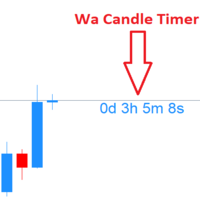
Wa Candle Timer MT5 在主图窗口实时显示当前K线距离收盘的倒计时。随着K线接近结束,计时器会变色(默认当已走完约 95% 的K线时长,即剩余约 5% 时间时)。
该指标轻量、清晰,非常适合需要按K线收盘来同步进出场的交易者。 核心特性 任意品种、任意周期的 收盘倒计时 。 当K线将近结束时 自动变色 (默认阈值≈ 95% 已消耗)。 简洁、不遮挡 的图上文本,支持自定义字体与字号。 安全的对象管理 : v2 仅清理自身对象(前缀 “Wa_CT” ),不会影响你的其他图表元素。 高效 、 占用资源低 。 输入参数 clrBeforeDecisionPointTimer —— 阈值前的文本颜色。 clrAfterDecisionPointTimer —— 接近收盘时的文本颜色(超过阈值后)。 fontSizeTimer —— 文本字号。 fontTimer —— 字体(如 "Arial")。 说明: 内部阈值为 DecisionPointForCandleTimer = 95 (≈ 剩余 5% 时间)。如需不同阈值,请告诉我——我可以提供把该阈值做成输入项的版本。 工作原
FREE

The previous day's open, close, high and low are among the levels the market respects most. Gold, Nasdaq, forex, indices: price comes back to these points, tests them, rejects them or breaks through. RBM Prior Cote draws them for you automatically, so you stop marking lines by hand every morning.
What it does
• Plots the open, close, high and low of the previous daily candle • Shows the last several days of history (you choose how many), so you can see where price actually reacted • Adds a la
FREE

Kumo Forge Pro 是一款适用于 MetaTrader 5 的非重绘自适应一目均衡表交易系统。它远超标准一目均衡表指标,新增了自适应波动率引擎(可根据实时市场状况自动缩放转换线、基准线和先行跨度 B 的周期)、0–110 分的 9 因子共振评分引擎、五种独立信号类型(TK 交叉、基准线反弹、云层边缘反弹、迟行线突破和云层突破)、动量脉冲引擎、具有三种止损模式和三个止盈级别的智能 TP/SL 系统,以及包含多时间周期对齐面板的 22–28 行综合大盘。每个信号仅在确认的 K 线收盘时触发,不会重绘。 查看 MT4 版本: Kumo Forge Pro MT4 查看更多产品: 全部产 品 欢迎访问我的主页查看实时示例和新工具,并发送好友申请,第一时间获取更新!
工作原理 自适应一目均衡表引擎 核心引擎通过可配置的回望窗口(默认:50 根 K 线)测量 ATR(14) 相对于其最高值和最低值,生成 0.0 至 1.0 的波动率比率。每个一目均衡表周期——转换线(9)、基准线(26)和先行跨度 B(52)——根据该比率和自适应强度参数(默认:0.4,即周期可拉伸 ±40%)进
FREE

ModGod Institutional MACD - Normalized Momentum Oscillator The ModGod Institutional MACD is not your standard oscillator. Built specifically to work in synergy with the ModGod Scalp Pullback indicator, this tool replaces traditional EMAs with a highly smoothed Triangular Moving Average (TMA) engine and ATR-driven normalization. By normalizing the MACD values using dynamic market volatility (ATR), the oscillator is trapped within precise mathematical boundaries (Supply and Demand zones). This
FREE

找出每个周期内成交量最大的K线,并将其转化为可操作的水平。量在哪里,位就在哪里。 • 对每个周期(日、周或您选择的任意周期),指标找到成交量最高的那根K线,并将其 High、Low 和 Mid 绘制为水平线。 • 水平线可在周期边界处结束,也可作为射线向右延伸。 • K线周期可在面板上一键切换。 • 成交量标签显示定义该水平的K线的实际成交量。 • 多时间周期:同时跟踪多个周期的最大成交量水平。 • 水平触及警报(默认关闭)。 图表控制面板:可拖动面板,带周期选择和设置窗口——11 种界面语言、深色与浅色主题、18 色调色板、30–300% 面板缩放。所有设置自动保存。 如果您在使用中遇到任何问题或 bug,请随时联系我——我会尽快修复。也恳请您留下评价:您的反馈是我持续为大家打造优质工具的动力。 喜欢这个指标吗?它只是我的交易面板 Trade Assistant Panel All in One MT5 的17个模块之一。面板内含全部17个指标(订单块、FVG、交易时段、成交量分布、VWAP、SMT、超级趋势等),外加一键交易:按账户风险百分比自动计算手数、分形止损、按盈亏比R:
FREE

The Market Runs on Round Numbers. The Dynamic Sweet Spots Grid (developed by Ghost Writer) reveals these institutional zones automatically. Unlike legacy grid indicators that require you to manually guess the correct pip-step for every single chart, this indicator features a "Ghost Writer" dynamic engine. It instantly detects the asset you are trading and scales the grid to perfectly match the asset's magnitude. The 3-Tier Institutional System The indicator breaks down standard price movements
FREE

Smart Money Structure XAUUSD H1 Smart Money Structure XAUUSD H1 is a technical indicator designed to help traders analyze market structure on XAUUSD (Gold) , with a primary focus on the H1 timeframe . The indicator automatically analyzes closed candles and displays various market structure elements directly on the chart. Main Features The indicator can identify and display: HH — Higher High : a higher swing high. BH : a structural level supporting bullish continuation. HB : a structural level as
FREE

Force Candle Pro is an advanced indicator designed to identify strong momentum candles in the market, helping traders detect high-probability movements and institutional activity.
This tool analyzes candle strength based on body size, volatility, and directional consistency, filtering out weak and indecisive movements.
Unlike common indicators, Force Candle Pro focuses on market impulse, allowing traders to identify when the market is truly moving with strength.
MAIN FEATURES:
- Detection o
FREE

Stop Loss Pro – Precision Risk Management for Every Trader
Stop Loss Pro is a powerful, free MetaTrader indicator designed to take the guesswork out of risk management. Built on advanced market structure analysis, it automatically identifies and displays the most reliable stop‑loss levels directly on your chart. With this tool, traders can protect their trades with confidence, knowing that each suggested level is backed by a blend of technical logic, volume dynamics, and volatility filters. Ho
FREE

Note from Developer:
This is the lite version of the Double TMA with Bands Indicator.
You can find the paid version that comes with alerts and on screen signal arrows built in here .
I will also be selling an EA based on this trading system soon once all backtesting and optimization have been completed.
Unlock your trading potential with the Double TMA Indicator with Reversal Detection!
Designed for swing and reversal trading, this versatile tool integrates two Triangular Moving Averages (
FREE

XE Forex Strengh Indicator MT5 displays visual information about direction and strength of a signal for current pair and chosen timeframes (M5, M15, M30 and H1). Calculations are based on multiple factors and results are shown as a colored panel with scale bar, numerical values and arrows. There are also displayed values of current price and spread on the pair. There can be activated an alert (as a mail or pop-up window with sound) for each available timeframes which send a message when the dir
FREE

Elevate your trading precision with the Copilot HUD Precision Price & Spread Visualizer. Most traders fail because they ignore the spread or lose track of candle closing times. This indicator is designed to provide professional-grade price transparency directly on your main chart window, combining a sleek dashboard with dynamic Bid/Ask visualization. Key Features: Dynamic Bid/Ask Lines: Unlike the default MT5 lines, these lines follow the current candle with a customizable length and thickness,
FREE

Blahtech Moving Average indicator is a multitimeframe version of the standard Moving Average indicator. It is also enhanced with customisable alerts, period breaks and other configuration options. The 50 day and 200 day moving averages are widely followed by investors and traders, with breaks above and below the MA lines considered to be signals of interest. Links [ Install | Update | Training | All Products ]
Feature Highlights Up to three timeframes Configurable calculation variabl
FREE
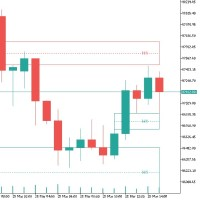
交易中的不平衡:基础与策略 交易中的不平衡是指市场上供需之间存在差异的现象。 这可能表现为过多的买入订单(看涨不平衡)或卖出订单(看跌不平衡),导致定价效率低下,并为交易者创造机会。 技术方面 “烛台形态” :不平衡通常由三根蜡烛形态表示,其中第二根蜡烛比其他蜡烛长,并决定移动方向。 “蜡烛阴影” :不平衡的主要标准是第一根和第三根蜡烛的阴影不重叠。 如何交易不平衡 基本策略 “识别不平衡” :寻找价格在没有足够交易量的情况下急剧变化的区域。 “入场点” :在不平衡的部分或完全重叠之后,使用限价单进入交易。 “风险管理” :将止损单设置在不平衡区域之外,并将止盈设置在不平衡大小的1.5–2倍处。 策略示例 “部分或完全填充不平衡” :交易者等待价格部分或完全填充不平衡区域,并朝着与移动方向相反的方向开仓。 如果完全填补不平衡,重要的是不平衡仅由蜡烛的阴影完全填补。如果填充发生在蜡烛实体中(蜡烛在不平衡后收盘,穿过它),则在任何情况下都不应朝着相反的方向开仓。 “使用订单块” :分析订单块有助于确定不平衡区域中的入场点和出场点。 建议 “使用限价单” :最大程度地降低风险并准确地进入交易
FREE
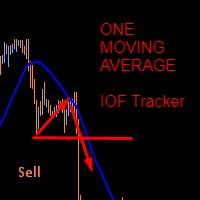
This indicator was created based on posts from forex factory thread titled There is no Magic Moving Average - You need only one - by @andose2 a.k.a Andrei Florin. If you want to know about how to use this trading strategy please go and read https://www.forexfactory.com/thread/691864-there-is-no-magic-moving-average-you.
Note: Below are extracts some of the posts .
Estabilish a trend, based on Market Cycles, then go only long in the Markup Phase and only short in the Decline phase , st
FREE

This indicator detects two classic reversal candlestick patterns — Pin Bar and Engulfing — and marks them with a simple up/down arrow. Detection is fully customizable: enable either or both patterns, adjust wick/body ratios and the minimum candle size (ATR-based, so it adapts automatically to any symbol or timeframe).
Its main feature is that it’s 100% non-repainting. The arrow on the currently forming candle is provisional and may adjust while that candle is still open — that’s just live pri
FREE

Markov Prime 是一款新一代专业分析指标,它将经典技术分析与概率论(马尔可夫链)和分形几何(时间指数)相结合。 与大多数具有“记忆”且严重滞后的标准指标不同,Markov Prime 以不同的方式分析市场:它实时计算当前市场状态(趋势或盘整)持续的概率。该指标旨在过滤市场噪音期间的虚假入场信号,并寻找最有可能的建仓点。 该指标不重绘(Non-Repainting),在已收盘的 K 线上不滞后,并在图表上配有便捷的信息面板。 核心技术: 马尔可夫链过滤器 (Markov Chain Filter):分析过去 100 根 K 线并构建状态转移矩阵。如果出现信号,但马尔可夫模型显示趋势延续的概率很低,则该信号将被阻止。 时间指数 (Time Exponent, TE):评估价格运动的“质量”。它过滤掉混乱(噪音)的运动,防止在震荡市中入场。 混合信号核心:您可以通过方便的下拉菜单直接在图表上选择三种内置策略之一。 三种内置策略: RSI + EMA Trend:顺着全局趋势的方向进行回调交易(使用 RSI 超买/超卖区和 EMA 21/50 过滤器)。 EMA 21/50 Cros
FREE
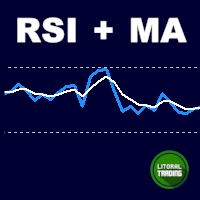
RSI with moving average is great to see when the price is overbought and oversold instead of RSI only.
INPU T PARAME TERS : RSI:
Period - RSI period.
Price - RSI applied price.
Color scheme - RSI color scheme (4 available). MOVING AVERAGE:
Period - MA period.
Type - MA type.
Apply - MA applica tion.
Shift - MA shif t (correc tion). PRICE LINE:
Show - specify if line with price, only line or nothing.
Style - line style. OTHER:
Overbought level - specify the level .
Overbought descriptio
FREE

Quantora Market Structure MT5 is a MetaTrader 5 indicator that identifies confirmed swing points and displays market structure events on the chart. The indicator classifies detected swing points as Higher High, Higher Low, Lower High or Lower Low. It also marks Break of Structure and Change of Character events according to its detection conditions. Market Structure Analysis Higher High and Higher Low detection Lower High and Lower Low detection Bullish and bearish Break of Structure events Chan
FREE
交易实用必备工具指标 波浪自动计算指标,通道趋势交易 完美的趋势-波浪自动计算通道计算 , MT4版本 完美的趋势-波浪自动计算通道计算 , MT5版本 本地跟单复制交易 Easy And Fast Copy , MT4版本 Easy And Fast Copy , MT5版本 本地跟单复制交易 模拟试用 Easy And Fast Copy , MT4 模拟账号运行 Easy And Fast Copy , MT5 模拟账号运行 "Cooperative QQ:556024 " "Cooperation wechat:556024" "Cooperative email:556024@qq.com" 强烈推荐趋势指标, 波浪的标准自动计算 和 波浪的标准自动计算MT5版本
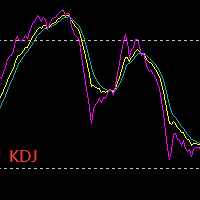
KDJ指标又叫 随机指标 ,是一种相当新颖、实用的技术分析指标,它起先用于期货市场的分析,后被广泛用于股市的中短期趋势分析,是期货和股票市场上最常用的技术分析工具。 随机指标KDJ一般是用于股票分析的统计体系,根据统计学原理,通过一个特定的周期(常为9日、9周等)内出现过的最高价、最低价及最
FREE

Stochastic RSI-RVI Fusion Dashboard (MTF) Unlock the full "Matrix" view of the market. The Stochastic RSI-RVI Fusion Dashboard is the advanced companion to the Stochastic RSI-RVI Fusion oscillator. While the standard indicator analyzes the current chart, this Dashboard monitors the entire spectrum of timeframes simultaneously—from the 1-minute scalping noise to the monthly macro trends. Trading with a single timeframe often leads to "tunnel vision." You might buy on the H1 timeframe beca
FREE

Cobalt Predictive Channel:预见未来的动态回归助手 别再手动画通道了,别再因为假突破(fakeouts)亏钱了,也别再总是最后一个进场了。 Cobalt Predictive Channel 是一款机构级别的“预警与回归”辅助工具,专为 XAUUSD(黄金)、比特币和外汇主要货币对等高波动性市场设计。与传统指标不同,它不仅描绘过去,更能预测刚刚萌芽的趋势,让您始终领先市场一步。 为什么要使用 Cobalt Predictive Channel? 大多数交易者试图在市场形成清晰的通道后才入场,这通常会导致在“趋势末端”入场而亏损。此外,在黄金和加密货币等市场中,被称为“扫损(liquidity hunts)”的剧烈插针(上下影线)会让手动绘制的通道变得毫无意义。 Cobalt Analyst 架构正是为了解决这两个主要问题而开发的: 预见未来: 当市场开始转向时,在趋势完全确立之前,它会通过“预测通道(Predictive Channel)”用虚线为您绘制出潜在的新路径。 避开陷阱: 它不会被影线欺骗。它基于质量中心(典型价格,Typical Price)进
FREE
具有多时间框架支持、可自定义视觉信号和可配置警报系统的商品通道指数(CCI)指标。
自由编程服务、更新和其他TrueTL产品可在我的 MQL5个人资料 中获取。
非常欢迎您的反馈和评价!
什么是CCI? 商品通道指数(CCI)是由唐纳德·兰伯特于1980年开发的多功能振荡器,用于测量价格与其统计平均值的偏差。该指标将当前价格水平与特定时期的平均价格水平进行比较,揭示超买和超卖状态。 CCI主要用于识别周期性趋势和极端状态。超过+100的值表示超买状态,而低于-100的值表示超卖状态。该指标围绕零振荡,大多数值通常在+100和-100之间。交易者还会关注CCI与价格走势之间的背离,这可能预示潜在的趋势反转。 功能: 带箭头和垂直线的视觉信号标记 三个独立的信号缓冲器,具有可配置的触发条件(方向变化、水平穿越、高点/低点、极端区域) 可配置的警报(电子邮件、推送、声音、弹窗),支持时间范围过滤 具有插值方法的多时间框架(MTF)功能 多种绘图和颜色模式(直方图/线条、简单/方向/基于水平的着色) 可调整的超买/超卖水平,带可选的中间水平 通过自定义指标调用(iCustom)访问缓冲器
FREE

COASYN Directional Order Blocks is a MetaTrader 5 market-structure indicator that identifies directional supply and demand zones created around confirmed structure breaks with displacement. The indicator is designed to help traders visualize potential areas of prior participation without turning those zones into automatic trade signals. How blocks are created A new order block requires: 1. A confirmed structure break
The indicator tracks swing highs and swing lows using the configurable Structu
FREE

Daily Pivot Levels is the free Lite version of the Daily CPR toolset for MetaTrader 5.
It plots the current day's Central Pivot Range from the previous completed daily candle:
- TC: Top Central Pivot - P: Pivot - BC: Bottom Central Pivot
The goal is simple daily context. Intraday traders can keep the current CPR zone visible on M5, M15, M30, H1, or higher charts without manually drawing the levels each day.
Main uses:
- Mark the current day's CPR zone. - Add daily context to intraday charts
FREE

If you like BTC Speed Alpha Indicator, you can also check BTC Speed Alpha EA on my MQL5 profile. The EA version is designed for automated BTCUSD trading with risk control, Break Even, trailing stop, position assist and dashboard panel.
BTC Speed Alpha is a free MetaTrader 5 indicator designed for Bitcoin / BTCUSD traders who want a clean visual tool for reading market direction, impulse movement and potential BUY / SELL opportunities directly on the chart.
The indicator combines an adaptive t
FREE

RITZ Candle Kaufman’s AMA is a precision market-flow indicator built around Kaufman’s Adaptive Moving Average (KAMA / AMA) — a dynamic smoothing algorithm that automatically adjusts to changing volatility.
This enhanced version interprets AMA momentum directly into smart candle-color signals , giving traders a clean, noise-filtered view of trend strength and directional bias. Where most indicators repaint or react too slowly, RITZ Candle AMA delivers stable, non-repainting color shifts based on
FREE
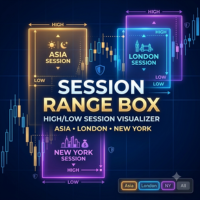
Session Range Box — Session High/Low Visualizer Overview Session Range Box draws live, color-coded rectangles on your chart marking the high and low reached during the Asia, London, and New York trading sessions. As each session unfolds, its box grows in real time to reflect the range built so far, then locks in place once the session closes. A simple on-chart control panel lets you show or hide any session instantly, so you can study one session's range in isolation or view all three overlaid a
FREE

This indicator, called the “Moving Average Crossover Suite,” is the classic moving average crossover indicator. It takes into account all types of moving averages available in MQL5. As is well known, this indicator—whether it involves two or three moving averages, of the same or different types—has been extensively discussed in the relevant literature, particularly in *Technical Analysis of the Financial Markets* and *The Visual Investor*, both by John Murphy. First, it should be noted that the
FREE
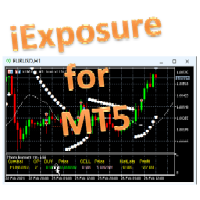
One of the good and important features in MT4 is the availability of the iExposure indicator. With the iExposure indicator, traders can see a comparison of ongoing open positions and how much funds have been used, and more importantly what is the average value of these open positions.
Unfortunately this indicator is not available on MT5.
This indicator is iExposure MT4 which I rewrote using the MT5 programming language. This indicator can be used like iExposure on MT4 with the same functions.
FREE

SR Zones ATR-Adaptive — Multi-Timeframe Support & Resistance Support and resistance, built the way price actually respects it: as zones, not single lines. Most S/R indicators either plot raw fractals (noisy, fixed sensitivity) or a handful of manually-placed horizontal lines. SR Zones ATR-Adaptive instead detects confirmed swing pivots and clusters the ones that are genuinely close together into clean price zones — then ranks them by how many times price has actually reacted there. Zone width i
FREE

A very simple indicator, but one that cannot be missed when carrying out your operations.
Fast and accurate Spreed information before entering a trade as well as the time to start another candlestick.
Spread refers to the difference between the buy (purchase) and sell (offer) price of a stock, bond or currency transaction.
Come and see our mql5 signals too. https://www.mql5.com/pt/signals/899841?source=Site +Signals+From+Author
FREE
MetaTrader市场提供了一个方便,安全的购买MetaTrader平台应用程序的场所。直接从您的程序端免费下载EA交易和指标的试用版在测试策略中进行测试。
在不同模式下测试应用程序来监视性能和为您想要使用MQL5.community支付系统的产品进行付款。
