 MetaTrader 5
 专家
专家
 指标
指标
 程序库
程序库
 实用工具
实用工具
 窗口小部件
窗口小部件
 规则
规则
适用于MetaTrader 5的免费技术指标 - 28
 技术指标的信号外汇和股票市场的开仓交易和平仓交易起着至关重要的作用。指标的本质就是一种交易品种的数学转换,旨在预测未来的价格变化。
测试技术指标可以更有利于预测市场行为并从中获利。
技术指标的信号外汇和股票市场的开仓交易和平仓交易起着至关重要的作用。指标的本质就是一种交易品种的数学转换,旨在预测未来的价格变化。
测试技术指标可以更有利于预测市场行为并从中获利。 
OSS ULTIMATE ELITE 2026 – Institutional Smart Money System Stop chasing price. Start trading like smart money. Why Traders Are Switching to OSS Elite Most indicators react after the move.
OSS ULTIMATE ELITE is designed to help you position before the move happens. This is not just another signal tool — it’s a complete trading framework combining momentum, structure, and liquidity behavior. What Makes This Different? Not lagging signals Not random arrows Not overfitted strategies Built
FREE

Floating DD Tracker — Free Risk Monitoring Indicator for MT5 Floating DD Tracker is a lightweight and professional MetaTrader 5 indicator designed to help traders monitor real-time floating drawdown directly on the chart. The indicator continuously tracks your current floating drawdown, records the highest drawdown reached, and displays the historical maximum DD with the exact date and time it occurred. Its compact neon-style dashboard is optimized for all chart sizes and provides instant visual
FREE

Elevate Your Trading with Advanced Anchored Volume Weighted Average Price Technology Unlock the true power of price action with our premium Anchored VWAP Indicator for MetaTrader 5 - the essential tool for precision entries, strategic exits, and high-probability trend continuation setups. Write me a DM for a 7 day free trial. Anchored VWAP Plus gives traders unprecedented control by allowing custom anchor points for Volume Weighted Average Price calculations on any chart. With support for 4 sim
FREE
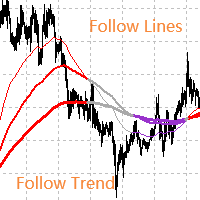
指标适用于趋势跟随者! 三条均线构建的交易系统.顺势交易,让利润奔跑 . 交易实用必备工具指标 波浪自动计算指标,通道趋势交易 完美的趋势-波浪自动计算通道计算 , MT4版本 完美的趋势-波浪自动计算通道计算 , MT5版本 本地跟单复制交易 Easy And Fast Copy , MT4版本 Easy And Fast Copy , MT5版本 本地跟单复制交易 模拟试用 Easy And Fast Copy , MT4 模拟账号运行 Easy And Fast Copy , MT5 模拟账号运行 强烈推荐趋势指标, 波浪的标准自动计算 和 波浪的标准自动计算MT5版本
合作QQ:556024" 合作wechat:556024" 合作email:556024@qq.com" 专业EA指标定制编写. 首先,我们要明白,所有的移动均线都是滞后指标,它们只能事后告诉你市场已经转向,即使它们提供了有价值的信息并且帮助你建立了头寸,不能协助在利润最大化方面发挥太多作用,所以要配合均线价值回归区域使用,价格可以根据重要支撑线的指示,不是滞后的,当市场从目前的隧道出发跟随趋势交易不断
FREE

https://www.mql5.com/es/users/manu28487/seller
XBK System Hot Zone — Live Buyer vs. Seller Power Indicator for MT5 Stop reading a quiet price chart. Start watching the fight. XBK War Zone turns your MetaTrader 5 chart into a live battlefield between buyers and sellers. The entire chart background splits into two semi-transparent color zones — one for sellers, one for buyers — and the dividing frontier moves in real time as the balance of power shifts. No grid, no native volume histogram, no clu
FREE

TWAP/VWAP Indicator - a professional technical analysis tool that displays two important moving averages on the chart: TWAP (Time Weighted Average Price) - calculated as a simple arithmetic average of closing prices over the specified period. VWAP (Volume Weighted Average Price) - calculated using the typical price (high+low+close)/3 weighted by trading volume. Key Features: Dual indicator in one window Adjustable calculation period Clear visualization (blue line - TWAP, red line - VWAP) E
FREE

概述
我不会刻意索要评价或评分,这完全取决于您的使用体验和感受。
这是一个专为 MetaTrader 5 (MQL5) 开发的自定义蜡烛图着色指标。它根据蜡烛在每日循环周期中的位置(例如:当天的第 1、第 2 或第 3 根蜡烛)为图表上的每根蜡烛着色,同时还能区分每个位置上的看涨(阳线)和看跌(阴线)蜡烛。
其主要目的是通过独特的颜色直观地突出显示当天的特定蜡烛(特别是在 8 小时、4 小时等较大时间周期图表上的每日首根蜡烛),从而帮助交易者快速识别日内形态或基于交易时段的市场行为。
核心功能
每日循环逻辑:在“每日 N 根蜡烛”的图表设置下(例如 8 小时周期对应每日 3 根蜡烛),该指标为每根蜡烛分配一个位置编号(0、1、2……然后次日循环)。
看涨/看跌区分:针对循环中的每个位置,根据蜡烛是看涨(收盘价 ≥ 开盘价)还是看跌(收盘价 < 开盘价),使用不同的颜色进行标识。
完美叠加:采用原生的 `DRAW_COLOR_CANDLES` 绘图样式。这意味着着色蜡烛直接绘制在实际价格蜡烛之上,实现像素级的精准对齐——无需创建额外对象,不存在重绘(repainting)问
FREE

Know exactly when the market is active. Session Map displays the major Forex trading sessions directly on your chart and in a live panel.
WHAT IT SHOWS ON THE CHART: - Colored background boxes for each session: Tokyo (blue), London (green), New York (orange) - London and New York overlap highlighted in yellow — the most volatile period of the day - Draws the last 3 days automatically so you can compare session behavior
WHAT THE PANEL SHOWS: - Live server time clock updated every second - Stat
FREE

Short Description Yesterday H/L, Today H/L and ADR% on any chart. Color-coded gradient signals overextension at a glance. Full Description Mattrix Day Levels is a clean, lightweight indicator that displays the four key reference levels every day trader needs: Yesterday High and Low (YH, YL) Today High and Low (TH, TL) Average Daily Range percentage (ADR%) Drawn directly on the chart, the indicator marks the current trading day's progression against its historical range. The today range is shown
FREE
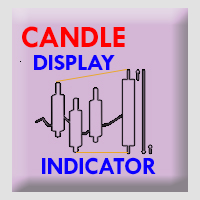
Timeframe Simulator Indicator This indicator redraws candlestick structures from a higher timeframe onto your current chart. It helps visualize higher-period price action without switching timeframes, making it easier to analyze trends and key levels while trading on lower timeframes. Main features: Customizable Candles – Adjust the appearance of higher timeframe candles (bull/bear colors, wick style, gaps, and history length). Higher Timeframe Lines – Optionally display dynamic high, low,
FREE

The MT5 K-Line Countdown Indicator is a professional and lightweight utility for MetaTrader 5. It displays the remaining time before the current candlestick closes, helping traders accurately manage entries, exits, and price action strategies. There are even better indicators—get them here. https://www.mql5.com/en/users/aa996a/seller Features: Accurate Real-Time Countdown
Powered by both OnCalculate() and 1-second OnTimer() technology, the countdown continues smoothly even during low-volatility
FREE

考拉趋势线升级到1.2版
上一次升级改进:添加了新参数,允许用户将趋势线连接到第二或第三或第X最高或最低点。
我的请求 :
**尊敬的客户,请在Koala趋势线上发布您的评论,让我通过您的反馈进行改进。
为什么科拉趋势线是免费指示器?
我相信免费指标必须是合格的工具。
关于其他免费产品呢?
所有带有绿色考拉徽标的产品都是我的免费产品
https://www.mql5.com/zh-CN/users/ashkan.nikrou/seller#products
考拉趋势线介绍:
我做了这个指标来帮助交易者更好地找到趋势,该指标可以显示当前趋势线。
如您所知,趋势线必须在2个最高点或最低点之间绘制。
因此,主要逻辑是找到最高和最低点。
指标查找历史上所有最高和最低点,并用红色和蓝色点显示它们。
这些最高和最低点是根据深度值计算的。深度值可调,用户可以更改。
深度是什么意思?
当深度为10时,表示每个最高蜡烛必须在其周围的10支蜡烛之间最高,必须在前5个蜡烛与下一个5个蜡烛之间为最高蜡烛。
当深度为10时,表示每个最低蜡烛必须在其周围的10支蜡烛之间最低,必
FREE

LZ Candle Timer displays the remaining time before the current bar closes and a new bar forms. It helps you manage entries and exits around candle closes. The indicator uses server time, updates every second, and is optimized for smooth display with minimal CPU use.
Feature highlights
- Selectable location: place the timer in any of the four chart corners (Upper Left, Upper Right, Lower Left, Lower Right). Offsets and padding are configurable. - Alarm colour: when fewer than X seconds remain
FREE
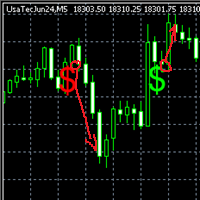
"介绍NakaTrend:您在MetaTrader 5中的终极趋势检测器!
准备彻底改变您的交易体验了吗?来看看NakaTrend,您在精确和轻松识别趋势变化方面的首选指标。
有了NakaTrend,您将不会错过任何利用市场变化的机会。当出现看涨趋势时,NakaTrend会用绿色美元符号来表示,提示您进入买单。当趋势转为看跌时,会出现红色美元符号,表明这是放空的完美时机。
但这还不是全部- NakaTrend赋予您掌控交易的能力,允许手动下单。您的直觉与NakaTrend的见解相结合,将带领您取得有利的结果。
那些依赖猜测或过时指标的日子已经一去不复返了。NakaTrend利用先进的算法为您提供清晰、可操作的信号,您可以信任。
由于NakaTrend直接在MetaTrader 5中运行,将其集成到您的交易例程中是顺畅且无需麻烦的。只需安装NakaTrend,您将立即获得其强大的功能和功能。
但请记住,成功的交易不仅仅是进入交易-还包括知道何时退出。NakaTrend将这一决定留给您,让您可以根据自己的风险偏好和市场情况管理交易。
为了充分利用NakaTrend,请确保您
FREE

NIKA QUANT ANALYZER — MT5策略测试器专业优化分析工具
停止猜测哪些优化结果是真实的,哪些是过度拟合的陷阱。
Nika Quant Analyzer读取MT5策略测试器XML导出文件,利用QM+评分即时对每个参数组合进行排名——一个融合了盈利因子、夏普比率、恢复因子、最大回撤、Return/DD和交易数量的综合指标。
现已支持多文件全局排名:放入多个XML文件,分析器将所有参数组合合并为跨品种和时间周期的统一排行榜。
主要功能
- QM+综合评分 — 一个数字做决策。可调权重公式。 - 多文件全局排名 — 加载多个XML,所有参数组合合并为一个排行榜。切换GLOBAL RANK和BY FILE模式。 - 品种和时间周期显示 — 每行显示该参数组合的品种和时间周期。 - QM分布直方图 — 对数尺度直方图,按质量等级(弱/中/强/精英)展示分布。 - 权益走势图 — 每行内嵌入小型权益曲线。 - 双页指标面板 — 第1页:PF、Sharpe、DD%、交易次数、RF。第2页:一致性分数、R2平滑度、收益%、RetDD、自定义标准。 - 鲁棒性检测 — RO
FREE

El indicador técnico Trend Magic es una herramienta de análisis de tendencias que combina el Índice de Canal de Mercancía (CCI) y el Rango Verdadero Medio (ATR) para identificar la dirección de la tendencia del mercado. Aquí tienes un resumen de sus pros y contras, así como las mejores condiciones del mercado para su uso:
Pros: - Identificación clara de la tendencia: Cambia de color para indicar tendencias alcistas (azul) y bajistas (rojo), lo que facilita la visualización de la dirección del
FREE

用三种颜色查看每根K线的波动率对这个市场来说是低、中还是高。No repaint。
任何货币对、任何周期、任何市场。2分钟即可加载到您的图表。可在策略测试器(Strategy Tester)中免费测试。
Get more indicators here
Baselines, volatility filters and oscillators. No repaint.
为什么您需要它 同样的波幅在不同市场、不同时间含义不同。您看着最后一根K线,却无法判断它的波幅对当前这个市场来说是大还是小。手动设置的固定平均真实波幅(ATR)水平,一旦波动率变化就会过时。您在平静的市场和快速的市场里放同样的止损,市场会让您为这个差别付出代价。 您将获得 Fabii Atr Volatility Zones 按波动率区间给每根K线着色,让您不再凭肉眼判断行情的大小。 三个区间三种颜色,灰色代表低波动,黄色代表中波动,绿色代表高波动,一眼读懂市场。 区间来自市场自身历史的滚动百分位,您无需手动设置水平,同一套参数适用于任何货币对、指数、金属、加密货币或股票。 每根K线的波幅除以快慢两条ATR基准之和
FREE

Fractal3K Pro – 高精度顶底分型指标 简短描述:
Fractal3K Pro 是一款基于三K分型结构设计的专业交易指标,可自动识别市场顶分型和底分型,提供买卖信号的可视化提示,适合短线与中长线交易。 完整描述:
Fractal3K Pro 是一款专为捕捉市场关键反转点而开发的高精度顶底分型指标,基于三根K线分型结构,可自动识别顶分型(卖出信号)与底分型(买入信号)。指标提供可选严格模式(Strict Mode),有效过滤震荡市场的噪音,提高信号可靠性。同时支持D线触发模式,使信号在非重绘条件下更加稳定,适合结合EA自动交易使用。图表上使用红色和蓝色箭头直观显示买卖点,用户无需手动判断即可清晰捕捉交易机会。Fractal3K Pro 适用于黄金(XAUUSD)、外汇、指数以及加密货币市场,可帮助交易者优化入场与出场时机,提高交易决策的准确性与效率。该指标界面简洁,操作方便,适合新手和专业交易者使用,是一款功能全面、稳定可靠的专业交易工具。 功能亮点: 自动识别顶分型与底分型 可选严格模式,过滤震荡信号 可选D线触发模式,信号无重绘 图表上箭头提示买卖点 支持黄金、外汇、
FREE

Volume Profile Indicator – User Guide Description: The Volume Profile Indicator is a powerful tool designed for MetaTrader 5. It visualizes market activity using volume distribution across price levels, showing: Histogram of volume at each price bin POC (Point of Control) – the price with the highest traded volume Value Area – the range covering a configurable percentage of volume (e.g. 70%) Support levels: Min, Max, and Pivot Average tick size for BUY and SELL movements Inputs and Parameters:
FREE
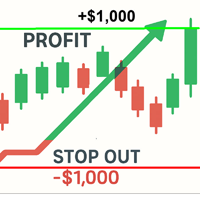
I s a professional visual radar for your trading account. The indicator calculates and displays the key mathematical levels of your open positions directly on the chart in real-time (fully accounting for commissions and swaps). No more blind spots or mental math: you will clearly see exactly where your desired profit will be reached and where the broker will forcefully close your account. Key Features Complete Margin Level Map: Automatic calculation and drawing of Margin Call, Stop Out, "Loc
FREE

5 & 6 CANDLE PATTERN SCANNER DASHBOARD PRO MT5 Ultimate Multi-Symbol & Multi-Timeframe Price Action Scanner with Built-in ATR Risk Engine & 17 Quantitative Confluence Filters
PRODUCT SPECIFICATION Product Type: Quantitative Technical Indicator & Market Scanner Operating Framework: Non-Repainting Price Action Exhaustion & Breakout Engine Platform Compatibility: MetaTrader 5 (MT5 64-bit Architecture, Build 3800+) Asset
FREE

Price Action 6 Pattern Pro 是一款适用于 MetaTrader 5 的技术分析指标,可在图表上自动识别并显示六种经典 Price Action 价格行为形态。 该指标用于市场分析。它不会自动开仓、修改订单或平仓。信号基于已确认的价格结构生成,并可通过箭头、文字标签以及可选的形态结构图形直接显示在图表上。 指标支持以下六种形态: Inside Bar Breakout Outside Bar Pivot Point Reversal(PPR) Move-Congestion-Move(MCM) 1-2-3 Reversal 2B Reversal 所有信号均基于 已收盘 K 线 进行判断。 主要功能 一个指标内集成 6 种 Price Action 模型 分别识别多头和空头信号 基于已收盘 K 线确认信号 图表内交互式控制面板 每种形态可独立开启或关闭 全局 BULL / BEAR 方向过滤 Confluence 共振模式 每种形态的信号计数 显示最近一次检测到的信号 可选的形态结构可视化 三种标签显示模式:OFF、RECENT、ALL 弹窗、Push 和 Em
FREE

The MACD Overlay Pro brings the classic Moving Average Convergence Divergence (MACD) indicator directly onto your main price chart . By plotting the MACD Line, Signal Line, and an additional trend-confirming SMA directly over price candles, this tool eliminates the need to constantly glance at a separate indicator window, allowing for more focused technical analysis . Designed for clean visualization, this indicator uses dynamic color-coding to highlight trend direction and a semi-transparent fi
FREE

The MultiFrameRSIIndicator is a powerful MetaTrader 5 (MT5) indicator that leverages the Relative Strength Index (RSI) to analyze trends across multiple timeframes. This indicator synchronizes RSI-based trend signals from up to nine timeframes (M1, M5, M15, M30, H1, H4, D1, W1, MN1) and presents them with clear visual feedback, including a colored RSI line, signal arrows, and a customizable dashboard. Ideal for traders seeking momentum-based trend confirmation. Features Multi-Timeframe Analysis
FREE

MQL5 Market Description - PragmAlgo Position Size Calculator PragmAlgo Position Size & Risk Architecture Calculator Category: Indicators / Utilities / Risk Management / Lot Size Calculation
Platform: MetaTrader 5 (MT5 Desktop)
Supported Assets: 100% Multi-Asset (Forex majors & crosses, Gold XAUUSD, US Indices US30 / NAS100, DAX GER40, Crypto BTCUSD / ETHUSD, and Commodities)
Timeframes: All Timeframes (M1 to Monthly — Optimized for scalping, day trading, and swing trading)
License: 100% Free (Es
FREE

【ZhiBiDW Trend】是一款简单、直观、有效的趋势和震荡的指标。它适合用在15分钟以上并且4小时以下的图表周期,适合所有市场品种。 Buy signal:出现蓝色向上箭头;箭头出现后会附带止损和止盈的预设价格。 Sell signal:出现红色向下箭头;箭头出现后会附带止损和止盈的预设价格。 参数设置说明: 【Send_Alert】:这是警报开关,设置成true,如果出现箭头就会自动警报提示;设置成false,则不会警报提示。 【Send_Email】:这是发送邮件的开关,设置成true,如果出现箭头就会发送邮件到你在MT4设置好的邮箱里面;设置成false,则不会发邮件。 【Send_Notification】:这是发送即时消息的开关,设置成true,如果出现箭头就会发送消息到你的移动设备;设置成false,则不会发消息。 更多好用的指标网址: https://www.mql5.com/en/users/zhengqiuyang/seller
FREE
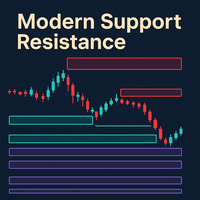
Dynamic S/R indicator that creates zones from fast/slow fractals, merges them if they overlap, classifies them (Possible, Untested, Verified, Turncoat, Weak), highlights the one closest to current price, and sends alerts when price enters the area. It supports testing mode, visual themes, zone extension/merge, global variables for EA integration, optional display of broken zones, and an adaptive ATR-based fuzz filter (with automatic fallback).
My indicators for free. I only ask that leave your
FREE

AlligatorPro Signal A non-repainting Alligator + Awesome Oscillator + ADX signal indicator with multi-channel alerts. Overview AlligatorPro Signal scans price action using Bill Williams' Alligator combined with the Awesome Oscillator and ADX trend filter, and marks confirmed entry points directly on the chart with arrows — green for buy, red for sell. No trades are placed; this is a pure signal/alert tool you can use manually or alongside your own execution method. All signals are evaluated on c
FREE
GridLinesX is a lightweight and efficient utility for MetaTrader 5 designed to help traders visualize price levels with precision. Whether you are a Grid Trader, a Scalper, or simply need to mark psychological price levels, GridLinesX automates the process instantly. Forget about drawing manual horizontal lines one by one. Simply define your High/Low range and the grid step (in points), and the tool will generate a clean, customizable grid overlay on your chart. Key Features: Customizable Range:
FREE
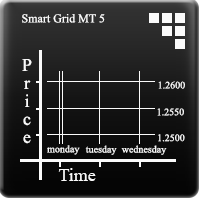
Smart Grid MT5 automatically recognizes any symbol, period and scale of the chart and marks it up accordingly. It is possible to mark up the chart by trading sessions. The grid consists of the two main line types.
Vertical lines There are two visualization methods: Standard - the lines are divided into three types, separating: Small time period. Medium time period. Large time period. Trading Session - the lines are divided into groups (a total of ten). Each group has two lines: the first is res
FREE
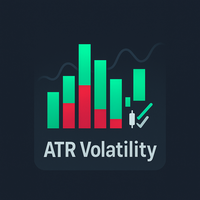
MT5 ATR波动率柱状图指标 – 技术型波动率分析 该指标计算并显示快ATR与慢ATR之间的差值,并以柱状图形式呈现,从而能够实时可视化市场波动率的变化。 计算方法
波动率差值 = 快ATR - 慢ATR 解读 正值(绿色柱)表示波动率上升,可用于确认突破动能。 负值(红色柱)表示波动率下降,可能意味着盘整或动能减弱。 应用场景 当价格突破过程中波动率增加时,用于确认突破。 当动能变化伴随绿色柱出现时,用于支持看涨或看跌反转信号。 当价格创出新高或新低而柱状图未出现相应的绿色增加时,识别潜在的背离。 与K线形态或价格行为模式结合使用,筛选出具有强波动率支撑的交易形态。 推荐配套工具
本指标可与“蜡烛图形态识别”工具结合使用:
https://www.mql5.com/en/market/product/145419 输入参数 快ATR周期 慢ATR周期 柱状图颜色和样式 说明
该指标适用于交易终端中任何可用品种,可运行在日内、日线及更高时间周期上。
既可单独使用,也可与其他技术工具配合使用以确认信号。 关键词
ATR波动率柱状图, 波动率指标, 快ATR, 慢ATR, 趋势
FREE

Price Sessions is an exclusive MetaTrader 5 indicator that integrates symbol information and trading sessions into your chart. It does not link to any account information or external sources, ensuring user safety. Main Features: 1. Symbol Information Current Symbol Live Price Live Spread 2. Trading Sessions (Time zone UTC/GMT+0) Tokyo session London session New York session If you find this utility helpful, please rate it. If you encounter any issues or have suggestions, pleas
FREE

Please feel free to join this Telegram group where users can share their strategies and settings that work for them using this indicator --> t.me/MTFMACS
ALSO AVAILABLE ON TRADINGVIEW The MTFMACS family is now available on TradingView for users who prefer charting on that platform. Contact me via the Telegram group for direct access. ABOUT THIS FREE VERSION
Th
FREE

免费 — Donchian 突破通道、SMA 趋势过滤器,以及管理交易的 ATR 移动止损,汇聚于一图。针对主流加密货币(BTC、ETH)调校。
完全免费,无任何限制。如果它在您的图表上派上用场,一条简短的评价对我们帮助最大——只需30秒,这也是其他交易者发现这款工具的唯一途径。
平台: MetaTrader 5(本页面)。MetaTrader 4 版本: https://www.mql5.com/en/market/product/185645
加密货币会以漫长而干净的行情推进,然后剧烈震荡。原始的突破指标在两种情形下都会触发。本指标只有在突破同时与长期 SMA 一致时才标记它——这正是趋势型加密 EA 避免在区间内假突破时买入的方式。
=== 它绘制什么 ===
- 最近 N 根已收盘 K 线的 Donchian 通道(上轨与下轨)。
- 趋势 SMA(默认 200)。
- 金色箭头,标记在某根 K 线收盘突破通道且位于 SMA 正确一侧之处——趋势系统真正会采取的那个突破。
=== 不重绘 ===
通道与 SMA 均基于已收盘 K 线读取,突破则依据上一根 K 线的收
FREE

DQN USDJPY 是一个基于神经网络的 MetaTrader 5 交易指标,用于分析 USDJPY 市场并在图表上显示 BUY 和 SELL 信号。 该指标使用 Deep Q-Network (DQN) 强化学习模型,并通过历史价格数据进行训练。 模型逻辑 模型基于六种交易策略进行训练: 动量策略
趋势策略
Multi-RSI 策略
突破策略
均值回归策略
无信号状态 系统会根据当前市场条件自动选择最合适的策略。 指标流程 特征提取
使用多个技术指标分析市场。 市场分析
DQN 模型评估当前市场结构。 策略选择
算法选择最适合当前市场环境的策略。 信号生成
当条件满足时,指标会显示 BUY 或 SELL 信号。 所有信号在K线收盘后确认。 推荐设置 交易品种:USDJPY
时间周期:H4 其他可用版本 该指标针对其他货币对和时间周期(EURUSD、GBPUSD、GBPJPY、USDJPY M15)的优化版本,以及相应的智能交易系统(EA),均可在我的 MQL5 个人资料中获取。 风险提示 金融市场交易存在风险。本指标仅作为分析工具。
FREE

Support Resistance Channels Advanced is a MetaTrader 5 indicator that finds the strongest support and resistance from pivot points and draws them as channels (zones) rather than single lines, which better reflects how price reacts to areas. Features Automatic level detection: identifies pivot highs and lows and ranks the strongest current levels. Zone-based levels: shows support and resistance as channels, not thin lines, matching how price actually reacts. Cleaner reading: focuses on the most s
FREE

The Zero Lag MACD Enhanced v1.2 (Pro Edition) is an advanced momentum indicator developed to address one of the most persistent limitations of traditional MACD—lag. By applying a double-smoothed Zero Lag EMA structure , the indicator significantly improves responsiveness while maintaining analytical stability. This tool is particularly effective in high-volatility markets , where timing precision is critical. Whether trading major forex pairs, commodities, or cryptocurrencies, the indicator prov
FREE

This is our version of the Bull Market Support Band indicator.
This indicator contains two moving averages: one simple and one exponential. Together, they represent a support band that can be used in both bull and bear markets.
Although originally designed for the weekly chart, it can be used on any timeframe.
Our version adds a candle coloring rule: green for closes above the band and red for closes below.
The default value is 20 for the Simple Moving Average (SMA) and 21 for the Exponentia
FREE

Indicator Description
This indicator draws red-border rectangles during specific daily ICT Kill Zones (EST): 3:00 – 4:00 AM EST 10:00 – 11:00 AM EST 2:00 – 3:00 PM EST During each active time window, the indicator automatically creates rectangles and highlights Fair Value Gaps (FVGs) formed shortly before and during the selected Kill Zones, including recent prior FVGs for additional confluence. The Kill Zones are designed according to ICT (Inner Circle Trader) concepts and can be used as a c
FREE

Quantora Fair Value Gap Pro MT5 is a MetaTrader 5 indicator that detects bullish and bearish Fair Value Gap zones created by price imbalances. Detected zones are displayed on the chart and can be extended until the selected mitigation condition is met. The indicator tracks active, mitigated and fully filled zones according to its input settings. Fair Value Gap Detection Bullish and bearish Fair Value Gap detection Active, mitigated and fully filled zone tracking First Touch and Full Fill mitigat
FREE

Four pivot methods, three reference periods and labels that stay where you place them. BrioQuant Pivot Points plots Classic, Fibonacci, Camarilla or Woodie levels from the previous completed period. Choose Daily, Weekly or Monthly pivots, then place labels at the period start, after the newest candle, in the margin or at the chart edge. Features: Methods: Classic / Fibonacci / Camarilla / Woodie; periods: Daily / Weekly / Monthly Label placement: line start, after the newest candle, centred in t
FREE

Dow+ICT AI Visualizer | 连接AI大脑的钥匙 自动生成道氏拐点数据,让AI帮你分析市场——你的AI交易助理的数据接口
Dow+ICT AI Visualizer 不只是画线工具,更是“数据生成器”:
多品种支持,贵金属(XAU,XAG),原油(XBR,XTI),股指(US500,US100),外汇(EUR,GPD,CHF,JPY,AUD,CAD), 加密货币(BTC,ETH)
多周期支持,M5-M15-M30-H1-H4
自动生成道氏拐点数据(HH/HL/LL/LH序列)
自动整理K线数据(OHLC)
实时更新,保存到数据文件夹
TXT格式直接拷贝贴给AI 您的AI很聪明,但它需要有效的数据 ,
→ 你只需要在你的AI界面新开一个话题并贴入我们设计的提示词,
→ 然后不断更新最新的数据给它,你的AI就能基于道氏结构+ICT策略规则,分析出日内进场点,
这不是“看图说话”,这是“让AI真正理解市场”。
数据存放位置说明 :
您的MT5(桌面版)界面菜单"文件->数据文件夹" 或者快捷方式 "Ctrl+Shift+D"。打开后,继续进
FREE

Session Break Out 指标 – 交易时段分析的终极工具 Session Break Out 指标 是一款先进的工具,旨在帮助交易者监测市场交易时段,并有效利用基于时间的交易策略。专业交易者深知,在外汇市场中,不同交易时段的货币强度和波动性各不相同,时间因素至关重要。 使用此强大指标,您可以:
追踪市场交易时段 – 立即识别当前活跃的交易时段及开放的市场。 监测时段高点和低点 – 关注关键价位,寻找突破或反转机会。 捕捉全新突破 – 当交易时段的高点或低点被突破时,实时收到提醒。 适配任何时区 – 轻松调整指标以匹配您的本地 GMT 设置。 可视化交易时段重叠 – 通过精美的图形界面清晰展示交易时段的转换。 历史交易时段框架 – 轻松开启历史时段显示,回顾市场结构。 即时买入 & 卖出信号 – 突破发生时,屏幕上显示实时提醒和箭头。 为什么选择 Session Break Out 指标? 简单安装 – 只需几秒钟即可轻松设置,无需复杂配置。
用户友好界面 – 直观设计,轻松读取交易时段数据。
强大的交易信号 – 适合希望利用交易时段趋势的交易者。 立即使用 Session
FREE

Volume Zone Analyzer — VSA-Based Volume, Delta & Spread Reader Turn any price zone into a Volume Spread Analysis. Drop two draggable lines on your chart to mark a Zone Start and Zone End , and Volume Zone Analyzer instantly breaks down what happened inside that zone: Total Volume for the selected range Buy / Sell Delta — estimated from where each candle closes within its own high-low range Delta % with a visual buy/sell ratio bar Average Spread , plus a count of wide vs. narrow-spread candles (t
FREE

World Sessions MT5 — See the Global Trading Day Clearly World Sessions MT5 is a professional trading-session indicator designed to help traders visualize the major global market sessions directly on the MetaTrader 5 chart. Sydney, Tokyo, London, and New York sessions are displayed as clean price-range boxes, making it easier to understand when each major session is active, where its price range develops, and how different sessions interact throughout the trading day. The indicator combines sessi
FREE

Pairs Spread ZScore — is a statistical pairs-trading indicator for two correlated instruments. By default it is configured for BTCUSD against ETHUSD, a widely traded crypto pair, but any two correlated symbols available on your broker can be used as the second instrument. How it works The indicator builds a normalized spread between the base symbol and a second symbol (Symbol2) using a rolling lookback window (Period). Both price series are standardized before the spread is calculated, so the
FREE

Plus RSI MA Color — 动态变色趋势线 Plus RSI MA Color 是一款适用于 MetaTrader 5 的趋势视觉指标。它直接在主图表上显示一条经过平滑处理的线,并根据价格走势与其内部参考线之间的关系自动改变颜色。 该指标旨在帮助用户更直观地识别市场的主要方向,以及买方和卖方走势之间可能出现的转换。 工作原理 该指标使用每根K线的加权价格,并综合考虑最高价、最低价和收盘价。随后,该价格经过可调整的平滑处理。 平滑后的线随后与内部指数移动平均线进行比较,该平均线用作方向参考。 该线使用两种颜色: 蓝色: 平滑线等于或高于指数参考线。 橙色: 平滑线低于指数参考线。 颜色变化有助于观察走势方向和近期力量的变化,但不应单独解释为进场或反转的保证。 主要特点 趋势线直接绘制在主图表上。 自动改变颜色。 简单直观的视觉读取。 可调整的平滑设置。 可调整的指数参考线。 优化的增量计算。 兼容不同资产和图表周期。 兼容 MetaTrader 5 可视化测试器。 支持基于真实 Tick 的测试模型。 不执行或管理交易。 不会改变正常交易环境中的图表设置。 可用参数 InpS
FREE

PHSB_顶底 更清晰地观察市场极值与当前市场结构 PHSB_顶底 是一款专为 MetaTrader 5 开发的指标,旨在帮助交易者更加直观地观察 价格在市场区间内的结构 ,突出显示主要极值以及中间参考区域。 除了直观识别 顶部 和 底部 之外,该指标还将其他重要信息整合到同一个界面中,使交易者能够同时观察所分析的价格区间、市场当前所处的位置以及近期K线的表现。 设计理念非常简单: 减少图表上分散的信息,让市场分析拥有更多上下文。 顶部与底部识别 该指标的核心功能是识别所分析区间中的极值位置。 PHSB_顶底 直接在图表上显示: 顶部 ; 底部 ; 区间中线 ; 中间参考区域。 这些水平线会显示在图表上,帮助交易者更加清晰地观察当前价格结构。 用于分析的K线数量可以由用户自行设置。 在一个视图中观察整个市场区间 与只关注当前价格不同,该指标可以让交易者从由市场极值形成的结构中观察当前市场。 这可以帮助交易者直观了解: 当前价格处于区间中的什么位置; 与顶部之间的距离; 与底部之间的距离; 当前结构的中心区域; 可以作为分析参考的中间区域。 指标不会告诉交易者应该采取什么行动
FREE

MA Color Candles Indicator MA Color Candles is an indicator for visually displaying market trends by coloring chart candles. It does not add objects or distort price data, instead coloring real candles based on the state of two moving averages. This enables quick trend assessment and use as a filter in trading strategies. How It Works Bullish trend: Fast MA above slow MA, slow MA rising (green candles). Bearish trend: Fast MA below slow MA, slow MA falling (red candles). Neutral state: Candles
FREE

This indicator, called the “Moving Average Crossover Suite,” is the classic moving average crossover indicator. It takes into account all types of moving averages available in MQL5. As is well known, this indicator—whether it involves two or three moving averages, of the same or different types—has been extensively discussed in the relevant literature, particularly in *Technical Analysis of the Financial Markets* and *The Visual Investor*, both by John Murphy. First, it should be noted that the
FREE
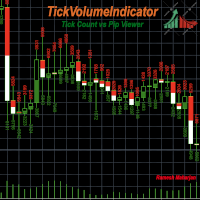
有多种指标和方法可用于识别图表中的趋势。TickVolumeIndicator 就是其中之一。它通过使用逐笔报价数据显示过去的趋势,帮助您识别和预测未来趋势。
TickVolumeIndicator 是一种使用逐笔报价交易量为图表中可见的 K 线图绘制颜色的指标。逐笔报价交易量指的是买入价和卖出价。用户可以选择逐笔报价的买入价和卖出价计数,或 K 线图时间范围内的点差变化。当卖出价大于之前的卖出价时,会添加卖出价计数;当买入价小于之前的买入价时,会添加买入价,两者均根据 K 线图高度进行标准化,以便在图表中显示。点差变化的计算方式相同。
用户有以下选项:
1) 卖出价颜色:用户可以选择红色、绿色、蓝色、紫色、黄色、青色、紫红色、棕色、橙色、粉色、白色或无作为卖出价颜色。默认为绿色。
2) 买入价颜色:用户可以选择红色、绿色、蓝色、紫色、黄色、青色、深紫色、棕色、橙色、粉色、白色、无作为买入价颜色。默认为红色。
3) 点数 vs 点数:用户可以选择显示点数颜色或点数变化颜色。默认为点数。
4) 边框类型:用户可以选择扁平、凸起和非动态指针作为边框类型。默认为凸起。
5)
FREE

LongTerm 是一种方向性分析指标,旨在解读中长期趋势的力量和质量,并特别专注于 long oriented 分析。 它不是入场指标,也不是操作时机工具,而是一种帮助交易者理解市场何时为 long trend 提供有利或不利条件的工具,同时减少短期波动中典型的噪音。 目标
LongTerm 旨在: 识别强劲且结构化的 long trends 区分扩张、放缓和衰竭阶段 提供对主导方向性背景的清晰解读 它是面向 swing trading 和 long term 分析的交易者的理想工具。 颜色和市场条件的解读
LongTerm 使用一种颜色结构,旨在立即读取 long trend 的不同阶段,清楚地突出市场的最佳和最差条件。 绿色线 正向倾斜并位于蓝色线之上
这种配置代表最佳条件。 Long trend 强劲、稳定且结构良好 运动显示连续性和方向性 市场处于趋势扩张阶段 这是中长期 long 分析最有利的背景。 黄色或橙色线 位于蓝色线之上
表示市场仍然偏向 long,但处于放缓或逐步衰竭阶段。 主要方向仍然是上涨 趋势推动力减弱 运动变得不那么高效 这一阶段是成熟趋势的典型阶段,在这
FREE

免费 — 在日内图表上以高低点方框标出东京、伦敦、纽约三大交易时段,让您一眼看出当前是哪个市场在推动价格。
100% 免费,无任何限制。如果这个工具在您的图表上占有一席之地,一条简短的评价就是对我们最大的帮助 — 只需 30 秒,也是让其他交易者发现这个工具的关键。
平台: 仅限 MetaTrader 5 — 没有 MetaTrader 4 版本。
=== 绘制内容 ===
- 每个时段每天一个方框: 方框覆盖该时段的时间范围及其精确的高低点区间。
- 东京(默认钢蓝色)、伦敦(默认海绿色)、纽约(默认印度红)。
- 默认绘制最近 15 天,可通过 InpDaysBack 调整。
- 每个时段可单独开关; 方框可填充或仅显示边框。
- 当前时段的方框随最新K线实时延伸; 每根K线只重绘一次,图表保持轻量。
=== 交易者为何使用 ===
时段结构是日内交易背景的一半: 东京区间往往成为伦敦突破的箱体,而伦敦/纽约重叠时段集中了一天中大部分的波动。一次看到 15 天的时段方框,也能清楚地看出哪些时段真正推动您的品种 — 哪些时段可以直接跳过。
=== 参数设置 ===
- In
FREE

ApexForge KTimer MT5 K 棒倒數、市場收盤倒數、假日與提前收盤處理、可拖動計時面板 ApexForge KTimer 是一款為 MetaTrader 5 設計的時間與市場狀態工具。 KTimer 可以在圖表上顯示目前 K 棒的剩餘時間,同時提供市場收盤時間倒數、市場狀態、假日與提前收盤處理。 計時面板可以自由拖動並記憶位置,也可以選擇完整面板或純文字顯示方式。產品適合單圖表以及多圖表、多週期的 MetaTrader 5 工作區。 K 棒倒數 KTimer 會顯示目前 K 棒距離收盤的剩餘時間,並自動依照目前圖表週期計算。 支援 MetaTrader 5 可使用的圖表週期,例如 M1、M5、M15、M30、H1、H4、D1 等。 這項功能可用於需要觀察 K 棒收盤時間的交易方式,例如等待 K 棒收盤後再確認交易條件。 市場收盤倒數 除了 K 棒倒數之外,KTimer 也可以顯示目前交易時段距離預定收盤的剩餘時間。 這項資訊可以用於一般每日交易時段、週末休市前、假日以及提前收盤交易日。 在正常交易期間,已確認的交易時段收盤資訊會適當快取,避免重複處理沒有變化的資料。市場
FREE
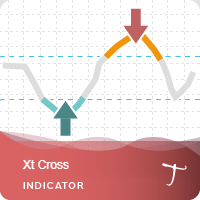
Xt Cross是著名的 TS /MT 指标的端口, 是一种具有动态超买和超卖水平的振荡器,而在标准 Stochastic Oscillator 中,这些水平是静态的并且不会改变。 这使得 Xt Cross 能够适应不断变化的市场。
当振荡器高于超买带(红线)并向下穿过信号(虚线)时,通常是一个很好的卖出信号。 同样,当震荡指标在超卖带(绿线)下方穿过信号上方时,这是一个很好的买入信号。 Xt Cross 非常适合交易货币(包括加密货币)和二元期权. Xt Cross 的优势 该指标适用于剥头皮交易和日内交易。 可以评估指标对历史的有效性。 指标不会重新绘制(重新计算),信号严格在“柱线收盘价”时生成。 它可以用作独立工具或与其他指标一起使用。 新指标信号的电子邮件和移动设备通知系统。 能够自定义指标的配色方案。
FREE
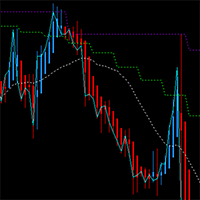
This MT5 chart trend checker cuts through the noise of market volatility to provide a clearer picture of trends and price movements. It includes the following features that can provide more clarity during market assessments: 1 customizable multi-period moving average Optional Heikin-Ashi candles 3 switchable focus modes Distinct colors for easy analysis
Link to MT4 version: https://www.mql5.com/en/market/product/106708/
This indicator shows your preferred moving average from multiple time fram
FREE

Mini Charts MTF EMA Mini Charts MTF EMA is a MetaTrader 5 indicator that displays multiple mini charts from selected timeframes directly on the main chart. It helps traders monitor multi-timeframe price movement and EMA direction in one clean visual layout. Main Features Multiple mini charts on the main chart Custom timeframe selection for each mini chart Up to 4 EMA lines for every mini chart Custom EMA period, shift, method, applied price, color, style, and width Custom mini chart width, heigh
FREE

IMR is a multi-layered quantitative reversal finder designed for discretionary price-action traders who refuse to trade blind. It does not generate entry signals, nor does it draw buy/sell arrows. Instead, it answers the three questions that matter most before you ever place a limit order: What is the market's statistical DNA right now? (Hurst Exponent) Is the current move backed by genuine strength, or is it exhausted? (ADX) Has price moved too far, too fast, with too much conviction — suggest
FREE

KS Triple EMA —— 简介与功能
概览
KS Triple EMA 是一款界面简洁、高度可定制的“三重移动平均线”指标,专为 MetaTrader 5 平台设计。它可在主图表上绘制多达三条独立的移动平均线(分为快线、中线和慢线),并辅以专业的视觉呈现效果及动态标签显示。
尽管该指标的文件名显示为“Tripple”,但在程序内部,其正式名称实为 KS ThreeMA 或 KS 3MA。 核心功能
功能 | 描述
---|---
三条独立移动平均线 (MA) | 包含快线、中线和慢线,每条线均拥有完全独立的设置。
全面自定义 | 每条 MA 线均可独立设置周期、计算方法、价格类型、颜色、线条样式及粗细。
动态末端标签 | 自动在每条 MA 线的末端放置清晰易读的标签。
启用/禁用 | 可对每条 MA 线进行独立的开启/关闭控制。
多重实例 | 可在同一图表上安全地加载多个副本(通过独特的对象命名机制实现)。
详细输入参数
1. 快线 MA 设置区
启用 / 禁用
周期(默认值:10)
计算方法:SMA(简单移动平均)、EMA(指数移动平均)、SMMA(平滑移动
FREE

一根大实体蜡烛收盘。看起来像突破。您入场。
下一根K线反转,触发了您的止损。成交量只是平均水平。动能早已衰减。
Impulse Momentum Shift 识别具有真实冲量的K线,并标记冲量反转的时刻。 大多数交易者只看蜡烛大小。真正的冲量由三个因素构成:实体主导性、成交量突破近期均值、以及经ATR标准化的方向性动能。 本指标对每根K线进行三维评分,以5色冲量色阶绘制图表,并在强冲量阶段反转方向的瞬间放置转变箭头——仅在已收盘的K线上触发。 显示内容: 5色冲量K线: 亮蓝色代表强烈看涨冲量,浅蓝色代表适中,灰色代表中性,珊瑚色代表适中看跌,深红色代表强烈看跌。每根K线实时评分0–100 冲量追踪线: 基于ATR的动态追踪线,随主导冲量方向棘轮式移动。趋势结构转变时变色,作为视觉偏向锚点 动能转变箭头: 仅在确认的冲量K线序列反转后触发。无重绘。信号仅出现在完全收盘的K线上 状态标签: 实时显示当前状态——IMPULSE BUY、MODERATE SELL、LOW MOMENTUM——以及百分比评分和追踪线方向 K线倒计时计时器: 当前K线收盘前的剩余时间,显示在图表上 冲量评分机制
FREE

APICT Smart Trendline and Pattern Tool APICT Trendline + Pattern Indicator is a powerful all-in-one technical analysis tool designed to automatically identify market structure, draw dynamic support and resistance trendlines, and detect high-probability chart patterns in real time. Smart Trendline Detection The indicator automatically draws major and minor trendlines , clearly marking key support and resistance levels based on market structure. Separate controls for major and minor trends Adju
FREE

这是免费产品,欢迎您使用以满足您的需求!
如果您喜欢这个指标,请留下简短的好评!非常感谢! .............................................................. 点击这里查看高质量的交易机器人和指标! ......................................................... MT5 外汇指标价差显示,出色的辅助交易工具。 ......................................................... - 价差显示指标显示其所附外汇对的当前价差。 - 可以在图表的任何角落找到价差显示值. - 也可以设置颜色和字体大小。 这是仅在此 MQL5 网站上提供的原创产品
FREE

RBM Nasdaq Liquidity Hunter
Institutional Liquidity Indicator for Nasdaq
RBM Nasdaq Liquidity Hunter is an advanced liquidity analysis tool developed for Nasdaq traders who want to identify institutional liquidity events with greater precision.
Instead of highlighting every breakout, the indicator filters market noise and identifies only liquidity sweeps confirmed by volume, trend, and multiple institutional confluence factors. Every detected event is evaluated through a proprietary scoring
FREE

轻松在图表上绘制进场价、止盈和止损水平,用于分析和跟踪交易信号。 兼容 MetaTrader 4 和 MetaTrader 5,在 Market 上作为独立产品出售。 主要功能 轻松输入进场价、TP1、TP2、TP3 和 SL 值 可选的垂直线用于标记信号时间 每条线支持自定义标签和颜色 直观评估信号的准确性与风险回报比 适用于所有品种和所有时间周期 无重绘、无延迟,线条清晰稳定 应用场景 可视化来自 Telegram、WhatsApp 或其他渠道的交易信号 分析历史信号并学习市场反应 向社群或客户展示清晰的信号布局 搭配手动或自动策略使用 关键词 signal , draw lines , entry , take profit , stop loss , forex , visual signals , manual trading , signal analysis , TP , SL , chart , levels , evaluation , education , indicator , tool
FREE

我们的指标将提供一个价差筛选器来同时监控多对的价差,并且蜡烛计时器倒计时显示当前柱关闭和新柱形成之前的剩余时间。
限时优惠:我们所有的溢价指标仅售 50 美元,通过访问我们的 MQL5 博客,您将找到我们溢价指标的所有详细信息。 点击这里。
主要特征 我们的指标将提供一个价差筛选器来同时监控多对的价差,并且蜡烛计时器倒计时显示当前柱关闭和新柱形成之前的剩余时间。
监控多对同时传播。 跟踪服务器时间,而不是本地时间。 可配置的文本颜色和字体大小 优化以减少 CPU 使用率 个性化的配对列表。
接触 如果您有任何问题或需要帮助,请通过私信联系我。
警告 警告 我们所有的指标和工具只能通过官方 Metatrader 商店 (MQL5 市场) 获得。
作者 SAYADI ACHREF,金融科技软件工程师和 Finansya 创始人
FREE

Master Waves for MetaTrader 5 说明 Master Waves 是一款为 MetaTrader 5 开发的技术指标,用于将成交量按照价格运动方向组织成不同的波段。 该指标分析每根K线的方向,并在价格保持相同方向运动时持续累积成交量。当方向发生变化时,开始计算新的波段。 波段以柱状图形式显示在独立的指标窗口中。上涨和下跌方向的波段使用不同颜色显示,以便进行直观分析。 波段分析 当前波段的成交量会与之前波段的平均成交量进行比较。通过这种比较,可以观察每次价格运动在所分析历史中的相对强度。 指标优先使用可用的 Tick Volume。在需要时,会使用交易品种提供的 Volume 作为替代。 Score 和 State Master Waves 根据当前波段成交量与之前波段平均值之间的关系,在内部计算从负 100 到正 100 的 Score。 正值代表上涨方向的运动,负值代表下跌方向的运动。指标还会计算 State,将当前状态分类为正向,负向或中性。 参数 InpAvgWaves
定义计算参考平均值时使用的之前波段数量。 使用方法 Master Waves 可作为
FREE

The indicator displays volume profiles based on the nesting principle. Profiles periods are pre-set so that each subsequent profile has a length twice as long as the length of the previous profile. In addition to profiles, the indicator displays volume clusters sorted by color, depending on the volume they contain.
Indicator operation features The indicator works on typical timeframes from M5 to MN, but for calculations uses historical data from smaller timeframes: M1 - for timeframes from M5
FREE

The Top and Bottom Identifier Pro is the essential tool for traders who use technical analysis and price action as the basis for their decisions. In MetaTrader 5, understanding market structure—whether the price is making higher or lower highs and lower lows—is the first step to success. This indicator automates this process, eliminating subjectivity and allowing you to visualize price inflection points with immediate clarity.
FREE
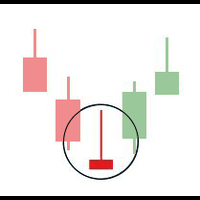
Basing Candles indicator is an automatic indicator that detects and marks basing candles on the chart. A basing candle is a candle with body length less than 50% of its high-low range. A basing candle or basing candlestick is a trading indicator whose body length is less than half of its range between the highs and lows. That's less than 50% of its range.
The indicator highlights the basing candles using custom candles directly in the main chart of the platform. The percentage criterion can be
FREE
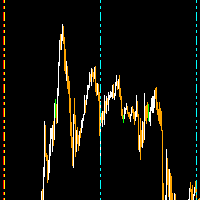
The daily custom period seperator indicator allows you to draw period seperators for your lower time frame charts H1 and below. The period seperator gives you options to set different colors for: Weekend - saturday/sunday Monday and Friday Midweek - Tuesday to Thursday.
By default the indicator plots the period seperator line at 00:00 hours for the last 10 days.
Use Cases: The indicator can be used as a colourful alternative period seperator to the default MT5 period seperator. For those tha
FREE
MetaTrader市场是一个简单方便的网站,在这里开发者可以出售自己的交易应用程序。
我们将帮助您发布您的产品,并向您解释如何为市场准备您的产品描述。市场上所有的应用程序都是加密保护并且只能在买家的电脑上运行。非法拷贝是不可能的。
