
指标和提醒的盈利能力可视化测试

通过这些提醒进行 EA 测试时,通常将决定是使用交易提醒的哪个指标或只是指标计算方式。但是,为每个指标编写一个 EA 并非总是可能/必要/合理的。你可以通过自己收集提醒并绘制理想交易图像的特殊指标,快速计算出基于其他指标提醒的交易盈利能力。这可帮助你既对所得结果进行可视化估计,又快速选择了最优参数。
想起曾有多少次,你在看到随机找到或经过长时间搜索后最终找到的指标时,就想马上知道通过提醒而获得的交易结果。同样情况在你获得还没有 EA 或指标的新交易系统时便会发生。开始重大工作和编写有效 EA 之前,你想要估计出售中的材料是否可带来健康食粮。
或者你会面对如下情况:指标的提醒良好,但是你的直觉告诉你,该指标的参数并非最优,你可以将其清除,你甚至知道清除的方式。如何可以在不被添加到长而复杂的代码中的情况下,快速地测试你的想法呢?
问题陈述
让我们想想我们有什么,我们需要什么。让我们以 MetaTrader 4 的标准交付版本中的著名指标 ZigZag 作为示例。将其附加至任何时间范围内的任何货币对的图表中:你确定要与其进行交易吗?一切都很清楚:你应在高位卖出,并在低位买入以平仓。
现在有个问题:你将从这起交易中获利多少?这个问题的答案很简单:将所有线段的最高价相加,并根据仓位手数和保证金货币的某个点位价格来重新计算。你可以通过调用函数 iCustom来访问 ZigZag 值的缓冲区:
P=iCustom(NULL,0,"ZigZag",0,i);
此处i代表你获取值的柱号。
现在你所需要做的,便是在缓冲区的所有值中进行搜索,并找到所有含非零值的点 - 这些点是用来建立 ZigZag 的。你还需要将线段的最高点相加。出于描写性原因,你甚至可以根据交易颜色及其盈利能力来绘制这些线并为其上色。这是个简单的工作,并可以成功分配给指标。
通用解决方案
为使此指标得以测试任何其他的指标,你应确保其通用性。鉴于在通常情况下任何指标或交易系统都假设只进行 4 种操作:BUY, SELL, BUY CLOSE, 和 SELL CLOSE,我们应让每一种操作拥有专用的数组。必须能够从任何来源填充此数组。这是你唯一需要通过添加填充提醒数组的代码来进行的自我编辑(好吧,你还应将部分参数放入外部变量)。
功能上讲,指标拥有以下程序块:
- 初始化 - 我们在此为提醒数组分派内存并重置计数器;
- 填充提醒数组 - 我们再次通过添加计算提醒或从其他指标接受提醒的多种算法,来进行代码编辑;
- 清除重复提醒 -该程序块为指标提醒瘦身所必需,指标并不以生成一个提醒的离散模式工作,而是以连续模式工作,在该模式中,指标持续确定开仓条件的可利用性,而不是提醒的首次出现(此时订单实际上必须打开)。在程序块中,以下机制将实现:如果两个相同提醒位于相邻柱,则右边的提醒为静止,因为我们认为仅使用在此前(左边)柱已经打开的订单。所有参数内设置的日期范围以外的提醒将同样在此移除;
- 放置 OPEN 和 CLOSE 标记 - 在此程序块中,ZigZag 由“瘦身”(离散)提醒绘制,并已放置垂直线,如有需要,使用包括生成提醒的指标等其他指标的图形追踪提醒的同步;
- 通过放置的标记计算结果 - 打开订单数量及其利润在放置标记的期间进行计算。该程序块进行部分额外计算并将结果作为注释显示在主图表窗口内。
- 辅助函数 - 这里有两个函数:用于放置垂直标记线和绘制 ZigZag 线段的函数。
实现
以下是指标本身的代码,其中包含了指标 ZigZag 数据反馈的示例。
/*///———————————————————————————————————————————————————————————————————————————————————————————————————————

    IndicatorTester.mq4

    Visual Testing the Profitability of Indicators and Alerts

    Copyright © 2006, Кравчук Сергей,  http://forextools.com.ua

/*///———————————————————————————————————————————————————————————————————————————————————————————————————————
#property copyright "Copyright © 2006-2008, Sergey Kravchuk. http://forextools.com.ua"
#property link      "http://forextools.com.ua"

#property indicator_chart_window
#property indicator_buffers 0

// parameters for displaying the elements of the chart
extern bool   ShowZZ          = true;           // should the ZZ be drawn?
extern bool   ShowMARKERS     = true;           // should the vertical marking lines be drawn?

//dates of drawing the chart
extern datetime DateStart     = D'1.01.1970';
extern datetime DateEnd       = D'31.12.2037';

//parameters of profit calculations
extern double LotForCalc      = 0.05;           // the amount of lots for profit calculations
extern int    Optimizm        = 0;              // -1 gives a pessimistic calculation; 0 gives the calculation on bar opening prices;
                                                //+1 is optimistic

// BUY lines colors
extern color  ColorProfitBuy  = Blue;           // line color for profitable BUY trades
extern color  ColorLossBuy    = Red;            // line color for losing BUY trades
extern color  ColorZeroBuy    = Gray;           // line color for BUY trades with zero profits

// SELL lines colors
extern color  ColorProfitSell = Blue;           // line color for profitable SELL trades
extern color  ColorLossSell   = Red;            // line color for losing SELL trades
extern color  ColorZeroSell   = Gray;           // line color for SELL trades with zero profits

// alert lines colors
extern color  ColorBuy        = CornflowerBlue; // line color for BUY alerts
extern color  ColorSell       = HotPink;        // line color for SELL alerts
extern color  ColorClose      = Gainsboro;      // line color for closing alerts

//——————————————————————————————————————————————————————————————————————————————————————————————————————————
double sBuy[],sCloseBuy[],sSell[],sCloseSell[]; // arrays for alerts
int sBuyCnt,sSellCnt,sBuyCloseCnt,sSellCloseCnt;// alerts counters
int i,DisplayBars;
//——————————————————————————————————————————————————————————————————————————————————————————————————————————
// service codes
#define MrakerPrefix "IT_"
#define OP_CLOSE_BUY  444
#define OP_CLOSE_SELL 555
//——————————————————————————————————————————————————————————————————————————————————————————————————————————
int init()   { ClearMarkers(); return(0); }
int deinit() { ClearMarkers(); return(0); }
//——————————————————————————————————————————————————————————————————————————————————————————————————————————
int start()
{
  double Profit=0,P1,P2; int CntProfit=0,CntLoose=0,i1,i2;

  //————————————————————————————————————————————————————————————————————————————————————————————————————————
  // delete all marks, in case the indicator is going to be redrawn
  ClearMarkers();
  //————————————————————————————————————————————————————————————————————————————————————————————————————————
  // prepare alerts counters
  sBuyCnt=0; sSellCnt=0; sBuyCloseCnt=0; sSellCloseCnt=0;
  //————————————————————————————————————————————————————————————————————————————————————————————————————————
  // allocate some memory for alerts arrays and zeroize their valuesя
  DisplayBars=Bars; // the amount of bars to be displayed
  ArrayResize(sBuy,DisplayBars);  ArrayInitialize(sBuy,0);
  ArrayResize(sSell,DisplayBars); ArrayInitialize(sSell,0);
  ArrayResize(sCloseBuy,DisplayBars);  ArrayInitialize(sCloseBuy,0);
  ArrayResize(sCloseSell,DisplayBars); ArrayInitialize(sCloseSell,0);
  //————————————————————————————————————————————————————————————————————————————————————————————————————————
  // find the first point and save its location and price
  for(i1=Bars-1;i1>=0;i1--) { P1=iCustom(NULL,0,"ZigZag",0,i1); if(P1!=0) break; }
  // process the ZigZag points
  for(i2=i1-1;i2>=0;i2--)
  {
    // find the next point and save its location and price
    for(i2=i2;i2>=0;i2--) { P2=iCustom(NULL,0,"ZigZag",0,i2); if(P2!=0) break; }

    if(i2<0) break; // place the last point on the current price

    // the opening conditions are at the same time the conditions of closing an opposite order
    if(P1>P2) { sSell[i1]=1; sBuy[i2]=1; sCloseSell[i2]=1; }
    if(P1<P2) { sBuy[i1]=1; sSell[i2]=1; sCloseBuy[i2]=1; }

    P1=P2; i1=i2; // save the bar in which the point has been found
  }
    //——————————————————————————————————————————————————————————————————————————————————————————————————————
  // delete the repeated alerts having saved only the very first ones located to the left on the chart
  for(i=0;i<DisplayBars;i++)
  {
    if(sBuy[i]==sBuy[i+1]) sBuy[i]=0;
    if(sSell[i]==sSell[i+1]) sSell[i]=0;
    if(sCloseBuy[i]==sCloseBuy[i+1]) sCloseBuy[i]=0;
    if(sCloseSell[i]==sCloseSell[i+1]) sCloseSell[i]=0;
  }
  // delete the alerts outside the specified range of dates
  for(i=0;i<DisplayBars;i++)
  {
    if(Time[i]<DateStart || DateEnd<Time[i]) { sBuy[i]=0; sSell[i]=0; sCloseBuy[i]=0; sCloseSell[i]=0; }
  }
  // add forcible closing marginal positions
  if(DateEnd<=Time[0]) { i=iBarShift(Symbol(),Period(),DateEnd); sBuy[i]=0; sSell[i]=0;
                                                             sCloseBuy[i]=1; sCloseSell[i]=1; }
  if(DateEnd >Time[0]) { sCloseBuy[0]=1; sCloseSell[0]=1; }
  //————————————————————————————————————————————————————————————————————————————————————————————————————————
  // count the amount of alerts

  for(i=0;i<DisplayBars;i++)
  {
    if(sBuy [i]!=0) sBuyCnt++;  if(sCloseBuy [i]!=0) sBuyCloseCnt++;
    if(sSell[i]!=0) sSellCnt++; if(sCloseSell[i]!=0) sSellCloseCnt++;
  }
  //————————————————————————————————————————————————————————————————————————————————————————————————————————
  // place the marks, draw a ZZ and calculate the profits
  //————————————————————————————————————————————————————————————————————————————————————————————————————————
  // process BUY trades
  for(i=DisplayBars-1;i>=0;i--) // go and collect the points
  {
    // find the next OPEN point and save its location and price
    for(i1=i;i1>=0;i1--) if(sBuy[i1]!=0) break;

    // find the next CLOSE point of a BUY trade and save its location and price
    for(i2=i1-1;i2>=0;i2--) if(sCloseBuy[i2]!=0) break;
    if(i2<0) i2=0; // for the last unclosed position, calculate the CLOSE on the current price
    i=i2; // new bar to continue searching for OPEN points

    // define the prices for drawing according to the parameter of optimism, Optimizm
    if(Optimizm<0)  { P1=High[i1]; P2=Low[i2];  }
    if(Optimizm==0) { P1=Open[i1]; P2=Open[i2]; }
    if(Optimizm>0)  { P1=Low[i1];  P2=High[i2]; }

    P1/=Point; P2/=Point; // express prices in points

    // find the profit and fill out the corresponding buffer
    if(i1>=0)
    {
      Profit=Profit+P2-P1; // collect the summed profit
      if(P2-P1>=0) CntProfit++; else CntLoose++; // count the number of orders
      DrawLine(i1,i2,OP_BUY,Optimizm); // draw the order line
      PlaceMarker(i1,OP_BUY);
      PlaceMarker(i2,OP_CLOSE_BUY);
    }
  }
  //————————————————————————————————————————————————————————————————————————————————————————————————————————
  // process the SELL trades
  for(i=DisplayBars-1;i>=0;i--) // go and collect the points
  {
    // find the next OPEN point and save its location and price
    for(i1=i;i1>=0;i1--) if(sSell[i1]!=0) break;

    // find the next CLOSE point of a SELL trade and save its location and price
    for(i2=i1-1;i2>=0;i2--) if(sCloseSell[i2]!=0) break;
    if(i2<0) i2=0; // for the last unclosed position, calculate the CLOSE on the current price
    i=i2; // new bar to continue searching for OPEN points

    // define the prices for drawing according to the parameter of optimism, Optimizm
    if(Optimizm<0)  { P1=Low[i1];  P2=High[i2]; }
    if(Optimizm==0) { P1=Open[i1]; P2=Open[i2]; }
    if(Optimizm>0)  { P1=High[i1]; P2=Low[i2];  }

    P1/=Point; P2/=Point; // express prices in points

    // if there are both points available, find the profit and fill the corresponding buffer
    if(i1>=0)
    {
      Profit=Profit+P1-P2; // collect the summed profit
      if(P1-P2>=0) CntProfit++; else CntLoose++; // count the number of orders
      DrawLine(i1,i2,OP_SELL,Optimizm); // draw the order line
      PlaceMarker(i1,OP_SELL);
      PlaceMarker(i2,OP_CLOSE_SELL);
    }
  }
  //————————————————————————————————————————————————————————————————————————————————————————————————————————
  // calculating the totals for commenting
  int Cnt=CntProfit+CntLoose; // total number of operations
  // coefficient to transfer points into the deposit currency
  double ToCurrency = MarketInfo(Symbol(),MODE_TICKVALUE)*LotForCalc;
  string msg="Период: "+TimeToStr(MathMax(DateStart,Time[Bars-1]))+" - "
                                                      + TimeToStr(MathMin(DateEnd,Time[0]))+"\n\n";

  msg=msg+
  sBuyCnt+" BUY trades and "+sBuyCloseCnt+" their closings\n"+
  sSellCnt+" SELL trades and "+sSellCloseCnt+" their closings\n\n";

  // total time in days
  int TotalDays = (MathMin(DateEnd,Time[0])-MathMax(DateStart,Time[Bars-1]))/60/60/24;
                                                                       //translate seconds into days
  if(TotalDays<=0) TotalDays=1; // to avoid zero divide for shorter days

  if(Cnt==0) msg=msg+("No operations");
  else msg=msg+
  (
    DoubleToStr(Profit,0)+" point on "+Cnt+" operations for "+TotalDays+" days\n"+
    DoubleToStr(Profit/Cnt,1)+" point for operation ("+
    DoubleToStr(Profit/TotalDays,1)+" within a day)\n\n"+
    "When trading with "+DoubleToStr(LotForCalc,2)+" obtain in "+AccountCurrency()+":\n"+
    DoubleToStr(Profit*ToCurrency,0)+" totally, by "+
    DoubleToStr(Profit/Cnt*ToCurrency,1)+" per trade ("+
    DoubleToStr(Profit/TotalDays*ToCurrency,1)+" within one day)\n\n"+
    CntProfit+" profitable ("+DoubleToStr(((CntProfit)*1.0/Cnt*1.0)*100.0,1)+"%)\n"+
    CntLoose+" losing ("+DoubleToStr(((CntLoose)*1.0/Cnt*1.0)*100.0,1)+"%)"
  );
  Comment(msg);

}
//——————————————————————————————————————————————————————————————————————————————————————————————————————————


//——————————————————————————————————————————————————————————————————————————————————————————————————————————
// deleting all objects from our chart
void ClearMarkers()
{
  for(int i=0;i<ObjectsTotal();i++)
  if(StringFind(ObjectName(i),MrakerPrefix)==0) { ObjectDelete(ObjectName(i)); i--; }
}
//——————————————————————————————————————————————————————————————————————————————————————————————————————————
// placing a vertical line - marks of the operation of the op_type type
void PlaceMarker(int i, int op_type)
{
  if(!ShowMARKERS) return; // displaying markers disabled

  color MarkerColor; string MarkName;

  // __ for the CLOSE line to be drawn below the OPEN line at sorting
  if(op_type==OP_CLOSE_SELL) { MarkerColor=ColorClose; MarkName=MrakerPrefix+"__SELL_"+i; }
  if(op_type==OP_CLOSE_BUY)  { MarkerColor=ColorClose; MarkName=MrakerPrefix+"__BUY_"+i;  }
  if(op_type==OP_SELL)       { MarkerColor=ColorSell;  MarkName=MrakerPrefix+"_SELL_"+i;  }
  if(op_type==OP_BUY)        { MarkerColor=ColorBuy;   MarkName=MrakerPrefix+"_BUY_"+i;   }

  ObjectCreate(MarkName,OBJ_VLINE,0,Time[i],0);
  ObjectSet(MarkName,OBJPROP_WIDTH,1);
  if(op_type==OP_CLOSE_BUY || op_type==OP_CLOSE_SELL) ObjectSet(MarkName,OBJPROP_STYLE,STYLE_SOLID);
  else ObjectSet(MarkName,OBJPROP_STYLE,STYLE_DOT);
  ObjectSet(MarkName,OBJPROP_BACK,True);

  ObjectSet(MarkName,OBJPROP_COLOR,MarkerColor);
}
//——————————————————————————————————————————————————————————————————————————————————————————————————————————
// placing a line on the chart for the operation of the op_type type at the prices of parameter Optimizm
void DrawLine(int i1,int i2, int op_type, int Optimizm)
{
  if(!ShowZZ) return; // ZZ displaying disabled

  color СurColor;
  string MarkName=MrakerPrefix+"_"+i1+"_"+i2;
  double P1,P2;

  // define prices for drawing, according to parameter Optimizm
  if(Optimizm<0 && op_type==OP_BUY)  { P1=High[i1]; P2=Low[i2];  }
  if(Optimizm<0 && op_type==OP_SELL) { P1=Low[i1];  P2=High[i2]; }
  if(Optimizm==0)                    { P1=Open[i1]; P2=Open[i2]; }
  if(Optimizm>0 && op_type==OP_BUY)  { P1=Low[i1];  P2=High[i2]; }
  if(Optimizm>0 && op_type==OP_SELL) { P1=High[i1]; P2=Low[i2];  }

  ObjectCreate(MarkName,OBJ_TREND,0,Time[i1],P1,Time[i2],P2);

  ObjectSet(MarkName,OBJPROP_RAY,False); // draw segments, not lines
  ObjectSet(MarkName,OBJPROP_BACK,False);
  ObjectSet(MarkName,OBJPROP_STYLE,STYLE_SOLID);
  ObjectSet(MarkName,OBJPROP_WIDTH,2);

  // set line color depending on the profitability of the trade
  if(op_type==OP_BUY)
  {
    if(P1 <P2) СurColor = ColorProfitBuy;
    if(P1==P2) СurColor = ColorZeroBuy;
    if(P1 >P2) СurColor = ColorLossBuy;
  }
  if(op_type==OP_SELL)
  {
    if(P1 >P2) СurColor = ColorProfitSell;
    if(P1==P2) СurColor = ColorZeroSell;
    if(P1 <P2) СurColor = ColorLossSell;
  }
  ObjectSet(MarkName,OBJPROP_COLOR,СurColor);
}
//——————————————————————————————————————————————————————————————————————————————————————————————————————————
指标参数包含特别参数, Optimizm。该参数设置计算优化的所需程度。如果该值低于零,则说明计算结果将完全消极:对于 BUY 价会选择提醒柱的 High ,对于 SELL 价则会选择 - Low。这便是我们可以通过这些提醒获得的最差结果的模型。如果该值高于零,则建立最乐观计算的模型:在最低点买入并在最高点卖出。如果此参数的值等于零,则采取中性行为,我们在柱的 OPEN 价位打开和关闭订单 - 这是通常在使用 EA 进行交易时实现的情况。
分析结果
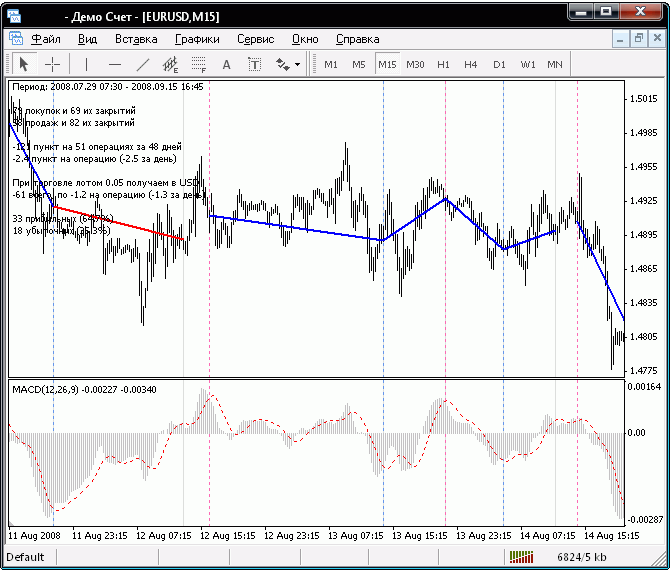
现在让我们来看看结果。这是对锯齿形调整浪进行客观分析所获得的结果。
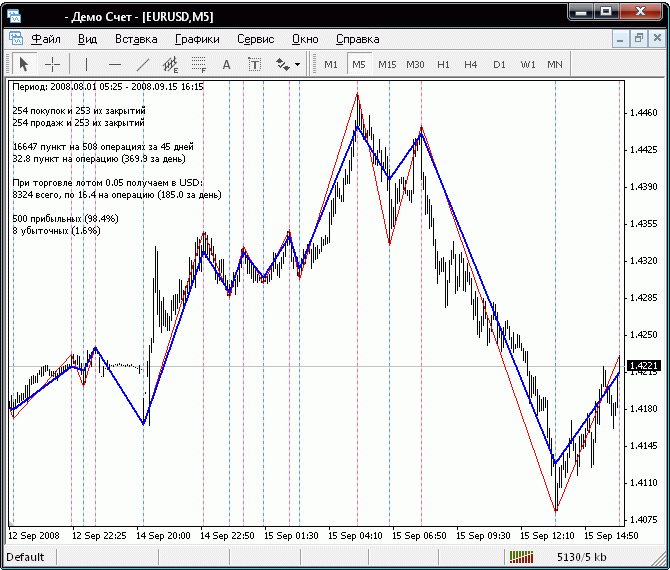
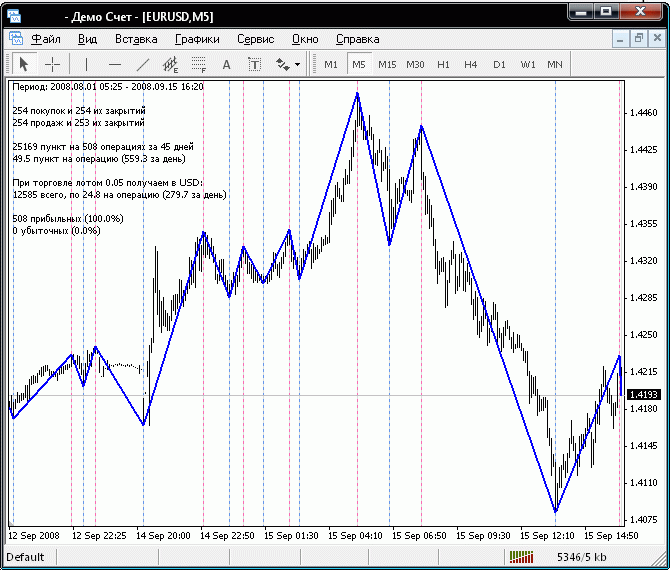
请看,图表显示有八个失去的部分。锯齿形调整浪对最佳价位“有效”,为将其重建,我们应将参数 Optimizm设为 1。
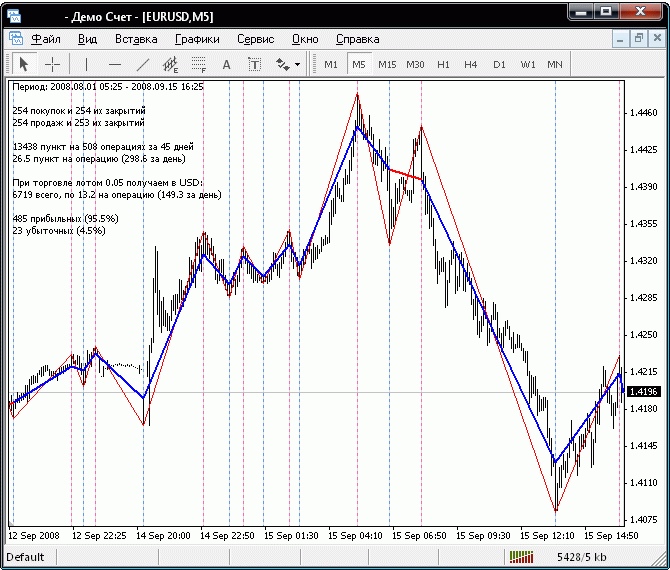
如果我们进行了很差的交易后,若我们将参数 Optimizm 设为 -1,将会出现什么结果。
一点题外话
亲爱的交易员,
请勿责怪于我,但如果该指标在你管理层的能手中发生的话,则会非常棘手,这些能手通常对交易策略的细节并不感兴趣 - 他们仅对结果感兴趣。将 ZigZag 提醒的算法上传至测试程序并将Optimizm设为 1,他们将获得最大利润数据,该数据可自图表的该部分获取,并且他们也希望你去获取。如果你经常按低于一半的金额进行交易,这会让他们认为你可能对你的职责不太上心。
另一方面而言,这个工具可很好地应对不合理的苛刻要求。你有充分的理由可以申辩,他们为你设置的计划是不切实际的,甚至无法在最理想情况下获得。
我们可以看到,单独使用 Optimizm 参数可允许你使用该指标,以对在其中测试的提醒指标进行潜在估算。如果最乐观的计算也无法带来盈利,那么便应该对受测试的提醒指标进行修改:你应为指标找来其他参数或干脆将这个没救的指标遗忘,从而节省 EA 开发时间和保证金,避免在搜集证据证明指标无效时出现损失。因此,我们测试的指标不仅可为我们节省时间,还有金钱。
分析交易系统提醒
其他指标的缓冲区不是填充我们测试指标所依据的提醒数组的唯一来源。你可以在书中某处或网络深处找到交易系统提醒的描述,其中并没有指标或 Expert Advisor 的描述。这仅是一套可简单应用到 MQL4 中的规则。如果你可以为这个系统编写提醒的算法,并使用算法来填充提醒缓冲区,则测试指标将向你展示你通过系统所能获取的结果。
如果系统中有准备就绪的代码,你可以选择 EA 运行所依据提醒计算,并直接在图表示建立“运行结果”。当然你可以在 MetaTrader 4 策略测试程序上获取更加精确的相同结果,但指标会更快速地进行重建并可以比测试程序的严格规则更生动将其反映出来。
这种情况下的重要时刻是,所得结果的图表有机会与其他指标进行整合。交叉额外指标的垂直标记行可能会告诉你如何使用它们来指定主提醒或检测它们运行不足的位置。最后我们只可以通过乱枪打鸟的方法来选择可能会比优化程序结果更适合我们的参数值。
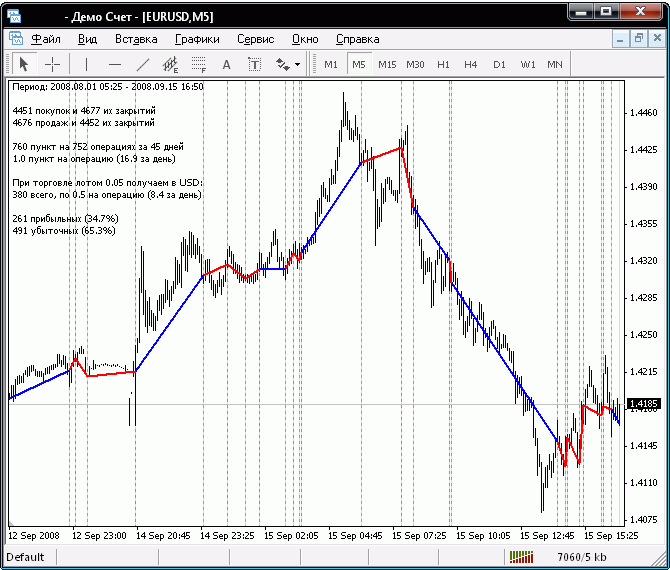
让我们来看一看标准 MACD的现成代码。这就是代码应有的样子。填充提醒数组块,其内容 从指标文本中复制并粘贴而来:
  // fill out alert arrays with values and count them
  for(i=DisplayBars;i>=0;i--)
  {
    double MacdCurrent, MacdPrevious, SignalCurrent;
    double SignalPrevious, MaCurrent, MaPrevious;

    // to simplify the coding and speed up access
    // data are put into internal variables
    MacdCurrent=iMACD(NULL,0,12,26,9,PRICE_CLOSE,MODE_MAIN,i+0);
    MacdPrevious=iMACD(NULL,0,12,26,9,PRICE_CLOSE,MODE_MAIN,i+1);
    SignalCurrent=iMACD(NULL,0,12,26,9,PRICE_CLOSE,MODE_SIGNAL,i+0);
    SignalPrevious=iMACD(NULL,0,12,26,9,PRICE_CLOSE,MODE_SIGNAL,i+1);
    MaCurrent=iMA(NULL,0,MATrendPeriod,0,MODE_EMA,PRICE_CLOSE,i+0);
    MaPrevious=iMA(NULL,0,MATrendPeriod,0,MODE_EMA,PRICE_CLOSE,i+1);

    // check for long position (BUY) possibility
    if(MacdCurrent<0 && MacdCurrent>SignalCurrent && MacdPrevious<SignalPrevious &&
       MathAbs(MacdCurrent)>(MACDOpenLevel*Point) && MaCurrent>MaPrevious) sBuy[i]=1;

    // check for short position (SELL) possibility
    if(MacdCurrent>0 && MacdCurrent<SignalCurrent && MacdPrevious>SignalPrevious &&
       MathAbs(MacdCurrent)>(MACDOpenLevel*Point) && MaCurrent<MaPrevious) sSell[i]=1;

    if(MacdCurrent>0 && MacdCurrent<SignalCurrent && MacdPrevious>SignalPrevious &&
       MathAbs(MacdCurrent)>(MACDCloseLevel*Point)) sCloseBuy[i]=1;

    if(MacdCurrent<0 && MacdCurrent>SignalCurrent &&  MacdPrevious<SignalPrevious &&
       MathAbs(MacdCurrent)>(MACDCloseLevel*Point)) sCloseSell[i]=1;
  }
这是结果:
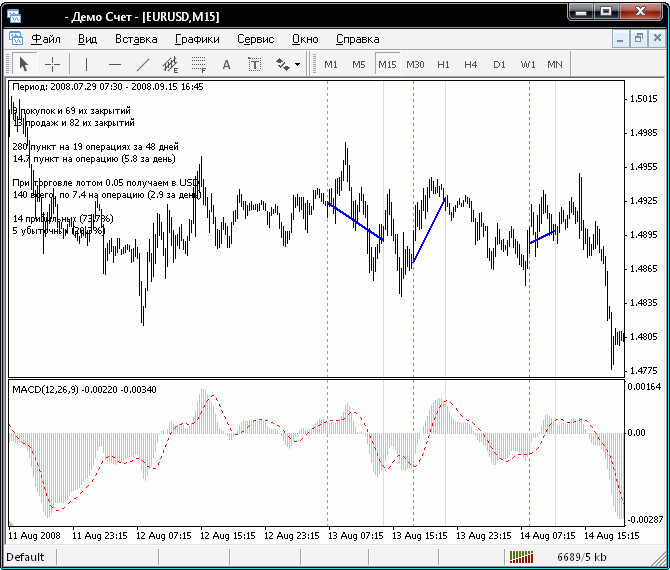
请注意提醒标记的行数完全匹配 MACD 图表的交叉点。也许看着这些相连的图表,你可以决定应在图表中作何修改了。举例而言,MaCurrent 和 MaPrevious 不需要检查。一段很小的纠正代码:
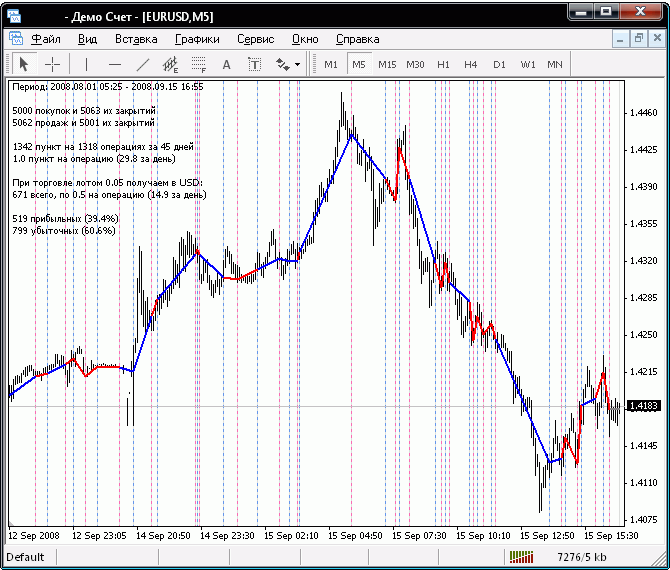
  // fill out alert arrays with values and count them
  for(i=DisplayBars;i>=0;i--)
  {
    double MacdCurrent, MacdPrevious, SignalCurrent;
    double SignalPrevious, MaCurrent, MaPrevious;

    // to simplify the coding and speed up access
    // data are put into internal variables
    MacdCurrent=iMACD(NULL,0,12,26,9,PRICE_CLOSE,MODE_MAIN,i+0);
    MacdPrevious=iMACD(NULL,0,12,26,9,PRICE_CLOSE,MODE_MAIN,i+1);
    SignalCurrent=iMACD(NULL,0,12,26,9,PRICE_CLOSE,MODE_SIGNAL,i+0);
    SignalPrevious=iMACD(NULL,0,12,26,9,PRICE_CLOSE,MODE_SIGNAL,i+1);
    MaCurrent=iMA(NULL,0,MATrendPeriod,0,MODE_EMA,PRICE_CLOSE,i+0);
    MaPrevious=iMA(NULL,0,MATrendPeriod,0,MODE_EMA,PRICE_CLOSE,i+1);

    // check for long position (BUY) possibility
    if(MacdCurrent<0 && MacdCurrent>SignalCurrent && MacdPrevious<SignalPrevious &&
       MathAbs(MacdCurrent)>(MACDOpenLevel*Point)) sBuy[i]=1;

    // check for short position (SELL) possibility
    if(MacdCurrent>0 && MacdCurrent<SignalCurrent && MacdPrevious>SignalPrevious &&
       MathAbs(MacdCurrent)>(MACDOpenLevel*Point)) sSell[i]=1;

    if(MacdCurrent>0 && MacdCurrent<SignalCurrent && MacdPrevious>SignalPrevious &&
       MathAbs(MacdCurrent)>(MACDCloseLevel*Point)) sCloseBuy[i]=1;

    if(MacdCurrent<0 && MacdCurrent>SignalCurrent &&  MacdPrevious<SignalPrevious &&
       MathAbs(MacdCurrent)>(MACDCloseLevel*Point)) sCloseSell[i]=1;
  }
你可以看见结果。运行次数从 19 上升至 51。虽然总利润变为亏损,表明这不是改善提醒质量的好办法。
测试设想
每个开发员都会有些未曾实现过的侵入想法。指标测试程序可帮助你快速显现并估算这些想法。如果这些想法看来是正确的,而且获得正面结果,则开发员可考虑编写指标或 Expert Advisor。在此情况下,指标测试程序的结果同时可作为开发的要求规范说明及最终例子,现成产品将根据此结果进行检查。
这是一个原始”系统“示例:使用简单的 MA 指标进行买入。买入条件 - MA 上升,卖出条件 - MA 下降。看吧,如何快速检查这个想法的盈利能力。这是提醒填充的块:
  // fill out alert arrays with values and count them
  for(i=DisplayBars;i>=0;i--)
  {
    double m1=iMA(NULL,0,MAPeriod,0,MAMode,MAPrice,i+1);
    double m2=iMA(NULL,0,MAPeriod,0,MAMode,MAPrice,i+2);

    // open conditions are at the same time close conditions of an opposite order
    if(m2<=m1 && MathAbs(m1-m2)>0.2*Point) { sBuy[i]=1; sCloseSell[i]=1; sBuyCnt++; sSellCloseCnt++; }
    if(m2>=m1 && MathAbs(m1-m2)>0.2*Point) { sSell[i]=1; sCloseBuy[i]=1; sSellCnt++; sBuyCloseCnt++; }
  }
这是结果:
虽然不差,但却不是最好结果 - 因为我们曾幻想过巨额利润。现在让我们尝试缩短 MA 周期以提高获得盈利交易的可能性。通过将周期从 15 个柱缩短至 7 个,我们成功将平均日利润提高了近两倍:
剩下的就只有将盈利交易和亏损交易的关联系数定为至少 80% 比 20%。但你须自行完成这个任务。
总结
现在你有一个新的工具来对指标和交易提醒进行快速分析。这些工具自然不会取代测试程序或真实交易。所有通过该工具所得数据都是描述和估算性的。但是,运行便利性、可视化和获取结果的速度让我相信这款工具对任何开发员而言都有极大裨益。它可以帮助你快速检验交易思路,却不会花费太多时间精力。就某种程度而言,该工具可用于证明思路可行还是无望的。作为一个喜欢思考的研究人员或试验主义者,我认为它可成为精优指标参数的一个工具。
本文由MetaQuotes Ltd译自俄文
原文地址: https://www.mql5.com/ru/articles/1557
注意: MetaQuotes Ltd.将保留所有关于这些材料的权利。全部或部分复制或者转载这些材料将被禁止。
本文由网站的一位用户撰写,反映了他们的个人观点。MetaQuotes Ltd 不对所提供信息的准确性负责,也不对因使用所述解决方案、策略或建议而产生的任何后果负责。

 MQL 中的对象方法

 面向初学者的 MQL4 语言。自定义指标(第 1 部分)
 面向初学者的 MQL4 语言。技术指标和内置函数