
纳什博弈论与隐马尔可夫滤模型在交易中的应用
引言
应用数学理论可以带来战略优势。纳什均衡就是这样一个理论,它由著名数学家约翰·福布斯·纳什(John Forbes Nash Jr.)提出。纳什以其在博弈论方面的贡献而闻名,他的工作在经济学等多个领域都产生了深远的影响。本文探讨了如何将纳什的均衡理论有效地应用于交易。通过使用Python脚本和先进的统计模型,我们旨在利用纳什博弈论的原则来优化交易策略,并在市场中做出更明智的决策。Nash

谁是John Forbes Nash Jr.?
维基百科对他的描述是:
约翰·福布斯·纳什(1928年6月13日—2015年5月23日),通常以约翰·纳什之名发表作品,是一位美国数学家,他在博弈论、实代数几何、微分几何和偏微分方程等领域作出了开创性的贡献。纳什与博弈论学家约翰·哈萨尼和莱因哈德·塞尔腾一同获得了1994年的诺贝尔经济学奖。2015年,他与路易斯·尼伦伯格因对偏微分方程领域的贡献而被授予阿贝尔奖。
在普林斯顿大学数学系攻读研究生期间,纳什引入了一系列概念(包括纳什均衡和纳什谈判解等),这些概念如今被认为是博弈论及其在各学科应用中的核心。
有一部根据他的人生故事改编的电影,名为《美丽心灵》。我们将把他的博弈论应用于MQL5的交易中。
我们该如何将纳什的博弈论引入交易呢?
纳什均衡理论
纳什均衡是博弈论中的一个概念,假设每个参与者都知晓其他参与者的均衡策略,且没有任何一个参与者仅通过改变自身的策略就能获得更多的收益。
在纳什均衡中,每个参与者的策略在给定其他所有参与者策略的情况下都是最优的。一场博弈可能存在多个纳什均衡,也可能一个都没有。
纳什均衡是博弈论中的一个基本概念,以数学家约翰·纳什的名字命名。它描述了一种非合作博弈的状态,其中每个参与者都选择了一种策略,且没有任何一个参与者可以通过单方面改变自己的策略(而其他参与者保持策略不变)来获得好处。
公式定义:
设(N,S,u)为一场博弈,其中:
- 参与者数量:N = {1,2,...,n}
- 每个参与者的策略集合:S = (S₁,S₂,...,Sₙ)
- 每个参与者的效用函数:u = (u₁,u₂,...,uₙ)
如果对于每个参与者i以及其所有替代策略sᵢ ∈ Sᵢ,策略组合s* = (s₁*,s₂*,...,sₙ*)是纳什均衡,那么:
uᵢ(s₁*, ..., sᵢ*, ..., sₙ*) ≥ uᵢ(s₁*, ..., sᵢ, ..., sₙ*)
换句话说,在所有其他参与者保持其均衡策略不变的情况下,没有任何参与者i可以通过偏离其均衡策略sᵢ*而选择其他任何策略sᵢ来单方面提高自身的效用。
对于双人博弈,我们可以更简洁地表达如下:
(s₁*,s₂*)是纳什均衡,如果:
- 对于所有s₁ ∈ S₁,有 u₁(s₁*, s₂*) ≥ u₁(s₁, s₂*)
- 对于所有s₂ ∈ S₂,有 u₂(s₁*, s₂*) ≥ u₂(s₁*, s₂)
这种表述强调了在均衡状态下,每个参与者的策略是对另一个参与者策略的最佳回应。
需要注意的是:
- 并非所有博弈在单纯策略上都存在一个纳什均衡。
- 有些博弈可能存在多个纳什均衡。
- 纳什均衡并不一定是帕累托最优的,也不一定是所有参与者集体期望的最理想结果。
纳什均衡的概念在经济学、政治学以及其他研究理性主体之间战略互动的领域有着广泛的应用。
尽管在纳什均衡中,没有一方可以在其他人不调整的情况下单方面改善自身处境,但在实践中,金融市场是动态的,很少处于完美的均衡状态。赚钱的机会源于暂时的市场无效性、信息优势、更好的风险管理能力以及比其他参与者更快的反应速度。此外,外部的、不可预测的因素可能会打破平衡,为有准备的人创造新的机会。
首先,我们必须选择货币(我们将进行纳什均衡分析,因此需要两种货币符号,我们会选择负相关的货币符号),我们将使用Python来完成这项工作。以下是所使用的脚本:
import MetaTrader5 as mt5
import pandas as pd
from scipy.stats import pearsonr
from statsmodels.tsa.stattools import coint
import numpy as np
import datetime

# Connect with MetaTrader 5
if not mt5.initialize():
    print("Failed to initialize MT5")
    mt5.shutdown()

# Get the list of symbols
symbols = mt5.symbols_get()
symbols = [s.name for s in symbols if s.name.startswith('EUR') or s.name.startswith('USD') or s.name.endswith('USD')]  # Filter symbols by example

# Download historical data and save in dictionary
data = {}
for symbol in symbols:
    start_date = "2020-01-01"
    end_date = "2023-12-31"
    timeframe = mt5.TIMEFRAME_H4
    start_date = datetime.datetime.strptime(start_date, "%Y-%m-%d")
    end_date = datetime.datetime.strptime(end_date, "%Y-%m-%d")
    rates = mt5.copy_rates_range(symbol, timeframe, start_date, end_date)

    if rates is not None:
        df = pd.DataFrame(rates)
        df['time'] = pd.to_datetime(df['time'], unit='s')
        data[symbol] = df.set_index('time')['close']

# Close connection with MT5
mt5.shutdown()

# Calculate the Pearson coefficient and test for cointegration for each pair of symbols
cointegrated_pairs = []
for i in range(len(symbols)):
    for j in range(i + 1, len(symbols)):
        if symbols[i] in data and symbols[j] in data:
            common_index = data[symbols[i]].index.intersection(data[symbols[j]].index)
            if len(common_index) > 30:  # Ensure there are enough data points
                corr, _ = pearsonr(data[symbols[i]][common_index], data[symbols[j]][common_index])
                if abs(corr) > 0.8:  # Strong correlation
                    score, p_value, _ = coint(data[symbols[i]][common_index], data[symbols[j]][common_index])
                    if p_value < 0.05:  # P-value less than 0.05
                        cointegrated_pairs.append((symbols[i], symbols[j], corr, p_value))

# Filter and show only cointegrated pairs with p-value less than 0.05
print(f'Total pairs with strong correlation and cointegration: {len(cointegrated_pairs)}')
for sym1, sym2, corr, p_val in cointegrated_pairs:
    print(f'{sym1} - {sym2}: Correlation={corr:.4f}, P-Cointegration value={p_val:.4f}')
这个脚本首先初始化MetaTrader 5,然后获取所有以EUR或USD开头或以USD结尾的货币符号。之后,它从这些货币符号中下载数据,并关闭MetaTrader 5。它比较所有货币对,只通过强相关性的货币对,然后对强协整的货币对进行另一层筛选。最后,它在终端显示剩下的货币对。
相关性 衡量两个事物之间的关联程度。想象一下你和你最好的朋友总是在周六一起去看电影。这就是相关性的一个例子:当你去电影院时,你的朋友也在那里。如果相关性是正的,意味着一个增加时,另一个也会增加。如果是负的,一个增加时,另一个则减少。如果相关性为零,意味着两者之间没有任何联系。
协整 是一个统计学概念,用于描述两个或多个变量之间存在某种长期关系的情况,尽管它们在短期内可能会独立波动。想象一下两个用绳子系在一起的游泳者:他们可以在泳池中自由游泳,但他们不能离得太远。协整表明,尽管存在暂时的差异,但这些变量总会回归到一个共同的长期均衡或趋势。
皮尔逊相关系数 衡量两个变量之间的线性相关程度。如果系数接近+1,表示一个变量增加时,另一个变量也会增加,呈现正相关。如果系数接近-1,表示一个变量增加时,另一个变量减少,呈现负相关。值为0则表示两者之间没有线性联系。例如,通过测量温度和冷饮销售量之间的关系,可以使用皮尔逊相关系数来理解这些因素之间的关联。
脚本的结果应该像这样(这是脚本初始条件下的结果):
    start_date = "2020-01-01"
    end_date = "2023-12-31"
    timeframe = mt5.TIMEFRAME_H4
具有强相关性和协整的货币对总数:40
USDJPY - EURCHF: Correlation=-0.9416, P-Cointegration value=0.0165
USDJPY - EURN.NASDAQ: Correlation=0.9153, P-Cointegration value=0.0008
USDCNH - USDZAR: Correlation=0.8474, P-Cointegration value=0.0193
USDRUB - USDRUR: Correlation=0.9993, P-Cointegration value=0.0000
AUDUSD - USDCLP: Correlation=-0.9012, P-Cointegration value=0.0280
AUDUSD - USDILS: Correlation=-0.8686, P-Cointegration value=0.0026
NZDUSD - USDNOK: Correlation=-0.9353, P-Cointegration value=0.0469
NZDUSD - USDILS: Correlation=-0.8514, P-Cointegration value=0.0110
...
EURSEK - XPDUSD: Correlation=-0.8200, P-Cointegration value=0.0269
EURZAR - USDP.NASDAQ: Correlation=-0.8678, P-Cointegration value=0.0154
USDMXN - EURCNH: Correlation=-0.8490, P-Cointegration value=0.0389
EURL.NASDAQ - EURSGD: Correlation=0.9157, P-Cointegration value=0.0000
EURN.NASDAQ - EURSGD: Correlation=-0.8301, P-Cointegration value=0.0358
根据所有的结果,我们将选择这两个货币符号(负相关意味着当一个上升时,另一个下降,反之亦然;而正相关则意味着这两个货币符号会朝着相同的方向变动)。我将选择USDJPY货币对,正如纳什均衡中所解释的那样,我们可以利用美元作为外汇市场的核心动力,其他与之相关的货币会跟随其变动:
USDJPY - EURCHF: Correlation=-0.9416, P-Cointegration value=0.0165
我使用MetaTrader 5 模拟账户来获取所有数据和回测EA。
HMM(隐马尔科夫模型)
隐马尔可夫模型(HMM)是一种统计模型,用于描述那些随时间变化的系统,这种变化部分是随机的,部分依赖于隐藏的状态。想象一个过程,我们只能观察到某些结果,但这些结果受到我们无法直接看到的潜在因素(或状态)的影响。
在交易中,HMM用于构建一个模型,该模型利用历史数据预测市场的模式。
我们将使用Python脚本来获取HMM模型,我们必须考虑所使用的时间框架(它应该与EA中的相同)、隐藏状态的数量以及用于预测的数据量(在这里,数据量越大越好)。
Python脚本将返回3个矩阵(以.txt格式保存),以及三张图表,我们将把这些用于EA中。
以下是.py脚本:
import MetaTrader5 as mt5
import pandas as pd
import numpy as np
from hmmlearn import hmm
from sklearn.preprocessing import StandardScaler
from sklearn.model_selection import train_test_split
import matplotlib.pyplot as plt
import datetime
import os
import sys

# Number of models to train
n_models = 10

# Redirect stdout to a file
def redirect_output(symbol):
    output_file = f"{symbol}_output.txt"
    sys.stdout = open(output_file, 'w')

# Connect to MetaTrader 5
if not mt5.initialize():
    print("initialize() failed")
    mt5.shutdown()

# Get and process data
def get_mt5_data(symbol, timeframe, start_date, end_date):
    """Get historical data from MetaTrader 5."""
    start_date = datetime.datetime.strptime(start_date, "%Y-%m-%d")
    end_date = datetime.datetime.strptime(end_date, "%Y-%m-%d")
    rates = mt5.copy_rates_range(symbol, timeframe, start_date, end_date)
    df = pd.DataFrame(rates)
    df['time'] = pd.to_datetime(df['time'], unit='s')
    df.set_index('time', inplace=True)
    return df

def calculate_features(df):
    """Calculate important features like returns, volatility, and trend."""
    df['returns'] = df['close'].pct_change()
    df['volatility'] = df['returns'].rolling(window=50).std()
    df['trend'] = df['close'].pct_change(periods=50)
    return df.dropna()

# Main script
symbol = "USDJPY"
timeframe = mt5.TIMEFRAME_H4
start_date = "2020-01-01"
end_date = "2023-12-31"
current_date = datetime.datetime.now().strftime("%Y-%m-%d")

# Redirect output to file
redirect_output(symbol)

# Get historical data for training
df = get_mt5_data(symbol, timeframe, start_date, end_date)
df = calculate_features(df)

features = df[['returns', 'volatility', 'trend']].values
scaler = StandardScaler()
scaled_features = scaler.fit_transform(features)

# Lists to store the results of each model
state_predictions = np.zeros((scaled_features.shape[0], n_models))
strategy_returns = np.zeros((scaled_features.shape[0], n_models))
transition_matrices = np.zeros((10, 10, n_models))
means_matrices = np.zeros((n_models, 10, 3))
covariance_matrices = np.zeros((n_models, 10, 3, 3))

# Train multiple models and store the results
for i in range(n_models):
    model = hmm.GaussianHMM(n_components=10, covariance_type="full", n_iter=10000, tol=1e-6, min_covar=1e-3)
    X_train, X_test = train_test_split(scaled_features, test_size=0.2, random_state=i)
    model.fit(X_train)

    # Save the transition matrix, emission means, and covariances
    transition_matrices[:, :, i] = model.transmat_
    means_matrices[i, :, :] = model.means_
    covariance_matrices[i, :, :, :] = model.covars_

    # State prediction
    states = model.predict(scaled_features)
    state_predictions[:, i] = states

    # Generate signals and calculate strategy returns for this model
    df['state'] = states
    df['signal'] = 0
    for j in range(10):
        df.loc[df['state'] == j, 'signal'] = 1 if j % 2 == 0 else -1
    df['strategy_returns'] = df['returns'] * df['signal'].shift(1)
    strategy_returns[:, i] = df['strategy_returns'].values

# Average of matrices
average_transition_matrix = transition_matrices.mean(axis=2)
average_means_matrix = means_matrices.mean(axis=0)
average_covariance_matrix = covariance_matrices.mean(axis=0)

# Save the average matrices in the output file in appropriate format
print("Average Transition Matrix:")
for i, row in enumerate(average_transition_matrix):
    for j, val in enumerate(row):
        print(f"average_transition_matrix[{i}][{j}] = {val:.8f};")

print("\nAverage Means Matrix:")
for i, row in enumerate(average_means_matrix):
    for j, val in enumerate(row):
        print(f"average_means_matrix[{i}][{j}] = {val:.8f};")

print("\nAverage Covariance Matrix:")
for i in range(10):  # For each state
    for j in range(3):  # For each row of the covariance matrix
        for k in range(3):  # For each column of the covariance matrix
            print(f"average_covariance_matrix[{i}][{j}][{k}] = {average_covariance_matrix[i, j, k]:.8e};")

# Average of state predictions and strategy returns
average_states = np.round(state_predictions.mean(axis=1)).astype(int)
average_strategy_returns = strategy_returns.mean(axis=1)

# Store the average results in the original dataframe
df['average_state'] = average_states
df['average_strategy_returns'] = average_strategy_returns

# Calculate cumulative returns using the average strategy
df['cumulative_market_returns'] = (1 + df['returns']).cumprod()
df['cumulative_strategy_returns'] = (1 + df['average_strategy_returns']).cumprod()

# Plot cumulative returns (training)
plt.figure(figsize=(7, 6))
plt.plot(df.index, df['cumulative_market_returns'], label='Market Returns')
plt.plot(df.index, df['cumulative_strategy_returns'], label='Strategy Returns (Average)')
plt.title('Cumulative Returns with Average Strategy')
plt.xlabel('Date')
plt.ylabel('Cumulative Returns')
plt.legend()
plt.grid(True)
plt.savefig(f'average_strategy_returns_{symbol}.png')
plt.close()

# Additional plots for averages
fig, (ax1, ax2, ax3) = plt.subplots(3, 1, figsize=(12, 15), sharex=True)

# Plot closing price and average HMM states
ax1.plot(df.index, df['close'], label='Closing Price')
scatter = ax1.scatter(df.index, df['close'], c=df['average_state'], cmap='viridis', s=30, label='Average HMM States')
ax1.set_ylabel('Price')
ax1.set_title('Closing Price and Average HMM States')
ax1.legend(loc='upper left')

# Add color bar for states
cbar = plt.colorbar(scatter, ax=ax1)
cbar.set_label('Average HMM State')

# Plot returns
ax2.bar(df.index, df['returns'], label='Market Returns', alpha=0.5, color='blue')
ax2.bar(df.index, df['average_strategy_returns'], label='Average Strategy Returns', alpha=0.5, color='red')
ax2.set_ylabel('Return')
ax2.set_title('Daily Returns')
ax2.legend(loc='upper left')

# Plot cumulative returns
ax3.plot(df.index, df['cumulative_market_returns'], label='Cumulative Market Returns')
ax3.plot(df.index, df['cumulative_strategy_returns'], label='Cumulative Average Strategy Returns')
ax3.set_ylabel('Cumulative Return')
ax3.set_title('Cumulative Returns')
ax3.legend(loc='upper left')

# Adjust layout
plt.tight_layout()
plt.xlabel('Date')

# Save figure
plt.savefig(f'average_returns_{symbol}.png')
plt.close()

# Calculate cumulative returns for each average state
state_returns = {}
for state in range(10):  # Assuming 10 states
    state_returns[state] = df[df['average_state'] == state]['returns'].sum()

# Create lists for states and their cumulative returns
states = list(state_returns.keys())
returns = list(state_returns.values())

# Create bar chart
plt.figure(figsize=(7, 6))
bars = plt.bar(states, returns)

# Customize chart
plt.title('Cumulative Returns by Average HMM State', fontsize=7)
plt.xlabel('State', fontsize=7)
plt.ylabel('Cumulative Return', fontsize=7)
plt.xticks(states)

# Add value labels above each bar
for bar in bars:
    height = bar.get_height()
    plt.text(bar.get_x() + bar.get_width()/2., height,
             f'{height:.4f}',
             ha='center', va='bottom')

# Add horizontal line at y=0 for reference
plt.axhline(y=0, color='r', linestyle='-', linewidth=0.5)

# Adjust layout and save chart
plt.tight_layout()
plt.savefig(f'average_bars_{symbol}.png')
plt.close()

# Get recent data to test the model
df_recent = get_mt5_data(symbol, timeframe, end_date, current_date)
df_recent = calculate_features(df_recent)

# Apply the same scaler to recent data
scaled_recent_features = scaler.transform(df_recent[['returns', 'volatility', 'trend']].values)

# Lists to store the results of each model for recent data
recent_state_predictions = np.zeros((scaled_recent_features.shape[0], n_models))
recent_strategy_returns = np.zeros((scaled_recent_features.shape[0], n_models))

# Apply the trained model to recent data
for i in range(n_models):
    model = hmm.GaussianHMM(n_components=10, covariance_type="full", n_iter=10000, tol=1e-4, min_covar=1e-3)
    X_train, X_test = train_test_split(scaled_features, test_size=0.2, random_state=i)
    model.fit(X_train)

    recent_states = model.predict(scaled_recent_features)
    recent_state_predictions[:, i] = recent_states

    df_recent['state'] = recent_states
    df_recent['signal'] = 0
    for j in range(10):
        df_recent.loc[df_recent['state'] == j, 'signal'] = 1 if j % 2 == 0 else -1
    df_recent['strategy_returns'] = df_recent['returns'] * df_recent['signal'].shift(1)
    recent_strategy_returns[:, i] = df_recent['strategy_returns'].values

# Average of state predictions and strategy returns for recent data
average_recent_states = np.round(recent_state_predictions.mean(axis=1)).astype(int)
average_recent_strategy_returns = recent_strategy_returns.mean(axis=1)

# Store the average results in the recent dataframe
df_recent['average_state'] = average_recent_states
df_recent['average_strategy_returns'] = average_recent_strategy_returns

# Calculate cumulative returns using the average strategy on recent data
df_recent['cumulative_market_returns'] = (1 + df_recent['returns']).cumprod()
df_recent['cumulative_strategy_returns'] = (1 + df_recent['average_strategy_returns']).cumprod()

# Plot cumulative returns (recent test)
plt.figure(figsize=(7, 6))
plt.plot(df_recent.index, df_recent['cumulative_market_returns'], label='Market Returns')
plt.plot(df_recent.index, df_recent['cumulative_strategy_returns'], label='Strategy Returns (Average)')
plt.title('Cumulative Returns with Average Strategy (Recent Data)')
plt.xlabel('Date')
plt.ylabel('Cumulative Returns')
plt.legend()
plt.grid(True)
plt.savefig(f'average_recent_strategy_returns_{symbol}.png')
plt.close()

# Close MetaTrader 5
mt5.shutdown()


# Assign descriptive names to the hidden states
state_labels = {}
for state in range(10):  # Assuming 10 states
    if state in df['average_state'].unique():
        label = f"State {state}: "  # You can customize this description based on your observations
        if state_returns[state] > 0:
            label += "Uptrend"
        else:
            label += "Downtrend"
        state_labels[state] = label
    else:
        state_labels[state] = f"State {state}: Not present"

# Print the states and their descriptive labels
print("\nDescription of Hidden States:")
for state, label in state_labels.items():
    print(f"{label} (State ID: {state})")

# Close MetaTrader 5 connection
mt5.shutdown()

# Finally, close the output file
sys.stdout.close()
sys.stdout = sys.__stdout__
这个脚本在初始条件下得出了以下结果:
timeframe = mt5.TIMEFRAME_H4
start_date = "2020-01-01"
end_date = "2023-12-31"
Average Transition Matrix:
average_transition_matrix[0][0] = 0.15741321;
average_transition_matrix[0][1] = 0.07086962;
average_transition_matrix[0][2] = 0.16785905;
average_transition_matrix[0][3] = 0.08792403;
average_transition_matrix[0][4] = 0.11101073;
average_transition_matrix[0][5] = 0.05415263;
average_transition_matrix[0][6] = 0.08019415;
.....
average_transition_matrix[9][3] = 0.13599698;
average_transition_matrix[9][4] = 0.12947508;
average_transition_matrix[9][5] = 0.06385211;
average_transition_matrix[9][6] = 0.09042617;
average_transition_matrix[9][7] = 0.16088280;
average_transition_matrix[9][8] = 0.06588065;
average_transition_matrix[9][9] = 0.04559230;

Average Means Matrix:
average_means_matrix[0][0] = 0.06871601;
average_means_matrix[0][1] = 0.14572210;
average_means_matrix[0][2] = 0.05961646;
average_means_matrix[1][0] = 0.06903949;
average_means_matrix[1][1] = 1.05226034;
.....
average_means_matrix[7][2] = 0.00453701;
average_means_matrix[8][0] = -0.38270747;
average_means_matrix[8][1] = 0.86916742;
average_means_matrix[8][2] = -0.58792329;
average_means_matrix[9][0] = -0.16057267;
average_means_matrix[9][1] = 1.17106076;
average_means_matrix[9][2] = 0.18531821;

Average Covariance Matrix:
average_covariance_matrix[0][0][0] = 1.25299224e+00;
average_covariance_matrix[0][0][1] = -4.05453267e-02;
average_covariance_matrix[0][0][2] = 7.95036804e-02;
average_covariance_matrix[0][1][0] = -4.05453267e-02;
average_covariance_matrix[0][1][1] = 1.63177290e-01;
average_covariance_matrix[0][1][2] = 1.58609858e-01;
average_covariance_matrix[0][2][0] = 7.95036804e-02;
average_covariance_matrix[0][2][1] = 1.58609858e-01;
average_covariance_matrix[0][2][2] = 8.09678270e-01;
average_covariance_matrix[1][0][0] = 1.23040552e+00;
average_covariance_matrix[1][0][1] = 2.52108300e-02;
....
average_covariance_matrix[9][0][0] = 5.47457383e+00;
average_covariance_matrix[9][0][1] = -1.22088743e-02;
average_covariance_matrix[9][0][2] = 2.56784647e-01;
average_covariance_matrix[9][1][0] = -1.22088743e-02;
average_covariance_matrix[9][1][1] = 4.65227101e-01;
average_covariance_matrix[9][1][2] = -2.88257686e-01;
average_covariance_matrix[9][2][0] = 2.56784647e-01;
average_covariance_matrix[9][2][1] = -2.88257686e-01;
average_covariance_matrix[9][2][2] = 1.44717234e+00;

Description of Hidden States:
State 0: Not present (State ID: 0)
State 1: Downtrend (State ID: 1)
State 2: Uptrend (State ID: 2)
State 3: Downtrend (State ID: 3)
State 4: Uptrend (State ID: 4)
State 5: Uptrend (State ID: 5)
State 6: Uptrend (State ID: 6)
State 7: Downtrend (State ID: 7)
State 8: Uptrend (State ID: 8)
State 9: Not present (State ID: 9)
要使用它,我们只需要修改用于获取数据的货币符号、状态的数量以及获取数据的日期范围。我们还需要在EA和两个Python脚本中调整时间周期(时间框架)(所有脚本和EA的时间周期必须一致)。
这个脚本将生成10个模型,并对它们进行平均以获得一个稳健的模型(如果我们只生成两个模型,这两组矩阵会有所不同)(生成矩阵需要一些时间)。最终,你会得到矩阵、三张图表(我将解释为什么这些图表很重要)、隐藏状态的描述以及一个包含矩阵的.txt文件。
结果
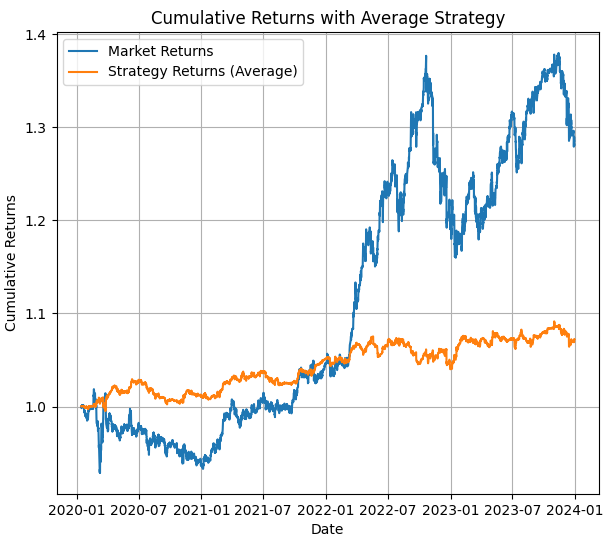
在第一张图中,我们可以看到使用平均HMM模型进行回测的结果,你可以看到价格值以及在该期间使用HMM策略的回测结果。
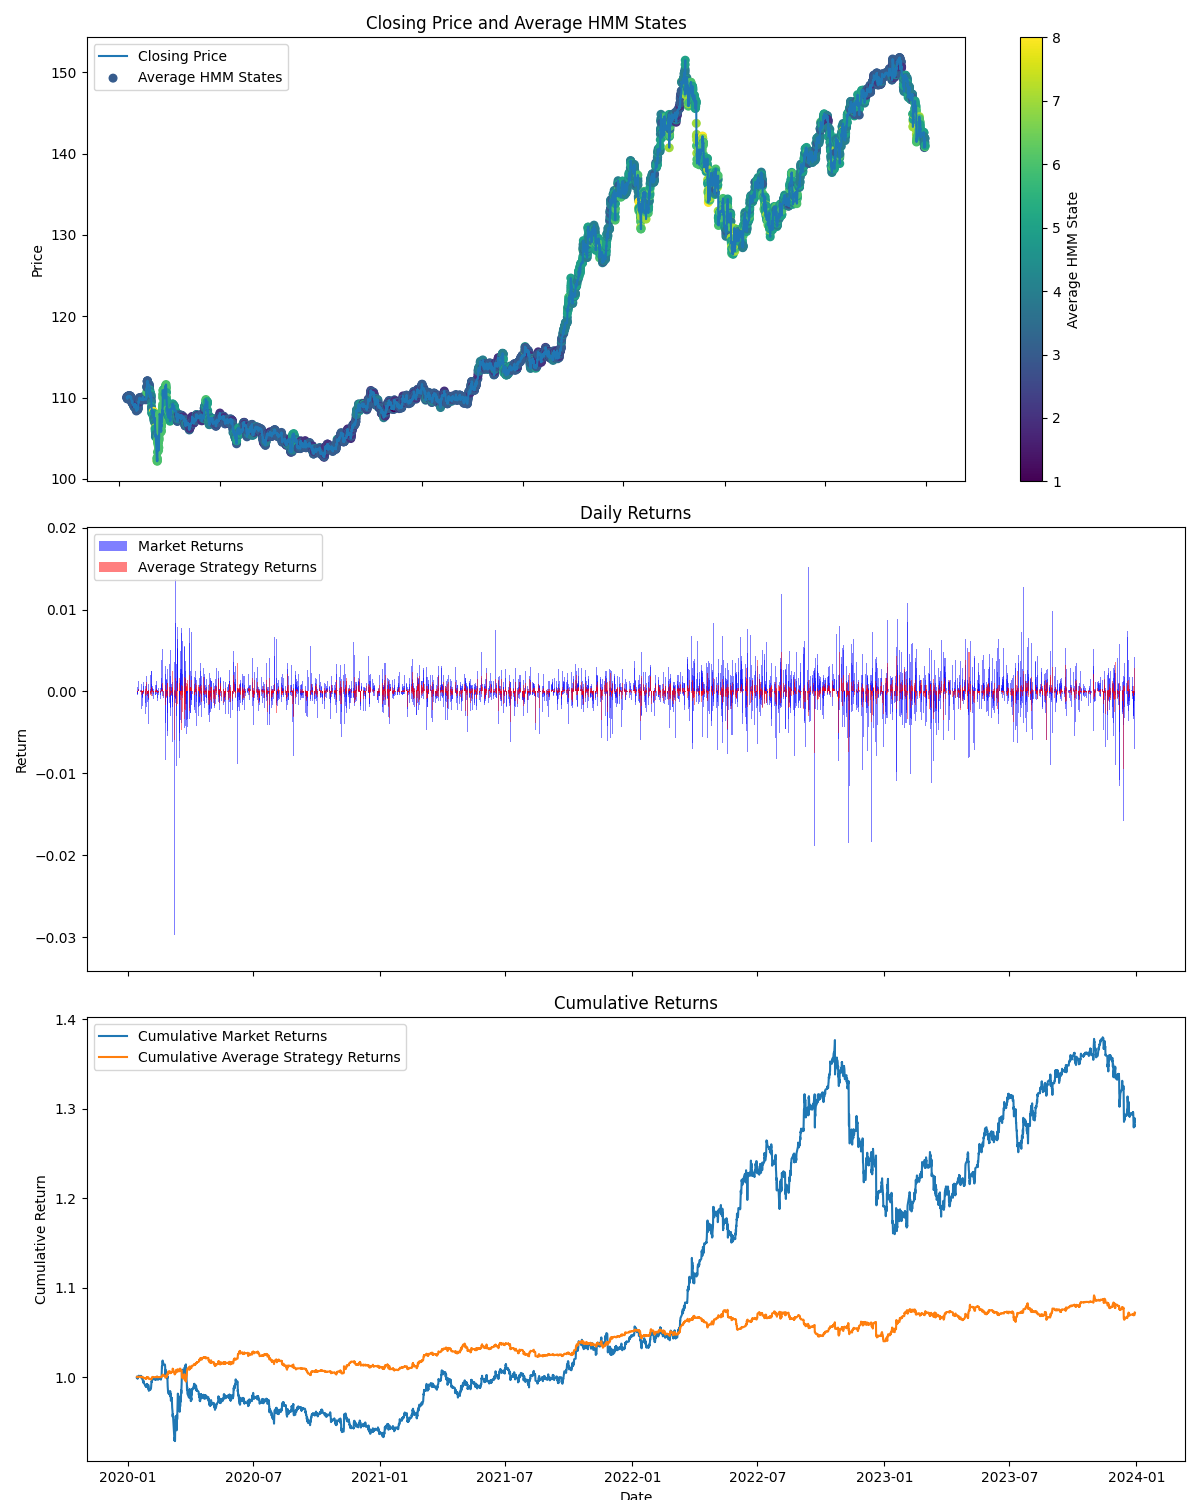
在第二张图中,我们可以看到在测试期间的回测结果,以及一张重要的图,它展示了隐藏状态的使用位置(你可以看到它们何时出现上升趋势、下降趋势、盘整或中性)。
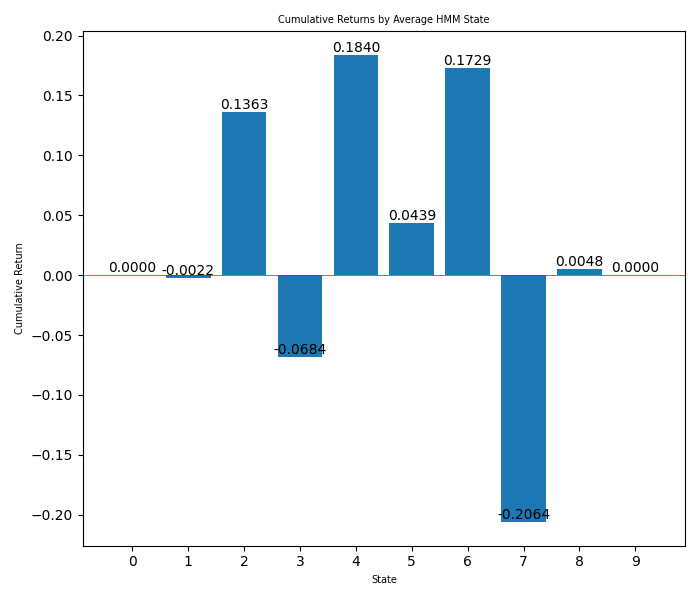
在第三张图中,你可以看到每个隐藏状态的收益柱状图。
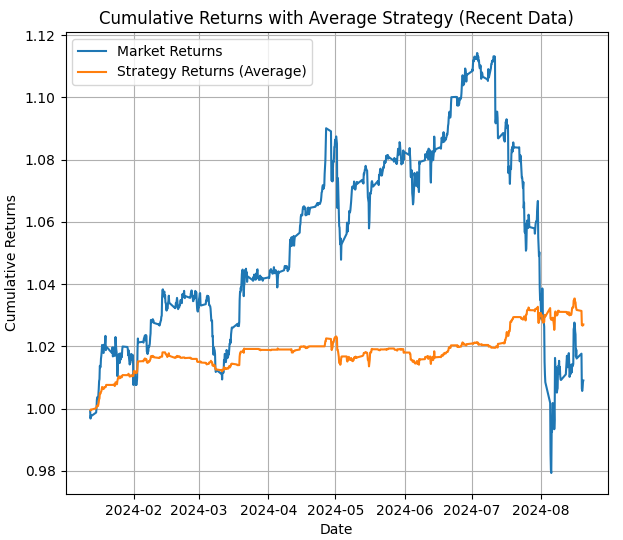
第四张图显示了从最后日期到今天的策略平均回报(如果我们不调整状态,这就是我们在MetaTrader 5回测中可以预期的策略表现)。
现在我们有了所有这些信息,可以用它来选择我们将要使用的隐藏状态,并且我们可以知道隐藏状态何时处于趋势中(通过第二张图)以及何时盈利(通过柱状图)。因此,我们将用这些信息在EA中切换状态。
从柱状图中可以看到我们想要使用的隐藏状态是:2、3和7,它们可能分别对应于盘整、上升趋势和下降趋势,也可能是高趋势。现在我们可以在EA中设置策略,考虑到其他隐藏状态并不盈利(我们可以进行多次回测,以确定最佳匹配)。
所有Python脚本都使用了Python 3.10。
我们可以将矩阵添加到EA中(逐个组件添加,因为Python显示矩阵的方式与MQL5不同),但由于我们不想做的太复杂,我们将使用下一个脚本来将矩阵修改为MQL5格式,以便在EA中使用。这是用于矩阵格式化的EA:
import re
import os

def read_file(filename):
    if not os.path.exists(filename):
        print(f"Error: The file {filename} does not exist.")
        return None
    try:
        with open(filename, "r") as file:
            return file.read()
    except Exception as e:
        print(f"Error reading the file: {str(e)}")
        return None

def parse_matrix(file_content, matrix_name):
    pattern = rf"{matrix_name}\[(\d+)\]\[(\d+)\]\s*=\s*([-+]?(?:\d*\.\d+|\d+)(?:e[-+]?\d+)?)"
    matches = re.findall(pattern, file_content)
    matrix = {}
    for match in matches:
        i, j, value = int(match[0]), int(match[1]), float(match[2])
        if i not in matrix:
            matrix[i] = {}
        matrix[i][j] = value
    return matrix

def parse_covariance_matrix(file_content):
    pattern = r"average_covariance_matrix\[(\d+)\]\[(\d+)\]\[(\d+)\]\s*=\s*([-+]?(?:\d*\.\d+|\d+)(?:e[-+]?\d+)?)"
    matches = re.findall(pattern, file_content)
    matrix = {}
    for match in matches:
        i, j, k, value = int(match[0]), int(match[1]), int(match[2]), float(match[3])
        if i not in matrix:
            matrix[i] = {}
        if j not in matrix[i]:
            matrix[i][j] = {}
        matrix[i][j][k] = value
    return matrix

def format_matrix(matrix, is_3d=False):
    if not matrix:
        return "{     };"

    formatted = "{\n"
    for i in sorted(matrix.keys()):
        if is_3d:
            formatted += "        {  "
            for j in sorted(matrix[i].keys()):
                formatted += "{" + ", ".join(f"{matrix[i][j][k]:.8e}" for k in sorted(matrix[i][j].keys())) + "}"
                if j < max(matrix[i].keys()):
                    formatted += ",\n           "
            formatted += "}"
        else:
            formatted += "        {" + ", ".join(f"{matrix[i][j]:.8f}" for j in sorted(matrix[i].keys())) + "}"
        if i < max(matrix.keys()):
            formatted += ","
        formatted += "\n"
    formatted += "     };"
    return formatted

def main():
    input_filename = "USDJPY_output.txt"
    output_filename = "formatted_matrices.txt"
    content = read_file(input_filename)

    if content is None:
        return

    print(f"Input file size: {len(content)} bytes")
    print("First 200 characters of the file:")
    print(content[:200])

    transition_matrix = parse_matrix(content, "average_transition_matrix")
    means_matrix = parse_matrix(content, "average_means_matrix")
    covariance_matrix = parse_covariance_matrix(content)

    print(f"\nElements found in the transition matrix: {len(transition_matrix)}")
    print(f"Elements found in the means matrix: {len(means_matrix)}")
    print(f"Elements found in the covariance matrix: {len(covariance_matrix)}")

    output = "Transition Matrix:\n"
    output += format_matrix(transition_matrix)
    output += "\n\nMeans Matrix:\n"
    output += format_matrix(means_matrix)
    output += "\n\nCovariance Matrix:\n"
    output += format_matrix(covariance_matrix, is_3d=True)

    try:
        with open(output_filename, "w") as outfile:
            outfile.write(output)
        print(f"\nFormatted matrices saved in '{output_filename}'")
    except Exception as e:
        print(f"Error writing the output file: {str(e)}")

    print(f"\nFirst lines of the output file '{output_filename}':")
    output_content = read_file(output_filename)
    if output_content:
        print("\n".join(output_content.split("\n")[:20]))  # Display the first 20 lines

if __name__ == "__main__":
    main()
我们也可以使用套接字(套接字是利用外部数据与MetaTrader 5进行交互的好方法)来导入矩阵。你可以按照这篇文章中解释的那样操作:使用套接字进行Twitter情绪分析 - MQL5文章,甚至可以添加市场情绪分析(如该文章中所述),以获得更好的趋势头寸。
这个脚本将给我们一个.txt文件,其内容将类似于以下内容:
Transition Matrix:
{
        {0.15741321, 0.07086962, 0.16785905, 0.08792403, 0.11101073, 0.05415263, 0.08019415, 0.12333382, 0.09794255, 0.04930020},
        {0.16646033, 0.11065086, 0.10447035, 0.13332935, 0.09136784, 0.08351764, 0.06722600, 0.09893912, 0.07936700, 0.06467150},
        {0.14182826, 0.15400641, 0.13617941, 0.08453877, 0.09214389, 0.04040276, 0.09065499, 0.11526167, 0.06725810, 0.07772574},
        {0.15037837, 0.09101998, 0.09552059, 0.10035540, 0.12851236, 0.05000596, 0.09542873, 0.12606514, 0.09394759, 0.06876588},
        {0.15552336, 0.08663776, 0.15694344, 0.09219379, 0.08785893, 0.08381830, 0.05572122, 0.10309824, 0.08512219, 0.09308276},
        {0.19806868, 0.11292565, 0.11482367, 0.08324432, 0.09808519, 0.06727817, 0.11549253, 0.10657752, 0.06889919, 0.03460507},
        {0.12257742, 0.11257625, 0.11910078, 0.07669820, 0.16660657, 0.04769350, 0.09667861, 0.12241177, 0.04856867, 0.08708823},
        {0.14716725, 0.12232022, 0.11135735, 0.08488571, 0.06274817, 0.07390905, 0.10742571, 0.12550373, 0.11431005, 0.05037277},
        {0.11766333, 0.11533807, 0.15497601, 0.14017237, 0.11214274, 0.04885795, 0.08394306, 0.12864406, 0.06945878, 0.02880364},
        {0.13559147, 0.07444276, 0.09785968, 0.13599698, 0.12947508, 0.06385211, 0.09042617, 0.16088280, 0.06588065, 0.04559230}
     };

Means Matrix:
{
        {0.06871601, 0.14572210, 0.05961646},
        {0.06903949, 1.05226034, -0.25687024},
        {-0.04607112, -0.00811718, 0.06488246},
        {-0.01769149, 0.63694700, 0.26965491},
        {-0.01874345, 0.58917438, -0.22484670},
        {-0.02026370, 1.09022869, 0.86790417},
        {-0.85455759, 0.48710677, 0.08980023},
        {-0.02589947, 0.84881170, 0.00453701},
        {-0.38270747, 0.86916742, -0.58792329},
        {-0.16057267, 1.17106076, 0.18531821}
     };

Covariance Matrix:
{
        {  {1.25299224e+00, -4.05453267e-02, 7.95036804e-02},
           {-4.05453267e-02, 1.63177290e-01, 1.58609858e-01},
           {7.95036804e-02, 1.58609858e-01, 8.09678270e-01}},
        {  {1.23040552e+00, 2.52108300e-02, 1.17595322e-01},
           {2.52108300e-02, 3.00175953e-01, -8.11027442e-02},
           {1.17595322e-01, -8.11027442e-02, 1.42259217e+00}},
        {  {1.76376507e+00, -7.82189996e-02, 1.89340073e-01},
           {-7.82189996e-02, 2.56222155e-01, -1.30202288e-01},
           {1.89340073e-01, -1.30202288e-01, 6.60591043e-01}},
        {  {9.08926052e-01, 3.02606081e-02, 1.03549625e-01},
           {3.02606081e-02, 2.30324420e-01, -5.46541678e-02},
           {1.03549625e-01, -5.46541678e-02, 7.40333449e-01}},
        {  {8.80590495e-01, 7.21102489e-02, 3.40982555e-02},
           {7.21102489e-02, 3.26639817e-01, -1.06663221e-01},
           {3.40982555e-02, -1.06663221e-01, 9.55477387e-01}},
        {  {3.19499555e+00, -8.63552078e-02, 5.03260281e-01},
           {-8.63552078e-02, 2.92184645e-01, 1.03141313e-01},
           {5.03260281e-01, 1.03141313e-01, 1.88060098e+00}},
        {  {3.22276957e+00, -6.37618091e-01, 3.80462477e-01},
           {-6.37618091e-01, 4.96770891e-01, -5.79521882e-02},
           {3.80462477e-01, -5.79521882e-02, 1.05061090e+00}},
        {  {2.16098355e+00, 4.02611831e-02, 3.01261346e-01},
           {4.02611831e-02, 4.83773367e-01, 7.20003108e-02},
           {3.01261346e-01, 7.20003108e-02, 1.32262495e+00}},
        {  {4.00745050e+00, -3.90316434e-01, 7.28032792e-01},
           {-3.90316434e-01, 6.01214190e-01, -2.91562862e-01},
           {7.28032792e-01, -2.91562862e-01, 1.30603500e+00}},
        {  {5.47457383e+00, -1.22088743e-02, 2.56784647e-01},
           {-1.22088743e-02, 4.65227101e-01, -2.88257686e-01},
           {2.56784647e-01, -2.88257686e-01, 1.44717234e+00}}
     };
这是我们将要在EA中使用的矩阵格式。
现在我们有了两个负相关的且协整的货币对。我们对其中一个货币对进行了HMM分析(我们只需要对其中一个进行分析,因为我们知道这两个货币是相关的),并且由于它们是负相关的,当我们假设其中一个将会上涨(通过HMM分析)时,我们将应用纳什均衡理论,如果一切正确,我们将卖出另一个货币。
我们可以用更多的货币来实现这一点(如果它们是正相关的,就朝相同方向买入;如果是负相关的,就卖出)。
但首先,我用Python编写了一个脚本来展示结果,并尝试调整隐藏状态。脚本如下:
import MetaTrader5 as mt5
import numpy as np
import pandas as pd
from hmmlearn import hmm
import matplotlib.pyplot as plt
from datetime import datetime

# Function to load matrices from the .txt file
def parse_matrix_block(lines, start_idx, matrix_type="normal"):
    matrix = []
    i = start_idx
    while i < len(lines) and not lines[i].strip().startswith("};"):
        line = lines[i].strip().replace("{", "").replace("}", "").replace(";", "")
        if line:  # Ensure the line is not empty
            if matrix_type == "covariance":
                # Split the line into elements
                elements = [float(x) for x in line.split(',') if x.strip()]
                matrix.append(elements)
            else:
                row = [float(x) for x in line.split(',') if x.strip()]  # Filter out empty values
                matrix.append(row)
        i += 1
    return np.array(matrix), i

def load_matrices(file_path):
    with open(file_path, 'r') as file:
        lines = file.readlines()

    transition_matrix = []
    means_matrix = []
    covariance_matrix = []

    i = 0
    while i < len(lines):
        line = lines[i].strip()

        if line.startswith("Transition Matrix:"):
            transition_matrix, i = parse_matrix_block(lines, i + 1)
            i += 1  # Move forward to avoid repeating the same block

        elif line.startswith("Means Matrix:"):
            means_matrix, i = parse_matrix_block(lines, i + 1)
            i += 1

        elif line.startswith("Covariance Matrix:"):
            covariance_matrix = []
            i += 1
            while i < len(lines) and not lines[i].strip().startswith("};"):
                block, i = parse_matrix_block(lines, i, matrix_type="covariance")
                covariance_matrix.append(block)
                i += 1
            covariance_matrix = np.array(covariance_matrix)
            covariance_matrix = covariance_matrix.reshape(-1, 3, 3)

        i += 1

    return transition_matrix, means_matrix, covariance_matrix

# Load the matrices from the .txt file
transition_matrix, means_matrix, covariance_matrix = load_matrices('formatted_matrices.txt')

# Connect to MetaTrader 5
if not mt5.initialize():
    print("initialize() failed, error code =", mt5.last_error())
    quit()

# Set parameters to retrieve data
symbol = "USDJPY"  # You can change to your desired symbol
timeframe = mt5.TIMEFRAME_H4  # You can change the timeframe
start_date = datetime(2024, 1, 1)
end_date = datetime.now()

# Load data from MetaTrader 5
rates = mt5.copy_rates_range(symbol, timeframe, start_date, end_date)
mt5.shutdown()

# Convert the data to a pandas DataFrame
data = pd.DataFrame(rates)
data['time'] = pd.to_datetime(data['time'], unit='s')
data.set_index('time', inplace=True)

# Use only the closing prices column
prices = data['close'].values.reshape(-1, 1)

# Create and configure the HMM model
n_components = len(transition_matrix)
model = hmm.GaussianHMM(n_components=n_components, covariance_type="full")
model.startprob_ = np.full(n_components, 1/n_components)  # Initial probabilities
model.transmat_ = transition_matrix
model.means_ = means_matrix
model.covars_ = covariance_matrix

# Fit the model using the loaded prices
model.fit(prices)

# Predict hidden states
hidden_states = model.predict(prices)

# Manual configuration of states
bullish_states = [2,4,5,6,8]  # States considered bullish
bearish_states = [1,3,7]  # States considered bearish
exclude_states = [0,9]  # States to exclude (neither buy nor sell)

# HMM strategy:
hmm_returns = np.zeros_like(prices)
for i in range(1, len(prices)):
    if hidden_states[i] in bullish_states:  # Buy if the state is bullish
        hmm_returns[i] = prices[i] - prices[i-1]
    elif hidden_states[i] in bearish_states:  # Sell if the state is bearish
        hmm_returns[i] = prices[i-1] - prices[i]
    # If the state is in exclude_states, do nothing

# Buy and hold strategy (holding)
holding_returns = prices[-1] - prices[0]

# Plot results
plt.figure(figsize=(7, 8))
plt.plot(data.index, prices, label='Price of '+str(symbol), color='black', linestyle='--')
plt.plot(data.index, np.cumsum(hmm_returns), label='HMM Strategy', color='green')
plt.axhline(holding_returns, color='blue', linestyle='--', label='Buy and Hold Strategy (Holding)')
plt.title('Backtesting Comparison: HMM vs Holding and Price')
plt.legend()
plt.savefig("playground.png")

# Print accumulated returns of both strategies
print(f"Accumulated returns of the HMM strategy: {np.sum(hmm_returns)}")
print(f"Accumulated returns of the Holding strategy: {holding_returns[0]}")
让我们来看一下这个脚本。它打开包含矩阵的.txt文件,从MetaTrader 5下载该货币对的数据,并使用我们在其他脚本中使用的最后日期到今天的数据,来看HMM是如何工作的。结果会以.png格式显示,我们还可以更改状态。使用第二个脚本输出的全部状态,让我们看看结果是怎样的:
从第二个脚本中:
Description of Hidden States:
State 0: Not present (State ID: 0)
State 1: Downtrend (State ID: 1)
State 2: Uptrend (State ID: 2)
State 3: Downtrend (State ID: 3)
State 4: Uptrend (State ID: 4)
State 5: Uptrend (State ID: 5)
State 6: Uptrend (State ID: 6)
State 7: Downtrend (State ID: 7)
State 8: Uptrend (State ID: 8)
State 9: Not present (State ID: 9)
结果如下:
HMM策略的累积回报:-1.0609999999998365
持有策略的累积回报: 5.284999999999997

如你所见,这个策略并不理想。那么,让我们来调整隐藏状态(我们将使用条形图来选择,我们会排除第七个状态):
# Manual configuration of states
bullish_states = [2,4,5,6,8]  # States considered bullish
bearish_states = [1,3]  # States considered bearish
exclude_states = [0,7,9]  # States to exclude (neither buy nor sell)
HMM策略的累积回报:7.978000000000122
持有策略的累积回报:5.284999999999997
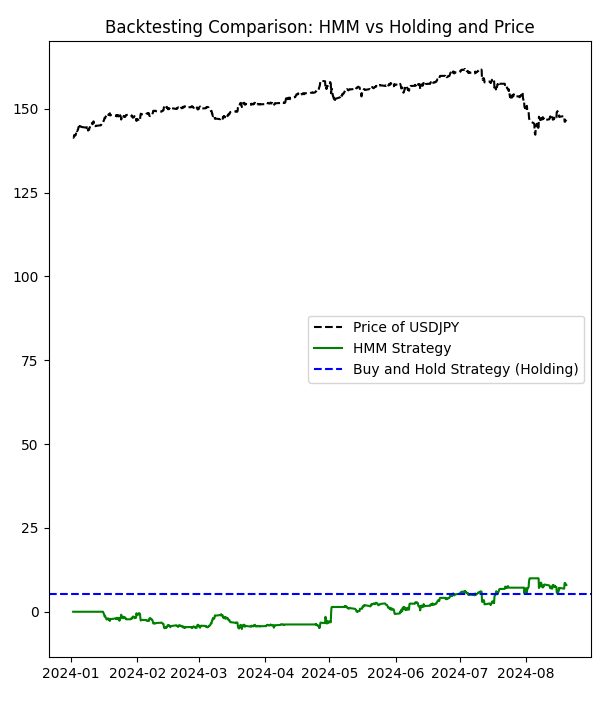
我们从中学到当不使用最差的隐藏状态时,我们可以拥有一个更有利可图的策略。
同样,再次强调,将深度学习应用于此可能会更有助于发现初始货币对(在本例中为 USDJPY)的模式。也许,我们会在其他时候尝试一下。
在MQL5中的实现
纳什EA是为MetaTrader 5平台设计的一种复杂的算法交易系统。其核心是,EA采用多策略方法,结合了隐马尔可夫模型(HMM)、对数似然分析、趋势强度评估以及纳什均衡概念,以在外汇市场中做出交易决策。
EA首先初始化关键参数和指标。它设置了必要的移动平均线(EMA)、相对强弱指数(RSI)、平均真实范围(ATR)和布林带。这些技术指标构成了EA市场分析的基础。初始化过程还涉及设置隐马尔可夫模型参数,这些参数是EA预测能力的核心。
EA的一个关键特点是其市场状态检测系统。该系统利用HMM和对数似然方法将当前市场状态分类为三种类型:上升趋势、下降趋势或不存在(中性)。状态检测过程涉及复杂的发射概率和状态转移计算,为市场条件提供了细致的视角。
EA实施了四种不同的交易策略:基于HMM的、基于对数似然的、趋势强度和纳什均衡。每种策略生成自己的交易信号,然后对这些信号进行加权并组合,以形成全面的交易决策。特别是纳什均衡策略,旨在找到与其他策略之间的最佳平衡,寻求更稳健的交易决策。
风险管理是纳什EA的一个重要方面。它包含了基于账户余额和策略表现的动态手数调整、止损和获利水平以及跟踪止损机制等功能。这些风险管理工具旨在保护资本,同时在有利的市场条件下允许潜在的利润。
EA还包括回测功能,允许交易者评估其在历史数据上的表现。该功能为每种策略计算各种表现指标,包括利润、总交易次数、盈利交易次数和胜率。这些全面的测试能力使交易者能够微调EA的参数以获得最佳表现。
在其主操作循环中,纳什EA在每个新的K线上处理市场数据。它重新计算市场状态,更新策略信号,并根据所有启用策略的集体输出做出交易决策。EA旨在成对开设头寸,可能会同时交易主要货币对和EURCHF,这可能是对冲或基于相关性的策略的一部分。
最后,EA包含了强大的错误处理和日志记录功能。它持续检查有效的指标值,确保终端和EA设置允许交易,并提供其操作和决策过程的详细日志。这使得调试和性能分析更加容易。
我们现在来看一些重要的函数和纳什均衡:
用于在该EA中实现纳什均衡概念的主要函数是:
- CalculateStrictNashEquilibrium()
这是计算严格纳什均衡的主要函数。以下是其实现:
void CalculateStrictNashEquilibrium()
{
   double buySignal = 0;
   double sellSignal = 0;

   // Sum the weighted signals of the enabled strategies
   for(int i = 0; i < 3; i++) // Consider only the first 3 strategies for Nash equilibrium
   {
      if(strategies[i].enabled)
      {
         buySignal += strategies[i].weight * (strategies[i].signal > 0 ? 1 : 0);
         sellSignal += strategies[i].weight * (strategies[i].signal < 0 ? 1 : 0);
      }
   }

   // If there's a stronger buy signal than sell signal, set Nash Equilibrium signal to buy
   if(buySignal > sellSignal)
   {
      strategies[3].signal = 1; // Buy signal
   }
   else if(sellSignal > buySignal)
   {
      strategies[3].signal = -1; // Sell signal
   }
   else
   {
      // If there's no clear signal, force a decision based on an additional criterion
      double closePrice = iClose(_Symbol, PERIOD_CURRENT, 0);
      double openPrice = iOpen(_Symbol, PERIOD_CURRENT, 0);
      strategies[3].signal = (closePrice > openPrice) ? 1 : -1;
   }
}
说明:
- 这个函数根据前三种策略的加权信号计算买入和卖出信号。
- 它比较买入和卖出信号,以确定纳什均衡的行动。
- 如果信号相等,它将根据当前价格方向做出决策。
- SimulateTrading()
虽然这个函数并不专门用于纳什均衡,但它实现了包括纳什均衡在内的交易逻辑。
void SimulateTrading(MarketRegime actualTrend, datetime time, string symbol)
{
   double buySignal = 0;
   double sellSignal = 0;

   for(int i = 0; i < ArraySize(strategies); i++)
   {
      if(strategies[i].enabled)
      {
         if(strategies[i].signal > 0)
            buySignal += strategies[i].weight * strategies[i].signal;
         else if(strategies[i].signal < 0)
            sellSignal -= strategies[i].weight * strategies[i].signal;
      }
   }

   // ... (code to simulate trades and calculate profits)
}
说明:
- 这个函数根据所有策略(包括纳什均衡策略)的信号进行交易模拟。
- 它计算所有启用策略的加权买入和卖出信号。
- OnTick
在OnTick()函数中,实现了基于纳什均衡执行交易的逻辑:
void OnTick()
{
   // ... (other code)

   // Check if the Nash Equilibrium strategy has generated a signal
   if(strategies[3].enabled && strategies[3].signal != 0)
   {
      if(strategies[3].signal > 0)
      {
         OpenBuyOrder(strategies[3].name);
      }
      else if(strategies[3].signal < 0)
      {
         OpenSellOrder(strategies[3].name);
      }
   }

   // ... (other code)
}
说明:
- 这个函数检查纳什均衡策略(它是策略数组中的第三个策略)是否启用并生成了信号。
- 如果存在买入信号(signal > 0),它将开启一个买入订单。
- 如果存在卖出信号(signal < 0),它将开启一个卖出订单。
总结来说,纳什均衡在这个EA中被实现为其中一种交易策略。CalculateStrictNashEquilibrium()函数根据其他策略的信号确定纳什均衡信号。然后在OnTick()函数中使用该信号来做出交易决策。这种实现旨在找到不同策略之间的平衡,从而做出更稳健的交易决策。
将纳什均衡应用于交易策略的方法是博弈论在金融市场中的有趣应用。它试图通过考虑不同交易信号之间的相互作用来找到最优策略,这类似于在一个多人游戏中找到一种均衡,其中每个“玩家”都是一种不同的交易策略。
DetectMarketRegime函数:这个函数对于EA的决策过程至关重要。它使用技术指标和复杂的统计模型分析当前市场状况,以确定市场状态。
void DetectMarketRegime(MarketRegime &hmmRegime, MarketRegime &logLikelihoodRegime)
{
    // Calculate indicators
    double fastEMA = iMAGet(fastEMAHandle, 0);
    double slowEMA = iMAGet(slowEMAHandle, 0);
    double rsi = iRSIGet(rsiHandle, 0);
    double atr = iATRGet(atrHandle, 0);
    double price = SymbolInfoDouble(_Symbol, SYMBOL_BID);

    // Calculate trend strength and volatility ratio
    double trendStrength = (fastEMA - slowEMA) / slowEMA;
    double volatilityRatio = atr / price;

    // Normalize RSI
    double normalizedRSI = (rsi - 50) / 25;

    // Calculate features for HMM
    double features[3] = {trendStrength, volatilityRatio, normalizedRSI};

    // Calculate log-likelihood and HMM likelihoods
    double logLikelihood[10];
    double hmmLikelihoods[10];
    CalculateLogLikelihood(features, symbolParams.emissionMeans, symbolParams.emissionCovs);
    CalculateHMMLikelihoods(features, symbolParams.emissionMeans, symbolParams.emissionCovs, symbolParams.transitionProb, 10, hmmLikelihoods);

    // Determine regimes based on maximum likelihood
    int maxLogLikelihoodIndex = ArrayMaximum(logLikelihood);
    int maxHmmLikelihoodIndex = ArrayMaximum(hmmLikelihoods);

    logLikelihoodRegime = InterpretRegime(maxLogLikelihoodIndex);
    hmmRegime = InterpretRegime(maxHmmLikelihoodIndex);


    // ... (confidence calculation code)
}
这个函数结合技术指标、隐马尔可夫模型以及对数似然分析来确定当前的市场状态。这是一种复杂的市场分析方法,为市场状况提供了细致的视角。
CalculateStrategySignals函数:这个函数根据当前的市场状态和技术指标,为EA的每种策略计算交易信号。
void CalculateStrategySignals(string symbol, datetime time, MarketRegime hmmRegime, MarketRegime logLikelihoodRegime)
{
    if(strategies[0].enabled) // HMM Strategy
    {
        CalculateHMMSignal();
    }

    if(strategies[1].enabled) // LogLikelihood Strategy
    {
        CalculateLogLikelihoodSignal();
    }

    if(strategies[2].enabled) // Trend Strength
    {
        double trendStrength = CalculateTrendStrength(PERIOD_CURRENT);
        strategies[2].signal = NormalizeTrendStrength(trendStrength);
    }

    if(strategies[3].enabled) // Nash Equilibrium
    {
        CalculateStrictNashEquilibrium();
    }
}
这个函数为每种启用的策略计算信号,整合各种分析方法以形成全面的交易决策。
SimulateTrading函数:这个函数根据计算出的信号进行交易模拟,并更新每种策略的表现指标。
void SimulateTrading(MarketRegime actualTrend, datetime time, string symbol)
{
    double buySignal = 0;
    double sellSignal = 0;

    for(int i = 0; i < ArraySize(strategies); i++)
    {
        if(strategies[i].enabled)
        {
            if(strategies[i].signal > 0)
                buySignal += strategies[i].weight * strategies[i].signal;
            else if(strategies[i].signal < 0)
                sellSignal -= strategies[i].weight * strategies[i].signal;
        }
    }

    // Simulate trade execution and calculate profits
    // ... (trade simulation code)

    // Update strategy performance metrics
    // ... (performance update code)
}
这个函数对于回测和评估EA的表现至关重要。它根据计算出的信号进行交易模拟,并更新每种策略的表现指标。
CalculateHMMLikelihoods函数:这个函数利用隐马尔可夫模型计算不同市场状态的可能性。
void CalculateHMMLikelihoods(const double &features[], const double &means[], const double &covs[], const double &transitionProb[], int numStates, double &hmmLikelihoods[])
{
    // Initialize and calculate initial likelihoods
    // ... (initialization code)

    // Forward algorithm to calculate HMM likelihoods
    for(int t = 1; t < ArraySize(features) / 3; t++)
    {
        // ... (HMM likelihood calculation code)
    }

    // Normalize and validate likelihoods
    // ... (normalization and validation code)
}
这个函数实现了隐马尔可夫模型的前向算法,用于计算不同市场状态的可能性。这是一种基于观测特征预测市场行为的复杂方法。
这些函数构成了纳什专家顾问分析和决策过程的核心。本EA的优势在于它将传统的技术分析与隐马尔可夫模型和纳什均衡概念等高级统计方法相结合。这种多策略方法,加上强大的回测和风险管理功能,使其成为外汇市场算法交易的潜在有力工具。
这个EA最重要的特点是它的自适应性。通过持续评估市场状态并根据表现调整策略权重,它旨在在不同的市场条件下保持有效性。然而,至关重要的是,尽管这种系统很复杂,但需要仔细监控并定期重新校准,以确保它们在不断变化的市场环境中保持有效。
结果
采用这些设置

以及这些输入参数
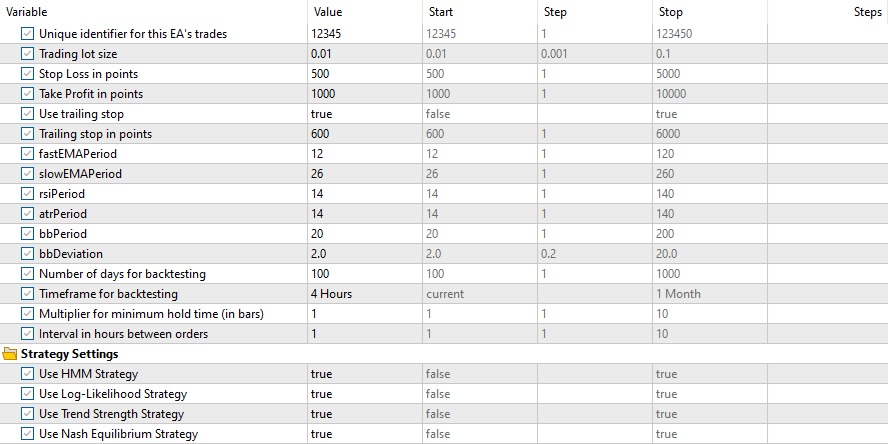
所有策略的结果如下:
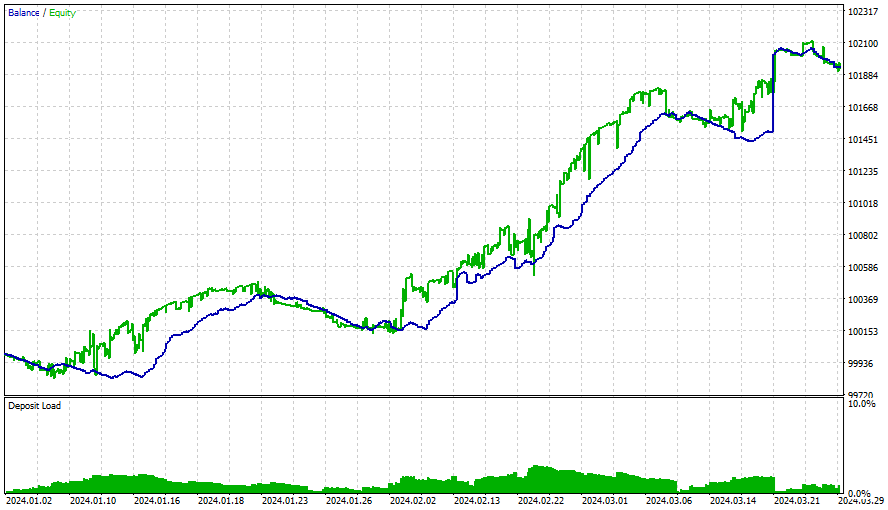
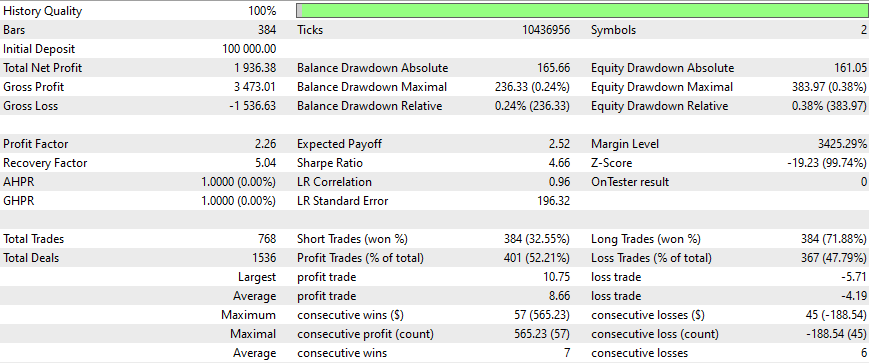
在这段时间之后,盈利速度放缓了,应该每3个月进行一次优化(采用所有这些初始条件)。这些策略很简单,使用了一个非常简单且固定的跟踪止损。通过更多的优化、更新的矩阵以及更复杂、更精细的策略,可以获得更好的结果。我们还必须考虑将情绪分析和深度学习添加到这个EA中,同时不要忘记之前提到的内容。
所有策略都需要纳什均衡才能正常工作。
结论
博弈论与交易的结合为提升市场策略提供了令人兴奋的机会。通过应用纳什均衡理论,交易者可以做出更周密的决策,考虑市场中其他参与者可能采取的行动。本文概述了如何使用Python和MetaTrader 5实现这些概念,为那些希望提升交易方法的人提供了一套强大的工具。随着市场的不断演变,整合纳什均衡等数学理论可能是实现交易持续成功的关键差异化因素。
希望您喜欢阅读这篇文章,或者重播这篇文章,我希望这将对您自己的EA有所帮助,这是一个有趣的主题,我希望它达到了您的期望,并且您喜欢它,就像我喜欢制作它一样。
本文由MetaQuotes Ltd译自英文
原文地址: https://www.mql5.com/en/articles/15541
注意: MetaQuotes Ltd.将保留所有关于这些材料的权利。全部或部分复制或者转载这些材料将被禁止。
本文由网站的一位用户撰写,反映了他们的个人观点。MetaQuotes Ltd 不对所提供信息的准确性负责,也不对因使用所述解决方案、策略或建议而产生的任何后果负责。
 在MQL5中实现基于抛物线转向指标(Parabolic SAR)和简单移动平均线(SMA)的快速交易策略算法
 数据科学和机器学习(第 28 部分):使用 AI 预测 EURUSD 的多个期货


我花了一整天的时间来弄懂你的代码。Python 部分的说明很清楚,我也能复制几乎与你完全相同的回溯测试 结果。然而,文章的后半部分却相当晦涩难懂,几乎没有解释对冲交易统计套利背后的逻辑,以及博弈论究竟是如何应用的。
下面是我在使用你的代码时遇到的两个问题:
isPositiveDefinite() 函数旨在检查单个 3×3 协方差矩阵是否为正定矩阵。但是,在 InitializeHMM 中,您向 isPositiveDefinite() 传递的是整个 emissionCovs 数组,而不是单个 3×3 矩阵。
量化策略信号的方法也有缺陷。策略对数似然和策略趋势输出的信号完全相同,而 HMM 信号似乎无关紧要。从字面上看,关闭 HMM 信号不会改变任何东西,但你的整篇文章都围绕着 HMM 实现。
你的策略基于套利,手数应该是其中的关键部分。你确实有一个 calculateLotSize() 函数,但在你的演示中并没有使用。你真的相信散户交易者会交易几乎每一根 4 小时蜡烛线吗?后来的回溯测试结果并没有盈利,但你却声称应该每隔几个月就优化一次。但到底要优化什么呢?指标周期?
我读过你的很多文章,它们大多都很有趣。但是,我认为这篇文章的结构并不完善,我建议读者不要像我一样在这上面浪费太多时间。我真心希望你今后能保持文章的质量。
以下是我在使用你的代码时遇到问题的两个例子:
isPositiveDefinite() 函数旨在检查单个 3×3 协方差矩阵是否为正定矩阵。但是,在 InitializeHMM 中,您向 isPositiveDefinite() 传递的是整个 emissionCovs 数组,而不是单个 3×3 矩阵。
量化策略信号的方法也有缺陷。策略对数似然和策略趋势输出的信号完全相同,而 HMM 信号似乎无关紧要。从字面上看,关闭 HMM 信号并不会改变任何事情,但你的整篇文章都围绕 HMM 实现展开。
你的策略基于套利,手数应该是其中的关键部分。你确实有一个 calculateLotSize() 函数,但在你的演示中并没有使用。你真的相信散户交易者会交易几乎每一根 4 小时蜡烛线吗?后来的回溯测试结果并没有盈利,但你却声称应该每隔几个月就优化一次。但到底要优化什么呢?指标周期?
我读过你的很多文章,它们大多都很有趣。但是,我认为这篇文章的结构并不完善,我建议读者不要像我一样在这上面浪费太多时间。我真心希望你今后能保持文章的质量。
我也花了很多时间,这个代码并不清晰,甚至有些错误