
使用PSAR、Heiken Ashi和深度学习进行交易
概述
找到优势可能是成功与失败的关键。鉴于可用数据量庞大,交易者越来越多地转向深度学习等先进技术以获得优势。这一过程涉及将传统技术分析工具与现代人工智能(AI)模型相结合,以快速评估和适应市场条件。为探索这种潜力,我们开发了一个Python脚本,旨在将深度学习的预测能力与经过验证的交易指标相结合。该脚本并非旨在成为完整的交易系统;它是一个用于快速实验的工具——一种快速测试交易策略是否具有盈利能力的方法。同时,一款MQL5脚本依托相同的核心逻辑,将这一策略框架无缝嵌入实时交易场景,为交易者打通了一条从理论回测到实战交易的闭环通路。
制作深度学习ONNX模型
在快节奏的外汇交易世界中,保持领先至关重要。这就是我们开发一个Python脚本,利用深度学习的能力来预测货币对走势的原因。让我们愉快地浏览这段令人兴奋的代码,看看它是如何施展魔法的!
脚本从导入所有必要的工具开始——可以将其视为为复杂的配方准备食材。我们使用TensorFlow和Keras等库,它们是许多现代AI应用背后的主力军。我们还使用MetaTrader 5获取真实的外汇数据。
import MetaTrader5 as mt5
import tensorflow as tf
import numpy as np
import pandas as pd
import tf2onnx
import keras
接下来,我们设置一些重要的参数。我们查看欧元兑美元(EURUSD)货币对过去120天的历史数据。为什么是120天?因为这是一个平衡点,它为我们提供了足够的历史数据来识别模式,同时又不会使模型不堪重负。
然后,我们使用MetaTrader 5来获取这些数据。可以将其想象为派遣一名时间旅行者回到过去,收集过去120天的价格信息。一旦我们有了这些数据,我们就将其组织整理成AI能够理解的格式。
inp_history_size = 120

sample_size = inp_history_size*3*20
symbol = "EURUSD"
optional = "D1_2024"
inp_model_name = str(symbol)+"_"+str(optional)+".onnx"

if not mt5.initialize():
    print("initialize() failed, error code =",mt5.last_error())
    quit()

# we will save generated onnx-file near the our script to use as resource
from sys import argv
data_path=argv[0]
last_index=data_path.rfind("\\")+1
data_path=data_path[0:last_index]
print("data path to save onnx model",data_path)

# and save to MQL5\Files folder to use as file
terminal_info=mt5.terminal_info()
file_path=terminal_info.data_path+"\\MQL5\\Files\\"
print("file path to save onnx model",file_path)

# set start and end dates for history data
from datetime import timedelta, datetime
#end_date = datetime.now()
end_date = datetime(2024, 1, 1, 0)
start_date = end_date - timedelta(days=inp_history_size*20*3)

# print start and end dates
print("data start date =",start_date)
print("data end date =",end_date)

# get rates
eurusd_rates = mt5.copy_rates_from(symbol, mt5.TIMEFRAME_D1, end_date, sample_size)
原始金融数据可能是杂乱无章的,因此我们需要对其进行清理。我们专注于收盘价——这是每个交易日的最终价格。我们还将这些数据缩放到0到1之间。这一步至关重要,因为它有助于我们的AI模型更有效地学习,类似于将所有内容翻译成一种通用语言。
from sklearn.preprocessing import MinMaxScaler
scaler=MinMaxScaler(feature_range=(0,1))
scaled_data = scaler.fit_transform(data)
我们不希望我们的模型只是记住数据,因此我们将数据分成两部分:训练数据(80%)和测试数据(20%)。这就好比给我们的AI学生一本教科书来学习(训练数据),然后通过一个单独的测验来检验它的知识水平(测试数据)。
# scale data
from sklearn.preprocessing import MinMaxScaler
scaler=MinMaxScaler(feature_range=(0,1))
scaled_data = scaler.fit_transform(data)

# training size is 80% of the data
training_size = int(len(scaled_data)*0.80)
print("Training_size:",training_size)
train_data_initial = scaled_data[0:training_size,:]
test_data_initial = scaled_data[training_size:,:1]

# split a univariate sequence into samples
def split_sequence(sequence, n_steps):
    X, y = list(), list()
    for i in range(len(sequence)):
       # find the end of this pattern
       end_ix = i + n_steps
       # check if we are beyond the sequence
       if end_ix > len(sequence)-1:
          break
       # gather input and output parts of the pattern
       seq_x, seq_y = sequence[i:end_ix], sequence[end_ix]
       X.append(seq_x)
       y.append(seq_y)
    return np.array(X), np.array(y)

# split into samples
time_step = inp_history_size
x_train, y_train = split_sequence(train_data_initial, time_step)
x_test, y_test = split_sequence(test_data_initial, time_step)

# reshape input to be [samples, time steps, features] which is required for LSTM
x_train =x_train.reshape(x_train.shape[0],x_train.shape[1],1)
x_test = x_test.reshape(x_test.shape[0],x_test.shape[1],1)
现在来到了重要的部分——构建我们的AI模型!我们使用了多种AI技术的组合:
- 卷积神经网络(CNNs):它们擅长在序列中发现模式,就像我们的眼睛在图像中发现模式一样。
- 长短期记忆(LSTM)网络:它们擅长理解数据中的长期依赖关系,非常适合发现随时间变化的趋势。
- 全连接层(Dense layers):这些层帮助我们的模型做出最终预测。
我们还添加了一些丢弃层(dropout layers),以防止模型变得过于自信导致数据“过拟合”。
# define model
from keras.models import Sequential
from keras.layers import Dense, Activation, Conv1D, MaxPooling1D, Dropout, Flatten, LSTM
from keras.metrics import RootMeanSquaredError as rmse
from tensorflow.keras import callbacks
model = Sequential()
model.add(Conv1D(filters=256, kernel_size=2, strides=1, padding='same', activation='relu', input_shape=(inp_history_size,1)))
model.add(MaxPooling1D(pool_size=2))
model.add(LSTM(100, return_sequences = True))
model.add(Dropout(0.3))
model.add(LSTM(100, return_sequences = False))
model.add(Dropout(0.3))
model.add(Dense(units=1, activation = 'sigmoid'))
model.compile(optimizer='adam', loss= 'mse' , metrics = [rmse()])

# Set up early stopping
early_stopping = callbacks.EarlyStopping(
    monitor='val_loss',
    patience=20,
    restore_best_weights=True,
)

# model training for 300 epochs
history = model.fit(x_train, y_train, epochs = 300 , validation_data = (x_test,y_test), batch_size=32, callbacks=[early_stopping], verbose=2)
训练模型就像是送我们的AI去上学。我们多次(最多300个周期)展示我们的训练数据,使其逐渐学会根据过去的模式预测未来的价格。我们使用一种称为“提前停止”的方法,以确保AI不会学习太久,从而开始记忆而不是学习。
训练完成后,我们测试模型的性能。我们使用RMSE(均方根误差)等指标来查看预测与实际价格的接近程度。这就好比给AI的测试结果打分。
# evaluate training data
train_loss, train_rmse = model.evaluate(x_train,y_train, batch_size = 32)
print(f"train_loss={train_loss:.3f}")
print(f"train_rmse={train_rmse:.3f}")

# evaluate testing data
test_loss, test_rmse = model.evaluate(x_test,y_test, batch_size = 32)
print(f"test_loss={test_loss:.3f}")
print(f"test_rmse={test_rmse:.3f}")
最后一步是将我们训练好的模型转换为ONNX格式。ONNX就像是AI模型的通用语言——它允许我们的模型在不同的环境中使用,包括MetaTrader脚本。
# Define a function that represents your model
@tf.function(input_signature=[tf.TensorSpec([None, inp_history_size, 1], tf.float32)])
def model_function(x):
    return model(x)

output_path = data_path+inp_model_name
# Convert the model to ONNX
onnx_model, _ = tf2onnx.convert.from_function(
    model_function,
    input_signature=[tf.TensorSpec([None, inp_history_size, 1], tf.float32)],
    opset=13,
    output_path=output_path
)

print(f"Saved ONNX model to {output_path}")


# save model to ONNX
output_path = data_path+inp_model_name
onnx_model = tf2onnx.convert.from_keras(model, output_path=output_path)
print(f"saved model to {output_path}")

output_path = file_path+inp_model_name
onnx_model = tf2onnx.convert.from_keras(model, output_path=output_path)
print(f"saved model to {output_path}")
我们不仅仅停留在数字上——还创建了几张图表来可视化模型的表现如何。这些图表展示了模型的学习进度以及其预测与实际价格的对比情况。
到这个脚本结束时,我们就拥有了一个强大的ONNX模型,准备好用于外汇交易策略。它基于历史的欧元兑美元数据训练,可以帮助预测未来的价格走势。
请记住,尽管这个模型很复杂,但它并不是水晶球。外汇市场受到许多复杂因素的影响。始终将AI预测作为交易工具箱中的众多工具之一,并且永远不要忘记风险管理的重要性。
测试策略的Python脚本
该Python脚本本质上是一种快速测试交易策略是否具有盈利潜力的方法。它并不是一个完整的交易系统,而是一个用于快速实验的工具。通过结合深度学习模型与技术分析,它旨在快速测试市场中是否存在可行的优势,而不必一开始就陷入复杂的优化中。
脚本首先连接到MetaTrader 5以获取欧元兑美元的历史价格数据。它使用小时数据来捕捉短期走势,并应用Heikin Ashi蜡烛图来平滑市场中的噪音。这有助于更清晰地识别趋势,这对于快速测试策略至关重要。它还叠加了一些知名的技术指标,如PSAR、SMA、RSI和ATR。这些指标作为对市场条件的快速检查,为模型做出买入和卖出决策提供了参考依据。
import MetaTrader5 as mt5
import pandas as pd
import numpy as np
import onnxruntime as ort
from sklearn.preprocessing import MinMaxScaler
from ta.trend import PSARIndicator, SMAIndicator
from ta.momentum import RSIIndicator
from ta.volatility import AverageTrueRange
import matplotlib.pyplot as plt

# Inicializar conexión con MetaTrader5
if not mt5.initialize():
    print("Inicialización fallida")
    mt5.shutdown()

def get_historical_data(symbol, timeframe, start_date, end_date):
    rates = mt5.copy_rates_range(symbol, timeframe, start_date, end_date)
    df = pd.DataFrame(rates)
    df['time'] = pd.to_datetime(df['time'], unit='s')
    df.set_index('time', inplace=True)
    return df

def calculate_heikin_ashi(df):
    ha_close = (df['open'] + df['high'] + df['low'] + df['close']) / 4
    ha_open = (df['open'].shift(1) + df['close'].shift(1)) / 2
    ha_high = df[['high', 'open', 'close']].max(axis=1)
    ha_low = df[['low', 'open', 'close']].min(axis=1)

    df['ha_close'] = ha_close
    df['ha_open'] = ha_open
    df['ha_high'] = ha_high
    df['ha_low'] = ha_low
    return df

def add_indicators(df):
    # Calcular Heikin Ashi
    df = calculate_heikin_ashi(df)

    # PSAR con parámetros ajustados
    psar = PSARIndicator(df['high'], df['low'], df['close'], step=0.02, max_step=0.2)
    df['psar'] = psar.psar()

    # Añadir SMA
    sma = SMAIndicator(df['close'], window=50)
    df['sma'] = sma.sma_indicator()

    # Añadir RSI
    rsi = RSIIndicator(df['close'], window=14)
    df['rsi'] = rsi.rsi()

    # Añadir ATR para medir volatilidad
    atr = AverageTrueRange(df['high'], df['low'], df['close'], window=14)
    df['atr'] = atr.average_true_range()

    # Añadir filtro de tendencia simple
    df['trend'] = np.where(df['close'] > df['sma'], 1, -1)

    return df
脚本的核心在于其使用预训练的ONNX深度学习模型。通过对数据进行缩放并将其输入到该模型中,脚本生成对市场下一步走势的预测。它将这些预测与技术指标相结合,创建一套基本的交易规则。例如,当某些条件一致时,比如价格高于移动平均线且RSI显示市场并未超买,它会寻找做多的机会。反之,当满足相反的条件时,它会发出做空的信号。脚本甚至增加了自适应止损和获利机制来管理风险,尽管这些机制保持相对简单,以维持脚本对快速测试的专注。
def prepare_data(df, window_size=120):
    scaler = MinMaxScaler(feature_range=(0, 1))
    scaled_data = scaler.fit_transform(df[['close']])

    X = []
    for i in range(window_size, len(scaled_data)):
        X.append(scaled_data[i-window_size:i])

    return np.array(X), scaler

def load_onnx_model(model_path):
    return ort.InferenceSession(model_path)

def predict_with_onnx(model, input_data):
    input_name = model.get_inputs()[0].name
    output_name = model.get_outputs()[0].name
    return model.run([output_name], {input_name: input_data})[0]

def backtest(df, model, scaler, window_size=120, initial_balance=10000):
    scaled_data = scaler.transform(df[['close']])

    predictions = []
    for i in range(window_size, len(scaled_data)):
        X = scaled_data[i-window_size:i].reshape(1, window_size, 1)
        pred = predict_with_onnx(model, X.astype(np.float32))
        predictions.append(scaler.inverse_transform(pred.reshape(-1, 1))[0, 0])

    df['predictions'] = [np.nan]*window_size + predictions

    # Nueva lógica de trading
    df['position'] = 0
    long_condition = (
        (df['close'] > df['predictions']) &
        (df['close'] > df['psar']) &
        (df['close'] > df['sma']) &
        (df['rsi'] < 60) &  # Condición RSI menos estricta
        (df['ha_close'] > df['ha_open']) &
        (df['ha_close'].shift(1) > df['ha_open'].shift(1)) &
        (df['trend'] == 1)  # Solo comprar en tendencia alcista
    )
    short_condition = (
        (df['close'] < df['predictions']) &
        (df['close'] < df['psar']) &
        (df['close'] < df['sma']) &
        (df['rsi'] > 40) &  # Condición RSI menos estricta
        (df['ha_close'] < df['ha_open']) &
        (df['ha_close'].shift(1) < df['ha_open'].shift(1)) &
        (df['trend'] == -1)  # Solo vender en tendencia bajista
    )

    df.loc[long_condition, 'position'] = 1  # Compra
    df.loc[short_condition, 'position'] = -1  # Venta

    # Implementar stop-loss y take-profit adaptativos
    sl_atr_multiple = 2
    tp_atr_multiple = 3

    for i in range(window_size, len(df)):
        if df['position'].iloc[i-1] != 0:
            entry_price = df['close'].iloc[i-1]
            current_atr = df['atr'].iloc[i-1]
            if df['position'].iloc[i-1] == 1:  # Posición larga
                sl_price = entry_price - sl_atr_multiple * current_atr
                tp_price = entry_price + tp_atr_multiple * current_atr
                if df['low'].iloc[i] < sl_price or df['high'].iloc[i] > tp_price:
                    df.loc[df.index[i], 'position'] = 0
            else:  # Posición corta
                sl_price = entry_price + sl_atr_multiple * current_atr
                tp_price = entry_price - tp_atr_multiple * current_atr
                if df['high'].iloc[i] > sl_price or df['low'].iloc[i] < tp_price:
                    df.loc[df.index[i], 'position'] = 0

    df['returns'] = df['close'].pct_change()
    df['strategy_returns'] = df['position'].shift(1) * df['returns']

    # Calcular balance
    df['cumulative_returns'] = (1 + df['strategy_returns']).cumprod()
    df['balance'] = initial_balance * df['cumulative_returns']

    return df
在结果方面,该脚本为策略的表现提供了一个快速概览。在该案例中,实现了1.35%的总回报率,这意味着在测试期间,将10,000美元变成了10,135.02美元。尽管这不是一个惊人的收益,但它是一个积极的结果,表明该策略确实有一定的价值。夏普比率(Sharpe Ratio)是衡量经风险调整后的回报的常用指标,其结果为0.39。这一数字表明,尽管有收益,但这些收益伴随着相当程度的风险。对于一个快速测试而言,这一比率是衡量该策略是否值得进一步探索的有用方式。
Retorno total: 1.35%
Ratio de Sharpe: 0.39
Balance final: $10135.02
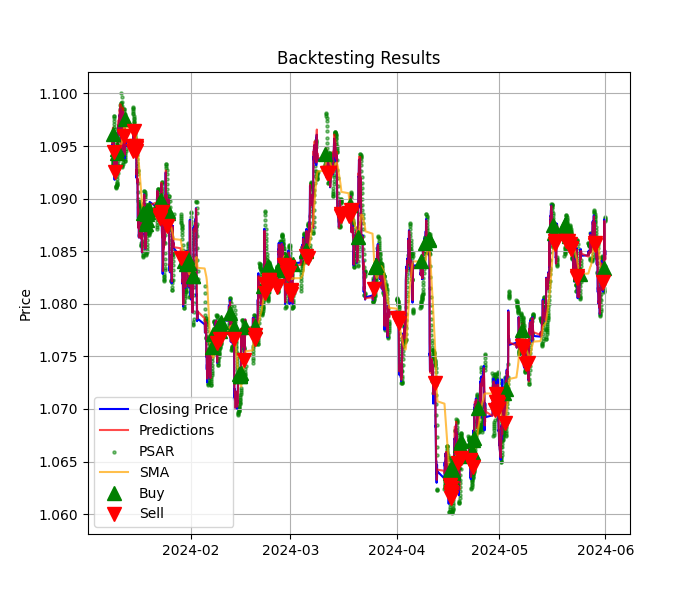
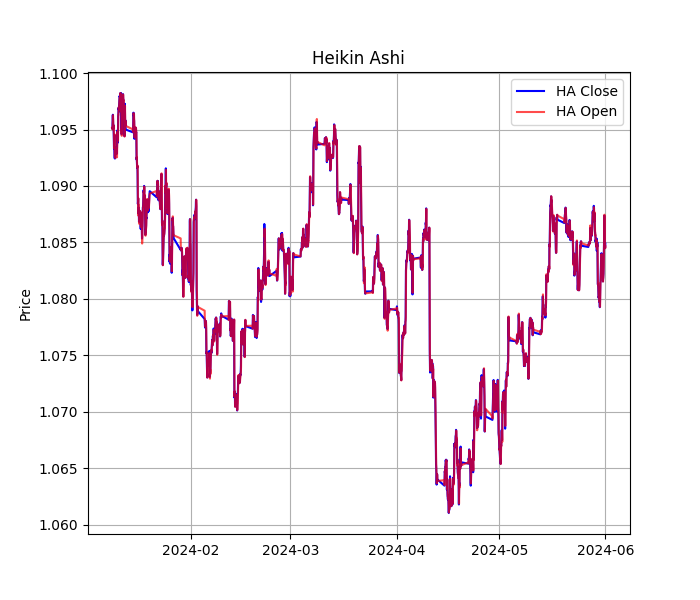
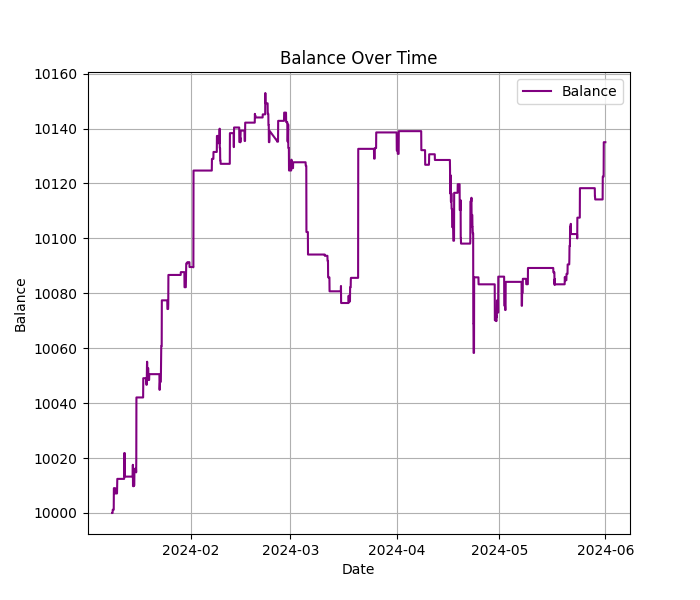
该脚本生成的可视化图表为策略的表现情况提供了直观且有用的概览。第一张图表展示了市场价格、模型预测以及买入和卖出信号之间的相互作用。Heikin Ashi图表提供了更清晰的市场趋势视图,帮助您查看策略是否捕捉到了正确进入和退出交易的时机。最后,权益曲线直观地展示了账户余额随时间的变化,突出了增长期和回撤期。
总之,该脚本旨在快速实验。它帮助您快速评估策略是否有潜力,而无需深入微调。虽然该策略可以产生一些利润,但适度的夏普比率说明仍有改进空间。这使其成为一个有用的起点——一种快速确定策略是否值得更深入开发和优化的方法。
EA
这个MetaTrader 5脚本旨在通过结合技术分析和深度学习模型,快速测试交易策略是否能够盈利。此处的目标并不是创建一个无懈可击的交易系统,而是尝试将传统交易指标与机器学习的力量结合起来,看看市场中是否存在优势。
该脚本专注于欧元兑美元货币对,并使用H6(6小时)时间框架。它首先设置了一些熟悉的技术指标,如RSI、SMA、PSAR和ATR。这些是交易者用来衡量市场动量、趋势方向和波动性的常用工具。除此之外,还使用了Heikin Ashi的K线图,这些K线图有助于平滑价格走势,通过减少市场噪音,使趋势更容易被发现。这样的初始设置为脚本试图实现的目标奠定了基础:一种系统化寻找买入和卖出机会的方法。
int    handleRSI, handleSMA, handlePSAR, handleATR;
double rsiBuffer[], smaBuffer[], psarBuffer[], atrBuffer[];
double haOpen[], haClose[], haHigh[], haLow[];
CTrade trade;
   handleRSI = iRSI(Symbol, Timeframe, RSIPeriod, PRICE_CLOSE);
   handleSMA = iMA(Symbol, Timeframe, SMAPeriod, 0, MODE_SMA, PRICE_CLOSE);
   handlePSAR = iSAR(Symbol, Timeframe, PSARStep, PSARMaximum);
   handleATR = iATR(Symbol, Timeframe, ATRPeriod);

   if(handleRSI == INVALID_HANDLE || handleSMA == INVALID_HANDLE ||
      handlePSAR == INVALID_HANDLE || handleATR == INVALID_HANDLE)
     {
      Print("Error creating indicators");
      return(INIT_FAILED);
     }

   ArraySetAsSeries(rsiBuffer, true);
   ArraySetAsSeries(smaBuffer, true);
   ArraySetAsSeries(psarBuffer, true);
   ArraySetAsSeries(atrBuffer, true);

   ArrayResize(haOpen, 3);
   ArrayResize(haClose, 3);
   ArrayResize(haHigh, 3);
   ArrayResize(haLow, 3);
   ArraySetAsSeries(haOpen, true);
   ArraySetAsSeries(haClose, true);
   ArraySetAsSeries(haHigh, true);
   ArraySetAsSeries(haLow, true);
   IndicatorRelease(handleRSI);
   IndicatorRelease(handleSMA);
   IndicatorRelease(handlePSAR);
   IndicatorRelease(handleATR);
该脚本的独特之处在于它使用了一个预训练的ONNX深度学习模型。不仅仅依赖于传统技术分析,而是利用机器学习的预测能力来预测价格走势。该脚本将此模型直接加载到交易环境中,模型接收最近的市场数据,对其进行归一化,并预测价格是会上涨、下跌还是保持不变。然后,这一预测被归类为三个类别之一:向上运动、向下运动或根本没有显著运动。通过将这些预测与技术指标相结合,脚本旨在做出更明智的交易决策。
#define SAMPLE_SIZE 120

long     ExtHandle=INVALID_HANDLE;
int      ExtPredictedClass=-1;
datetime ExtNextBar=0;
datetime ExtNextDay=0;
float    ExtMin=0.0;
float    ExtMax=0.0;
CTrade   ExtTrade;
int dlsignal=-1;

//--- price movement prediction
#define PRICE_UP   0
#define PRICE_SAME 1
#define PRICE_DOWN 2

#resource "/Files/EURUSD_D1_2024.onnx" as uchar ExtModel[]
//--- create a model from static buffer
   ExtHandle=OnnxCreateFromBuffer(ExtModel,ONNX_DEFAULT);
   if(ExtHandle==INVALID_HANDLE)
     {
      Print("OnnxCreateFromBuffer error ",GetLastError());
      return(INIT_FAILED);
     }

//--- since not all sizes defined in the input tensor we must set them explicitly
//--- first index - batch size, second index - series size, third index - number of series (only Close)
   const long input_shape[] = {1,SAMPLE_SIZE,1};
   if(!OnnxSetInputShape(ExtHandle,ONNX_DEFAULT,input_shape))
     {
      Print("OnnxSetInputShape error ",GetLastError());
      return(INIT_FAILED);
     }
//--- check new day
   if(TimeCurrent() >= ExtNextDay)
   {
      GetMinMax();
      //--- set next day time
      ExtNextDay = TimeCurrent();
      ExtNextDay -= ExtNextDay % PeriodSeconds(PERIOD_D1);
      ExtNextDay += PeriodSeconds(PERIOD_D1);
   }

   //--- check new bar
   if(TimeCurrent() < ExtNextBar)
      return;

   //--- set next bar time
   ExtNextBar = TimeCurrent();
   ExtNextBar -= ExtNextBar % PeriodSeconds();
   ExtNextBar += PeriodSeconds();

   //--- check min and max
   float close = (float)iClose(_Symbol, _Period, 0);
   if(ExtMin > close)
      ExtMin = close;
   if(ExtMax < close)
      ExtMax = close;
void PredictPrice(void)
  {
   static vectorf output_data(1);            // vector to get result
   static vectorf x_norm(SAMPLE_SIZE);       // vector for prices normalize

//--- check for normalization possibility
   if(ExtMin>=ExtMax)
     {
      Print("ExtMin>=ExtMax");
      ExtPredictedClass=-1;
      return;
     }
//--- request last bars
   if(!x_norm.CopyRates(_Symbol,_Period,COPY_RATES_CLOSE,1,SAMPLE_SIZE))
     {
      Print("CopyRates ",x_norm.Size());
      ExtPredictedClass=-1;
      return;
     }
   float last_close=x_norm[SAMPLE_SIZE-1];
//--- normalize prices
   x_norm-=ExtMin;
   x_norm/=(ExtMax-ExtMin);
//--- run the inference
   if(!OnnxRun(ExtHandle,ONNX_NO_CONVERSION,x_norm,output_data))
     {
      Print("OnnxRun");
      ExtPredictedClass=-1;
      return;
     }
//--- denormalize the price from the output value
   float predicted=output_data[0]*(ExtMax-ExtMin)+ExtMin;
//--- classify predicted price movement
   float delta=last_close-predicted;
   if(fabs(delta)<=0.00001)
      ExtPredictedClass=PRICE_SAME;
   else
     {
      if(delta<0)
         ExtPredictedClass=PRICE_UP;
      else
         ExtPredictedClass=PRICE_DOWN;
     }
  }


//+------------------------------------------------------------------+
//| Gets Min and Max values                                          |
//+------------------------------------------------------------------+
void GetMinMax(void)
  {
   vectorf close;
   close.CopyRates(_Symbol,PERIOD_D1,COPY_RATES_CLOSE,0,SAMPLE_SIZE);
   ExtMin=close.Min();
   ExtMax=close.Max();
  }
交易逻辑相当明确,但又不失复杂性。对于买入(做多)信号,需多个条件同时满足:当前价格应高于PSAR和SMA,RSI应低于60(表明市场未超买),Heikin Ashi蜡烛图应显示上升趋势。至关重要的是,深度学习模型还必须预测价格将上涨。如果所有这些因素都满足,该脚本将开启一个买入头寸。同样地,它寻找相反的条件来开启一个卖出(做空)头寸。这种分层处理的方法旨在过滤掉市场中的噪音(干扰信号)和虚假信号,确保只有在多个指标和模型就市场走势方向达成一致时,才会进行交易。
void CalculateHeikinAshi()
{
   double close[], open[], high[], low[];
   ArraySetAsSeries(close, true);
   ArraySetAsSeries(open, true);
   ArraySetAsSeries(high, true);
   ArraySetAsSeries(low, true);

   int copied = CopyClose(Symbol(), Timeframe, 0, 3, close);
   copied = MathMin(copied, CopyOpen(Symbol(), Timeframe, 0, 3, open));
   copied = MathMin(copied, CopyHigh(Symbol(), Timeframe, 0, 3, high));
   copied = MathMin(copied, CopyLow(Symbol(), Timeframe, 0, 3, low));

   if(copied < 3)
   {
      Print("Not enough data for Heikin Ashi calculation");
      return;
   }

   // Calculate Heikin Ashi values for the last 3 candles
   for(int i = 2; i >= 0; i--)
   {
      haClose[i] = (open[i] + high[i] + low[i] + close[i]) / 4;

      if(i == 2)
      {
         haOpen[i] = (open[i] + close[i]) / 2;
      }
      else
      {
         haOpen[i] = (haOpen[i+1] + haClose[i+1]) / 2;
      }

      haHigh[i] = MathMax(high[i], MathMax(haOpen[i], haClose[i]));
      haLow[i] = MathMin(low[i], MathMin(haOpen[i], haClose[i]));
   }

   // Debug print
   Print("Heikin Ashi values:");
   for(int i = 0; i < 3; i++)
   {
      Print("Candle ", i, ": Open=", haOpen[i], " High=", haHigh[i], " Low=", haLow[i], " Close=", haClose[i]);
   }
}
   // Copy indicator data
   if(CopyBuffer(handleRSI, 0, 0, 3, rsiBuffer) <= 0 ||
      CopyBuffer(handleSMA, 0, 0, 3, smaBuffer) <= 0 ||
      CopyBuffer(handlePSAR, 0, 0, 3, psarBuffer) <= 0 ||
      CopyBuffer(handleATR, 0, 0, 3, atrBuffer) <= 0)
   {
      Print("Failed to copy indicator data");
      return;
   }

   CalculateHeikinAshi();

   if(ArraySize(haOpen) < 3 || ArraySize(haClose) < 3)
   {
      Print("Not enough Heikin Ashi data");
      return;
   }

   PredictPrice();
   int trend = GetTrend();

   bool longCondition = close > psarBuffer[1] &&
                        close > smaBuffer[1] &&
                        rsiBuffer[1] < 60 &&
                        haClose[1] > haOpen[1] &&
                        haClose[2] > haOpen[2] &&
                        ExtPredictedClass == PRICE_UP &&
                        trend == 1;

   bool shortCondition = close < psarBuffer[1] &&
                         close < smaBuffer[1] &&
                         rsiBuffer[1] > 40 &&
                         haClose[1] < haOpen[1] &&
                         haClose[2] < haOpen[2] &&
                         ExtPredictedClass == PRICE_DOWN &&
                         trend == -1;

   // Debug printing
   Print("--- Debug Info ---");
   Print("Close: ", close, " PSAR: ", psarBuffer[1], " SMA: ", smaBuffer[1]);
   Print("RSI: ", rsiBuffer[1], " HA Close[1]: ", haClose[1], " HA Open[1]: ", haOpen[1]);
   Print("HA Close[2]: ", haClose[2], " HA Open[2]: ", haOpen[2]);
   Print("ExtPredictedClass: ", ExtPredictedClass, " Trend: ", trend);
   Print("Long Condition: ", longCondition, " Short Condition: ", shortCondition);

   if(longCondition)
   {
      Print("Long Condition Met");
      if(PositionsTotal() == 0)
      {
         double atrStopLoss = SLATRMultiple * atrBuffer[1];
         double minStopLoss = GetMinimumStopLoss();
         double sl = close - MathMax(atrStopLoss, minStopLoss);
         double tp = close + TPATRMultiple * atrBuffer[1];

         bool result = trade.Buy(0.01, Symbol(), 0, sl, tp);
         if(result)
            Print("Buy order placed successfully. SL: ", sl, " TP: ", tp);
         else
            Print("Failed to place buy order. Error: ", GetLastError());
      }
      else
      {
         Print("Position already open. Skipping buy order.");
      }
   }
   else if(shortCondition)
   {
      Print("Short Condition Met");
      if(PositionsTotal() == 0)
      {
         double atrStopLoss = SLATRMultiple * atrBuffer[1];
         double minStopLoss = GetMinimumStopLoss();
         double sl = close + MathMax(atrStopLoss, minStopLoss);
         double tp = close - TPATRMultiple * atrBuffer[1];

         bool result = trade.Sell(0.01, Symbol(), 0, sl, tp);
         if(result)
            Print("Sell order placed successfully. SL: ", sl, " TP: ", tp);
         else
            Print("Failed to place sell order. Error: ", GetLastError());
      }
      else
      {
         Print("Position already open. Skipping sell order.");
      }
   }

   ManageTrailingStop();
}
该脚本还内置了风险管理功能。它使用平均真实范围(ATR)来设置动态止损和获利水平。通过基于市场波动性设定这些水平,脚本能够适应变化的市场条件,旨在防止重大损失的同时锁定利润。此外,还包括一个跟踪止损机制,当交易向有利方向移动时,会相应调整止损水平,从而进一步保护利润。
double GetMinimumStopLoss()
{
   double spread = SymbolInfoInteger(Symbol(), SYMBOL_SPREAD) * SymbolInfoDouble(Symbol(), SYMBOL_POINT);
   double minStopLevel = SymbolInfoInteger(Symbol(), SYMBOL_TRADE_STOPS_LEVEL) * SymbolInfoDouble(Symbol(), SYMBOL_POINT);
   return MathMax(spread * 2, minStopLevel); // Usamos el doble del spread como mínimo
}

// Agregar esta función para manejar el trailing stop
void ManageTrailingStop()
{
   for(int i = PositionsTotal() - 1; i >= 0; i--)
   {
      if(PositionSelectByTicket(PositionGetTicket(i)))
      {
         if(PositionGetString(POSITION_SYMBOL) == Symbol())
         {
            double positionOpenPrice = PositionGetDouble(POSITION_PRICE_OPEN);
            double currentStopLoss = PositionGetDouble(POSITION_SL);
            double currentTakeProfit = PositionGetDouble(POSITION_TP);

            if(PositionGetInteger(POSITION_TYPE) == POSITION_TYPE_BUY)
            {
               double newStopLoss = NormalizeDouble(SymbolInfoDouble(Symbol(), SYMBOL_BID) - TrailingStop * SymbolInfoDouble(Symbol(), SYMBOL_POINT), Digits());
               if(newStopLoss > currentStopLoss + TrailingStep * SymbolInfoDouble(Symbol(), SYMBOL_POINT))
               {
                  if(trade.PositionModify(PositionGetTicket(i), newStopLoss, currentTakeProfit))
                  {
                     Print("Trailing stop ajustado para posición larga. Nuevo SL: ", newStopLoss);
                  }
               }
            }
            else if(PositionGetInteger(POSITION_TYPE) == POSITION_TYPE_SELL)
            {
               double newStopLoss = NormalizeDouble(SymbolInfoDouble(Symbol(), SYMBOL_ASK) + TrailingStop * SymbolInfoDouble(Symbol(), SYMBOL_POINT), Digits());
               if(newStopLoss < currentStopLoss - TrailingStep * SymbolInfoDouble(Symbol(), SYMBOL_POINT))
               {
                  if(trade.PositionModify(PositionGetTicket(i), newStopLoss, currentTakeProfit))
                  {
                     Print("Trailing stop ajustado para posición corta. Nuevo SL: ", newStopLoss);
                  }
               }
            }
         }
      }
   }
}
简言之,该脚本是一种快速且具有实验性的方法,用于测试交易策略的可行性。它并不旨在成为完美的解决方案,而是一个试验场,看看技术分析和深度学习模型的结合是否能够识别出有利可图的交易机会。虽然它不能保证盈利,但却提供了一种更细化且更明智的交易决策方法,将人类直觉与机器学习的见解相结合。
结果
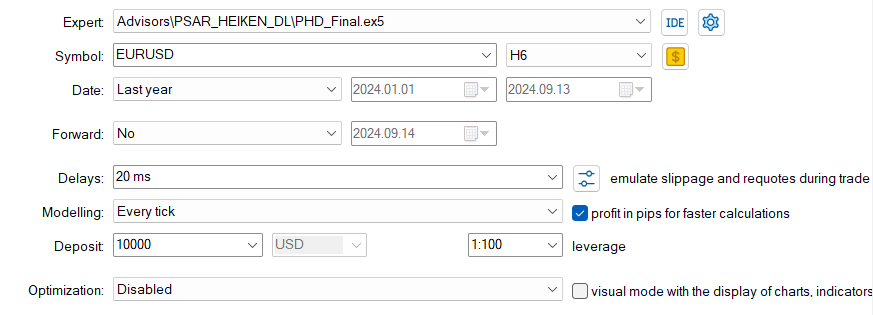
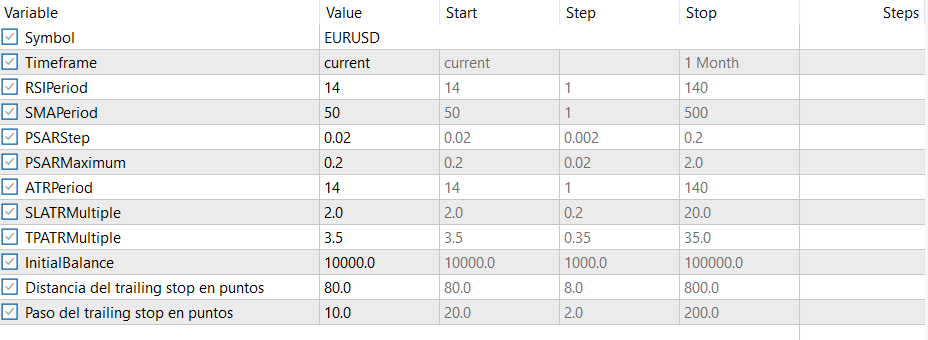
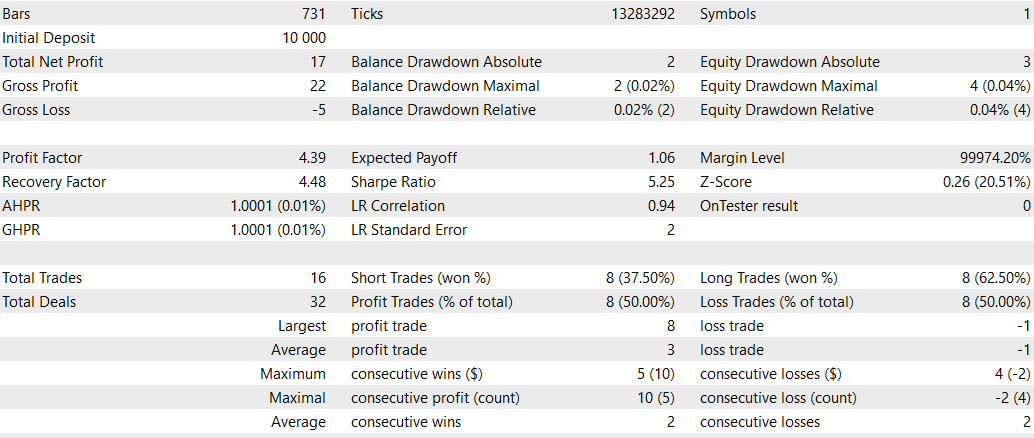
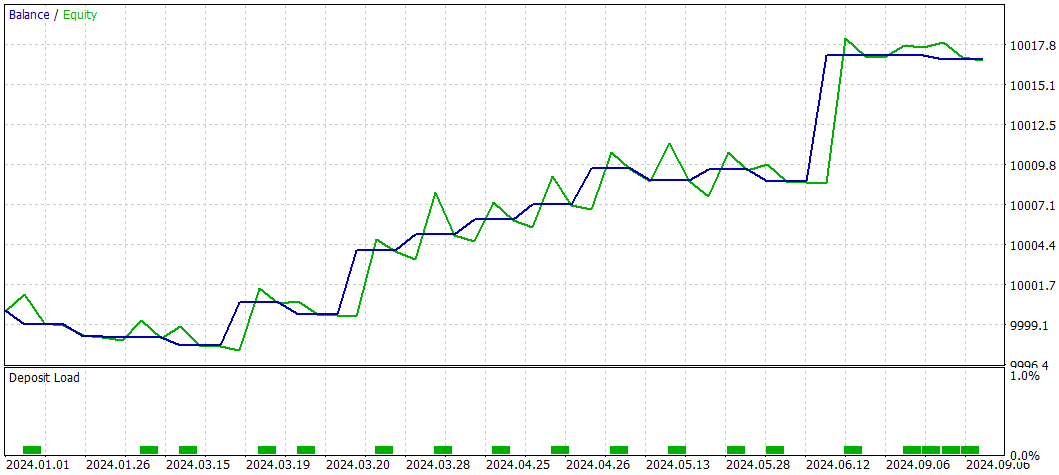
EA的结果,犹如一面多维度棱镜,深度解析了该策略在历史数据模拟中的底层运行逻辑与实战级表现特征。从10,000美元的初始存款开始,该策略实现了17个单位的适度总净盈利,表明尽管它确实产生了利润,但相对于初始投资额度而言,利润相对较小。余额曲线反映了这种逐渐增长,显示出随时间稳定(尽管缓慢)的上升趋势。
其中一个突出的指标是4.39的盈利因子。这是一个相当不错的结果,表明该策略每承担1单位的风险,就能获得4.39单位的回报。它暗示EA在最大化利润方面相对于损失是有效的。4.48的恢复因子进一步支持了这一点,表明该策略能够有效地从回撤中恢复,这是其稳健性的积极信号。然而,值得注意的是5.25的夏普比率。尽管这个比率相对较高,通常表明良好的经风险调整后的回报,但总体上较小的利润表明该策略可能承担了非常小的风险,从而获得有限的绝对利润。
深入交易统计数据,EA总共执行了16笔交易,多头和空头头寸各占一半。多头交易的胜率为62.5%,而空头交易的胜率为37.5%。这种差异表明该策略在捕捉市场向上波动方面更为成功。有趣的是,盈利交易占总交易的50%,这表明EA的盈利能力并非由于高胜率,而是由于其盈利交易相对于亏损交易的规模。最大盈利交易和平均盈利交易均为正值,表明EA在市场有利波动时成功地锁定了收益。余额曲线反映了这些结果,显示出回撤期之后的收益,表明EA采取了一种谨慎但稳定的交易方式。
回撤指标显示EA保持了较低的风险敞口(暴露程度)。余额回撤绝对值为2个单位,相当小,而相对回撤仅为0.02%。如此低的回撤表明EA的策略是保守的,优先考虑资本保值而不是激进的利润追求。这种保守方法在波动市场中可能有益,但也解释了相对较小的总净盈利。
总而言之,EA展示了一种谨慎且系统化的交易方式,专注于保持高盈利因子和最小化回撤。尽管总利润相对较小,但高盈利因子和低回撤表明该策略更注重风险管理而非快速利润生成。这使得EA适合那些优先考虑稳定、低风险增长而非更激进、高风险策略的交易者。然而,对于那些寻求更高绝对回报的人来说,EA可能需要进一步调整或强化,使其在保持其稳健的风险管理体系(框架)的前提下,充分挖掘并提升其盈利潜力。
结论
将深度学习模型与传统技术分析相结合的探索已经展示出令人满意的结果。通过Python脚本,我们看到了如何使用历史数据、关键指标和机器学习的系统化方法来识别潜在的交易机会。该策略的测试结果虽未实现显著突破,但始终保持稳健态势,充分印证了这种组合方式确实能够带来正向收益,不过在实际应用中仍存在一定局限性。同样地,MetaTrader 5的EA也证实了这种保守的方法。尽管该EA在历史回测期间的表现呈现出规模虽小但持续稳定的增长态势,且最大回撤幅度极低,然而这一结果也凸显出该策略的核心定位——优先聚焦于风险控制,而非追求利润最大化。这种保守性使其对优先考虑稳定、低风险增长的交易者具有吸引力。然而,对于那些寻求更高回报的人来说,需要进一步的细化和优化。最终,这些工具构成交易实践的基石——为交易者搭建起一座桥梁,使其将人类直觉的敏锐洞察与AI的强大分析能力深度融合,为应对复杂的外汇交易世界提供了一种更为精细、更具适应性的策略。
本文由MetaQuotes Ltd译自英文
原文地址: https://www.mql5.com/en/articles/15868
注意: MetaQuotes Ltd.将保留所有关于这些材料的权利。全部或部分复制或者转载这些材料将被禁止。
本文由网站的一位用户撰写,反映了他们的个人观点。MetaQuotes Ltd 不对所提供信息的准确性负责,也不对因使用所述解决方案、策略或建议而产生的任何后果负责。
 大气云模型优化(ACMO):理论
 您应当知道的 MQL5 向导技术(第 33 部分):高斯(Gaussian)进程核心
 您应当知道的 MQL5 向导技术(第 34 部分):采用非常规 RBM 进行价格嵌入
 从基础到中级:WHILE 和 DO WHILE 语句