懒惰是进步的动力,或者如何交互性的使用图形
简介
在一个英语论坛上,我看到一个对斐波那契水平解读的有趣描述。大意是脉冲移动的修正趋于 38.2% 和 61.8%之间的区域。在观看了那里上传的视频和自己尝试在图表上绘制斐波那契水平后,我开始在实践中使用该工具。
我不打算停留在该系统的优点和缺点上。我想在这里讲解另一件事。因为我天性懒惰(我应该不是唯一的懒人),在图表上搜索反转区域的无休止的斐波那契绘图和重新绘图让我厌烦不已,于是决定在 MQL4 上实现部分工作。
我要解决的主要问题是从手绘斐波那契图形到在价格图表上自动显示带有一些颜色的区域。大家都知道,对象的彩色显示可以改善其生动的感受。因此,相对于分析在上面始终指示数字的各种线,在图表上感知对象要容易得多。
图形对象坐标的处理
在处理图表时,我认为确实应该提供交互性。我们需要图标的程序绘图甚至是交易者所做绘图的补充图解图,并且,我们需要伴随出现的声音,比如在趋势线交叉时。
需要注意手动绘图的优点:
- 让交易者在图表上指定对象绘图的一个参考点。
- 保存了充分的代码输入,所以计算机的处理器加载同样如此。
- 没有必要在图表上对绘制对象编写初始逻辑。另外,要在程序上实现所需的逻辑没那么容易。例如,看一下有多少“锯齿形调整浪”指标。
这里我想演示如何实现一条手绘趋势线相交的指标。
首先,我们在图表上绘制一条趋势线。然后在对象列表中找到这条线。该线可以叫做,比如:趋势线 29344。趋势线是对线本身的描述,29344 是 MetaTrader 4 客户端分配给它的编号。
我们将趋势线重新命名为 TrDup,这是上升趋势线。
重复相同的步骤,创建另一条趋势线 - 下降趋势线,我们用它显示下降趋势。
(1_01_Tr_Alert 指标随这些线进行调整,在 Demark 趋势线绘制指标 TL_by_Demark_v6 中使用相同的名称)
现在我们需要使用 MQL4 在图表上读取对象的数量。
int obj_total=ObjectsTotal();
我们在 obj_total 变量中得到图表上对象的数量。
现在已经得到了对象的数量,剩下的是选择必要的对象以继续处理算法。为此,我们使用循环的典型运算符并找到“TrDup”和“TrDdown”对象。
// Determine the Trend line object
int    obj_total=ObjectsTotal();
  string index;
  for(int i=0;i<obj_total;i++)
    {
     index=ObjectName(i);
      string substrTL_down = StringSubstr (index, 0, 7);
            if (substrTL_down == "TrDdown") string TrDLine_down=index;
      string substrTL_up = StringSubstr (index, 0, 5);
            if (substrTL_up == "TrDup") string TrDLine_up=index;

    }
然后将其名称分配给 TrDLine_down 和 TrDLine_up 字符串变量。
现在我们已经确定了在图表上手动绘制的趋势线。从此刻开始,指标抓住线的坐标,可以通过必要的算法对其执行一些操作。
我们需要获得一个信号,即蜡烛图第一个柱的收盘价格低于第二个柱的收盘价格,前提是趋势线介于这两个柱的收盘价格之间。这样,我们收到价格交叉趋势线的信号。
if ((Close[1]>ObjectGetValueByShift(TrDLine, 1)) && (Close[2]<ObjectGetValueByShift(TrDLine, 2)))
现在我们只需要执行 Alert 或执行声音媒体文件,或者在图表上趋势线交叉的柱附近绘制一个箭头等。
这种方法可以轻松安排手动添加到图表的任何对象的交互协作。例如,斐波那契水平、通道等。
在 Onix 论坛上发布的显示斐波那契水平颜色区域的指标可以作为示例:http://www.onix-trade.net/forum/index.php?act=attach&type=post&id=27033&setlanguage=1&langid=ru.
由 nen 补充并按最后的波浪对斐波那契水平自动绘图的的锯齿形调整浪指标请见以下:http://www.onix-trade.net/forum/index.php?act=attach&type=post&id=27175&setlanguage=1&langid=ru.
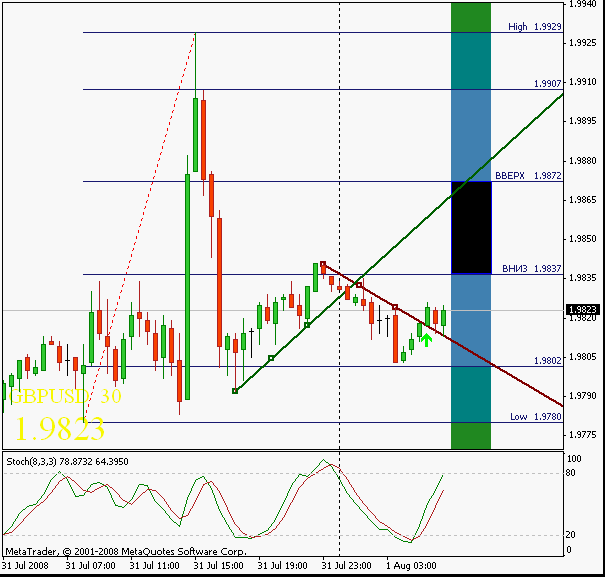
下面我提供了使用图表上的“价格标签”对象,进行斐波那契区域的复杂显示、指示趋势线交叉和显示图表上当前价格的指标代码。

//+------------------------------------------------------------------+
//|                                               1.012_InfoFibo.mq4 |
//|                                                                  |
//|                                                     b2w@narod.ru |
//+------------------------------------------------------------------+
#property copyright "http://www.fibook.ru"
#property link      "b2w@narod.ru"

#property indicator_chart_window
#property indicator_buffers 2
#property indicator_color1 Lime
#property indicator_color2 Red
//---- input parameters
extern bool Auto_Correct_Line = false;// Autocorrection of the last Fibo point
extern bool ClearRectangle = true;//Deleting of the squares while redrawing of the Fibo levels
extern bool TargetZone = true;//Drawing of the target zones
extern int count_Alert=3; //the number of iterations of Alert
double fibs[] = {-0.618, -0.382, -0.237, 0.0, 0.145, 0.382, 0.618, 0.855, 1.0, 1.237, 1.382, 1.618};
color fibsColor[] = {Maroon, Green, ForestGreen, Teal, SteelBlue, ,
                         SteelBlue, Teal, ForestGreen, Green, Maroon};
double Old_Price;
color FontColor=Black;
string TextAlert[7];
int y=0,count_a=0;
double ftime;
double win_idx;
string NameFibs;
double Spread;
double ExtMapBufferUP[];
double ExtMapBufferDN[];
//+------------------------------------------------------------------+
//| Custom indicator initialization function                         |
//+------------------------------------------------------------------+
int init()
  {
      Spread=(Ask-Bid);

//---- indicators
   SetIndexStyle(0,DRAW_ARROW,0,1);
   SetIndexArrow(0,233);
   SetIndexBuffer(0,ExtMapBufferUP);
   SetIndexEmptyValue(0,0.0);
   SetIndexStyle(1,DRAW_ARROW,0,1);
   SetIndexArrow(1,234);
   SetIndexBuffer(1,ExtMapBufferDN);
   SetIndexEmptyValue(1,0.0);

      return(0);
  }
//+------------------------------------------------------------------+
//| Custom indicator deinitialization function                       |
//+------------------------------------------------------------------+
int deinit()
  {
//----

//----
   return(0);
  }
//+------------------------------------------------------------------+
//| Custom indicator iteration function                              |
//+------------------------------------------------------------------+
int start()
  {
if(ftime!=Time[0]) count_a=0;
//  int    counted_bars=IndicatorCounted();
//----
// Determine if there are the Fibo levels or not
int    obj_total=ObjectsTotal();
  string index;
  for(int i=0;i<obj_total;i++)
    {
     index=ObjectName(i);
      string substr = StringSubstr(index, 0, 4);
            if (substr == "Fibo")  NameFibs=index;
      string substrTL = StringSubstr (index, 0, 9);
            if (substrTL == "Trendline")
            string TrDLine=index;
      string substrPR = StringSubstr (index, 0, 5);
            if (substrPR == "Arrow")
            string PR=index;
    }


// Parameters of the trend line
      if (StringLen(TrDLine)>1)
         {
            if (ObjectGet(TrDLine, OBJPROP_PRICE1)>ObjectGet(TrDLine, OBJPROP_PRICE2))
               {
               if ((Close[1]>ObjectGetValueByShift(TrDLine, 1)) &&
                                        (Close[2]<ObjectGetValueByShift(TrDLine, 2)))
                 {
                  ExtMapBufferUP[1]=(Low[1]-5*Point); /*Alert (Symbol(),"  Trend UP enter");*/
                  c_alert(1);
                 }
               }
            else
            if (ObjectGet(TrDLine, OBJPROP_PRICE1)<ObjectGet(TrDLine, OBJPROP_PRICE2))
               {
               if ((Close[1]<ObjectGetValueByShift(TrDLine, 1)) &&
                                        (Close[2]>ObjectGetValueByShift(TrDLine, 2)))
                  {
                   ExtMapBufferDN[1]=(High[1]+5*Point);/*Alert (Symbol(),"  Trend DN enter");*/
                     c_alert(1);
                  }
               }
         }
// The end of calculation of the trend line
if (StringLen(NameFibs) <1) return(-1);// If there are no Fibo levels, then we exit
// Determine where the Fibo levels are drawn
double pr1=ObjectGet(NameFibs, OBJPROP_PRICE1);// first price High
double pr1vrem=ObjectGet(NameFibs, OBJPROP_TIME1);// first time of the price
double pr2=ObjectGet(NameFibs,OBJPROP_PRICE2);// second price Low
double pr2vrem=ObjectGet(NameFibs, OBJPROP_TIME2);// second time of the price
double fibprop=(pr1-pr2);// The difference between HIGH and LOW
double Timeend=(Time[0]+(Period()*360)); // The right side by the time
                                         // to display the objects on the chart
double TimeNachalo=(Time[0]+Period()*60);// The right side by the time
                                         // to display the objects on the chart
//+++
            ObjectMove(PR, 0,Time[0], Bid);// The icon of the current price
//+++
// Parameters of the rectangle of the reverse zone..
double verx=(pr1-fibprop*0.382);
double niz=(pr2+fibprop*0.382);
string UP=DoubleToStr(verx+Spread,Digits);
string DN=DoubleToStr(niz-Spread,Digits);
  if (Auto_Correct_Line==true)
      {
         if (High[0]>pr1) ObjectMove(NameFibs, 0,Time[0], High[0]);
         if (Low[0]<pr2) ObjectMove(NameFibs, 1,Time[0], Low[0]);
      }
   if (ClearRectangle == true) ObjectsDeleteAll(0,OBJ_RECTANGLE);// Delete the RECTANGLES objects
// Draw the rectangles in the cycle
        for( y=0;y<11;y++)
      {
      ObjectCreate(("Kvadrat"+y), OBJ_RECTANGLE, 0, TimeNachalo,(pr2+fibprop*fibs[y]),
                                                        Timeend,(pr2+fibprop*fibs[y+1]) );
      ObjectSet(("Kvadrat"+y),OBJPROP_COLOR,fibsColor[y]);
      }
// The end of drawing

                                /* Drawing of the rectangle of the ZONE */
 ObjectCreate("Kvadrat", OBJ_RECTANGLE, 0, TimeNachalo, verx , Timeend , niz);
 ObjectSet("Kvadrat",OBJPROP_BACK,false);

// The array of text data
       TextAlert[0] =   "Attention two targets ";
       TextAlert[1] =   ("Order up * "+UP);
       TextAlert[2] =   ("Order down   * "+DN);
       TextAlert[3] =   ("TARGET up 2  * "+(DoubleToStr(pr1+fibprop*0.618,Digits)));
       TextAlert[4] =   ("TARGET up 1  * "+(DoubleToStr(pr1+fibprop*0.382,Digits)));
       TextAlert[5] =   ("TARGET down 1  * "+(DoubleToStr(pr2-fibprop*0.382,Digits)));
       TextAlert[6] =   ("TARGET down 2  * "+(DoubleToStr(pr2-fibprop*0.618,Digits)));
double YDist[] = {20, 55, 80, 120, 150, 180, 210};
color TextAlertClr[] = {Yellow, Green, Red, Green, Green, Red, Red};

// Output to the screen the message about orders entering
              for(y=0;y<7;y++)
               ObjectDelete("TextAlerts"+y);
if (TargetZone == true)
      {
      if (Bid > niz && Bid < verx)
            for(y=0;y<7;y++)
                  {
                  ObjectCreate(("TextAlerts"+y), OBJ_LABEL, 0, 0, 0);
                  ObjectSetText(("TextAlerts"+y),TextAlert[y], 12, "Times New Roman",TextAlertClr[y]);
                  ObjectSet(("TextAlerts"+y), OBJPROP_CORNER, 0);
                  ObjectSet(("TextAlerts"+y), OBJPROP_XDISTANCE, 10);
                  ObjectSet(("TextAlerts"+y), OBJPROP_YDISTANCE, YDist[y]);
                  }
      }

// The informer of the price and the currency name
ObjectDelete("Market_Price_Label101");
   ObjectCreate("Market_Text_Label101", OBJ_LABEL, 0, 0, 0);
   ObjectSetText("Market_Text_Label101", (Symbol()+"  "+Period()), 16, "Times New Roman", Yellow);
   ObjectSet("Market_Text_Label101", OBJPROP_CORNER, 2);
   ObjectSet("Market_Text_Label101", OBJPROP_XDISTANCE, 5);
   ObjectSet("Market_Text_Label101", OBJPROP_YDISTANCE, 5);

  return(0);
  }

//+------------------------------------------------------------------+

void c_alert(int w)
 {
 ftime=Time[0];
 if(count_a<count_Alert)
 {count_a+=1;
 PlaySound("ku_ku.wav");
 }
 }
 return;
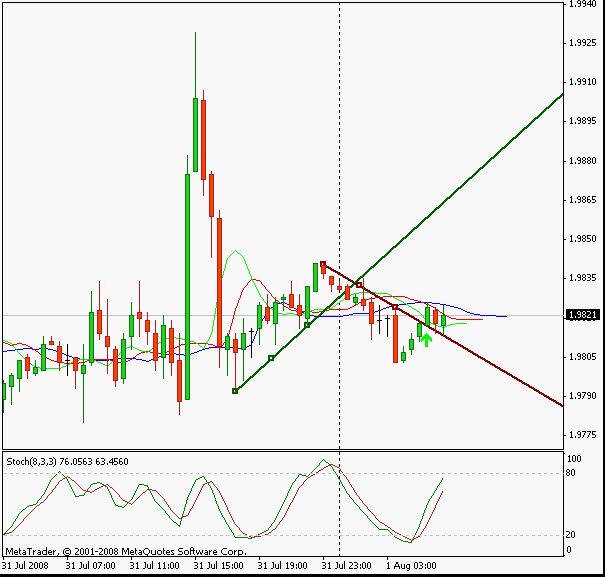
下图显示了 GBPUSD 小时图上趋势线的交叉。

总结
利用该方法处理接收的数据,对交易者的工作很有帮助。将眼睛解放出来,从连续等待激活或平仓的必要时刻中解脱出来,不仅降低了情绪压力,还增加了把握交易中必要时刻的几率。
为了你的方便性,我随附了 GBP 图表的模板,你应该把它放在 \templates\ folder 文件夹。
指标本身应该放在 \experts\indicators\ 文件夹。
声音文件应放在 \sounds\ 文件夹。
本文由MetaQuotes Ltd译自俄文
原文地址: https://www.mql5.com/ru/articles/1546
注意: MetaQuotes Ltd.将保留所有关于这些材料的权利。全部或部分复制或者转载这些材料将被禁止。
本文由网站的一位用户撰写,反映了他们的个人观点。MetaQuotes Ltd 不对所提供信息的准确性负责,也不对因使用所述解决方案、策略或建议而产生的任何后果负责。
 考虑 T. Demark 方法的趋势线指标
 预测金融时间序列

