Supply and Demand simple
- Göstergeler
- Sürüm: 1.1
- Güncellendi: 3 Nisan 2023
- Etkinleştirmeler: 5
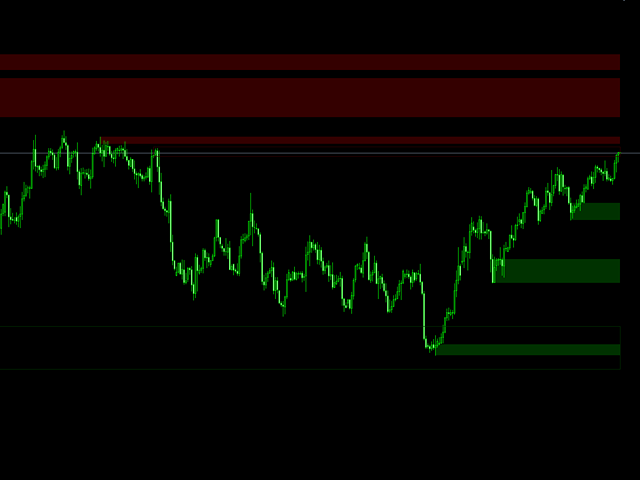
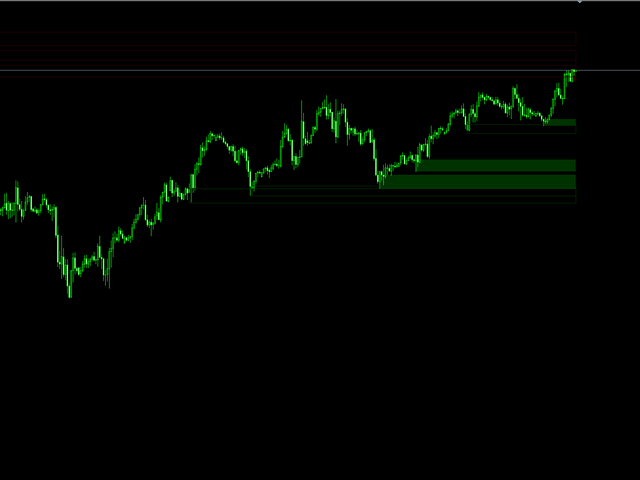
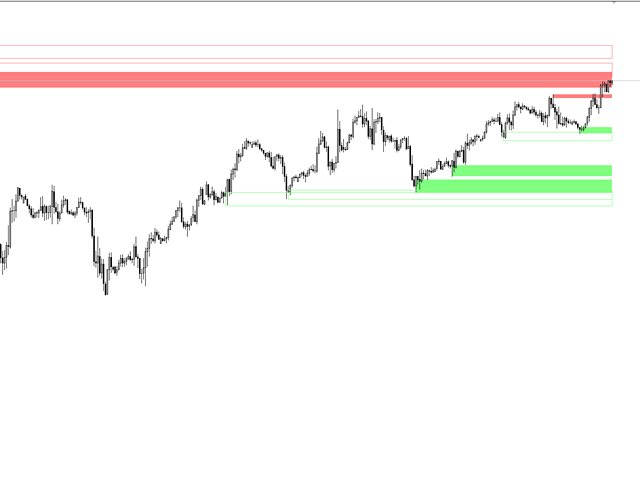
Simple supply and demand indicator which should help identify and visualize S&D zones.
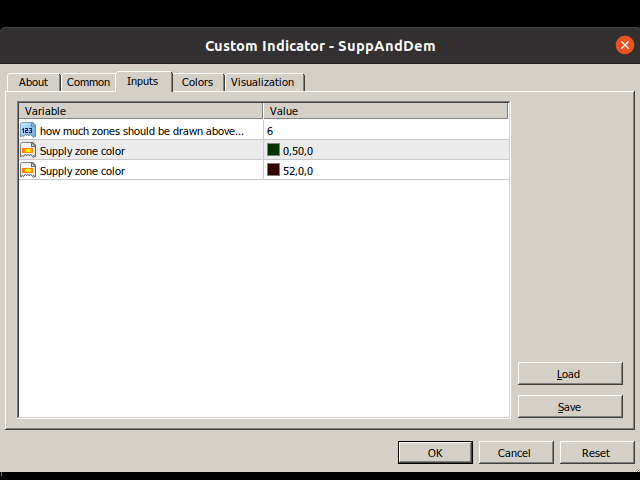
Settings:
Color for supply zones, color for demand zones - default colors are set for dark (black) background.
Number of how much zones should be created above and below current price - value "3" means there will be 3 zones above current price and 3 zones below current price.
Principle:
When price creates "V", reversal zone is registered. Rectangle filled based on zone type (supply / demand) is drawn if price never retested the zone.
If price entered the zone once and has been rejected, zone is drawn as empty (not filled) rectangle.
If price entered the zone more than once or if price crossed the zone then the zone is not valid anymore and rectangle is not drawn.
Uses ZigZag values.
Last (current) movement is not taken into account as it may produce incorrect results (this may be changed in future).
Uses current timeframe and current symbol.