PRO Fibonacci Tool MT4
- Göstergeler
- Sürüm: 1.0
- Etkinleştirmeler: 15

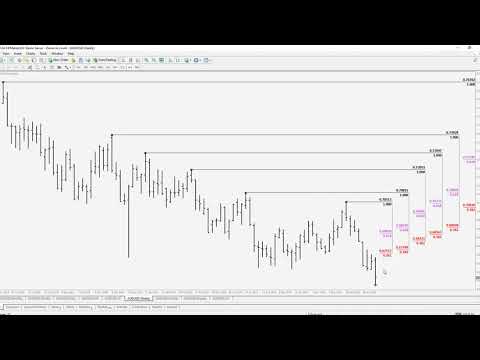
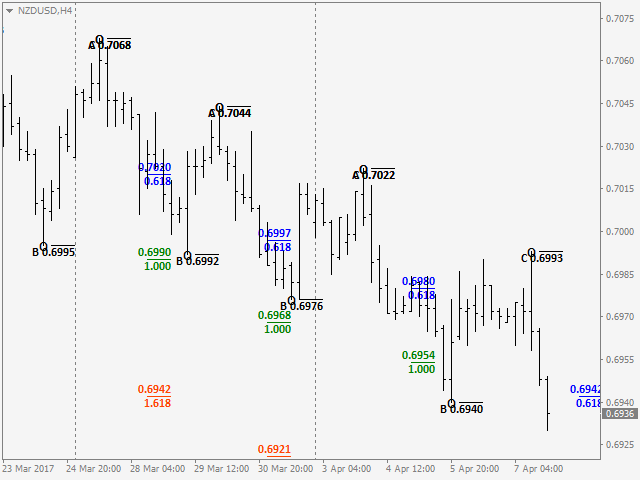
The indicator is the advanced form of the MetaTrader 4 standard Fibonacci tool. It is unique and very reasonable for serious Fibonacci traders.
Key Features
- Drawing of Fibonacci retracement and expansion levels in a few seconds by using hotkeys.
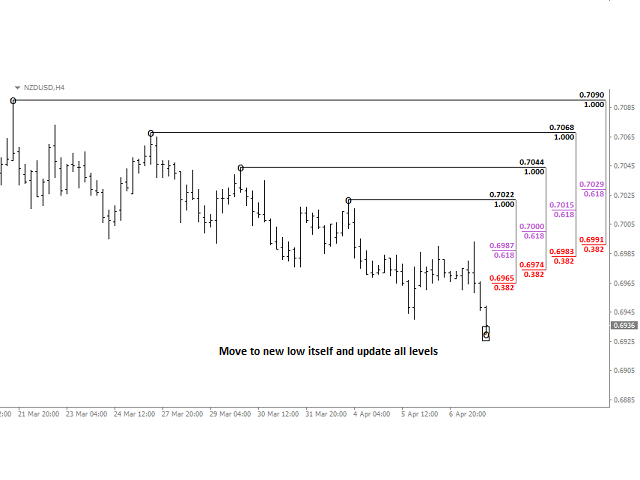
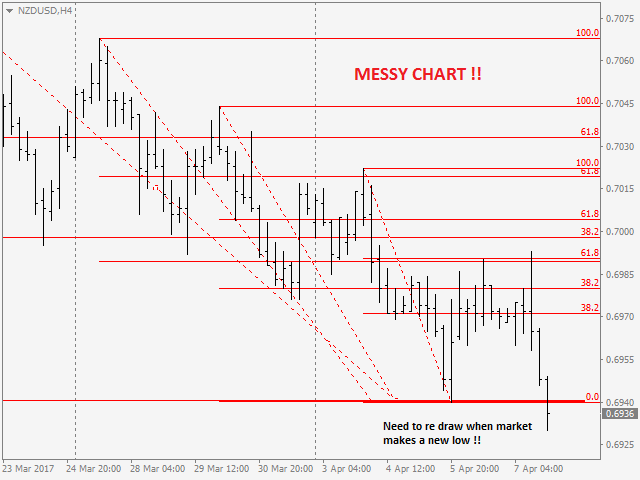
- Auto adjusting of retracement levels once the market makes new highs/lows.
- Ability to edit/remove any retracement & expansion levels on chart.
- Auto snap to exact high and low of bars while plotting on chart.
- Getting very clear charts even though many retracement and expansion series drawn on it.
Keyboard Shortcuts (Hotkeys)
- Shift+E: Initiate a new expansion drawing sequence.
- Ctrl+Shift+E: Remove all expansions placed on a chart.
- Ctrl+Shift+X: Remove last expansion placed on a chart.
- Shift+X: undo last click when clicking ABC’s.
- Shift+D: Initiate a new retracement drawing sequence.
- Ctrl+Shift+D: Remove all retracements placed on a chart.
- Ctrl+Shift+Z: Remove last retracement placed on chart.
- Shift+Z: undo last click when plotting retracements.
- ESC: stop drawing when tool is active.
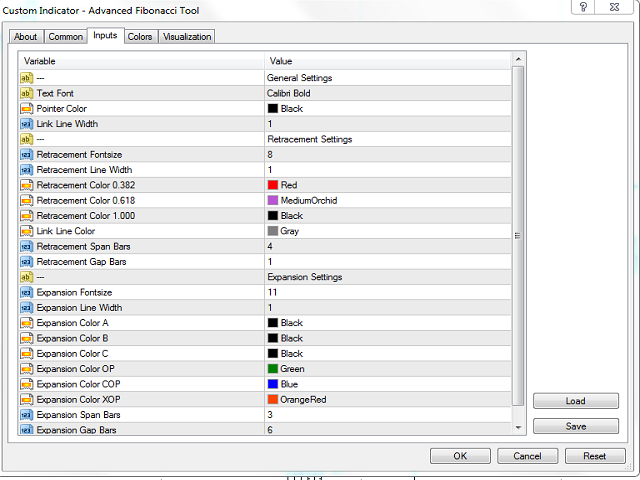
Indicator Parameters
- Text Font - Font of any text on chart can be adjusted.
- Font Size of Retracement Levels - Size of texts for retracement lines on chart can be adjusted.
- Color of Retracement Levels - Colors of retracement lines and texts on chart.
- Width of Retracement Levels - Width of retracement lines on chart.
- Font Size of Expansion Levels - Size of texts for expansion lines on chart can be adjusted.
- Color of Expansion Levels - Colors of expansion lines and texts on chart.
- Width of Expansion Levels - Width of expansion lines on chart.
- Custom Retracement - Any user defined retracement level can be displayed.
- Custom Expansion - Any user defined expansion level can be displayed.
For MT5 version, please visit ► https://www.mql5.com/en/market/product/52835
For My Other Products; please visit ► https://www.mql5.com/en/users/samil34
Please see below video showing how it works by a famous Dinapoli Trader.


In the description it reads "The indicator is the advanced form of the MetaTrader 4 standard Fibonacci tool. It is unique and very reasonable for serious Fibonacci traders." I love Fibonacci, so i wanted to try it. I am sure this is a good indicator and does what it says, but it is not simple to use and you must have a working knowledge of DiNapoli patterns before you can find it effective. It is more of a Utility than an indicator.
The Vendor was responsive and sent me a video to use, but as I said, it is not for a beginner since you must add the indicator on specific levels. It does not find them for you, I will try it for a while and try and get back. update 11-14-23 Very responsive Vendor. Indicator is a challenge, but appears very accurate. Learning to use the keys is most important.