• Genel bakış
  • İncelemeler
  • Yorumlar

Relative Trend Index

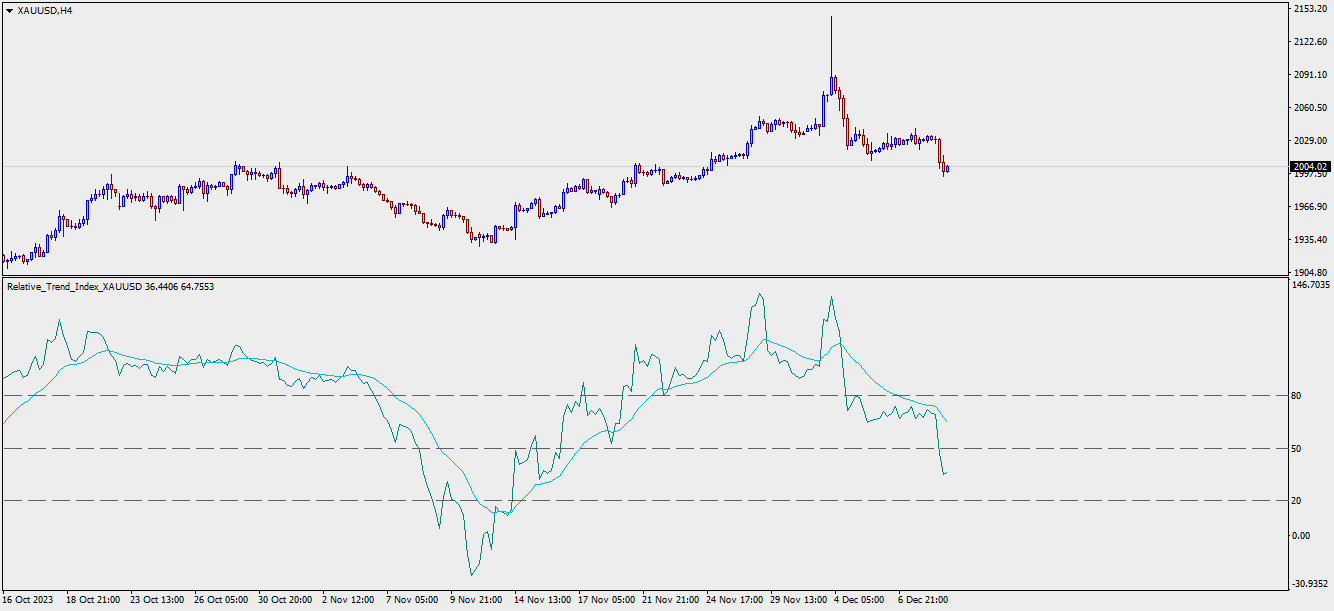
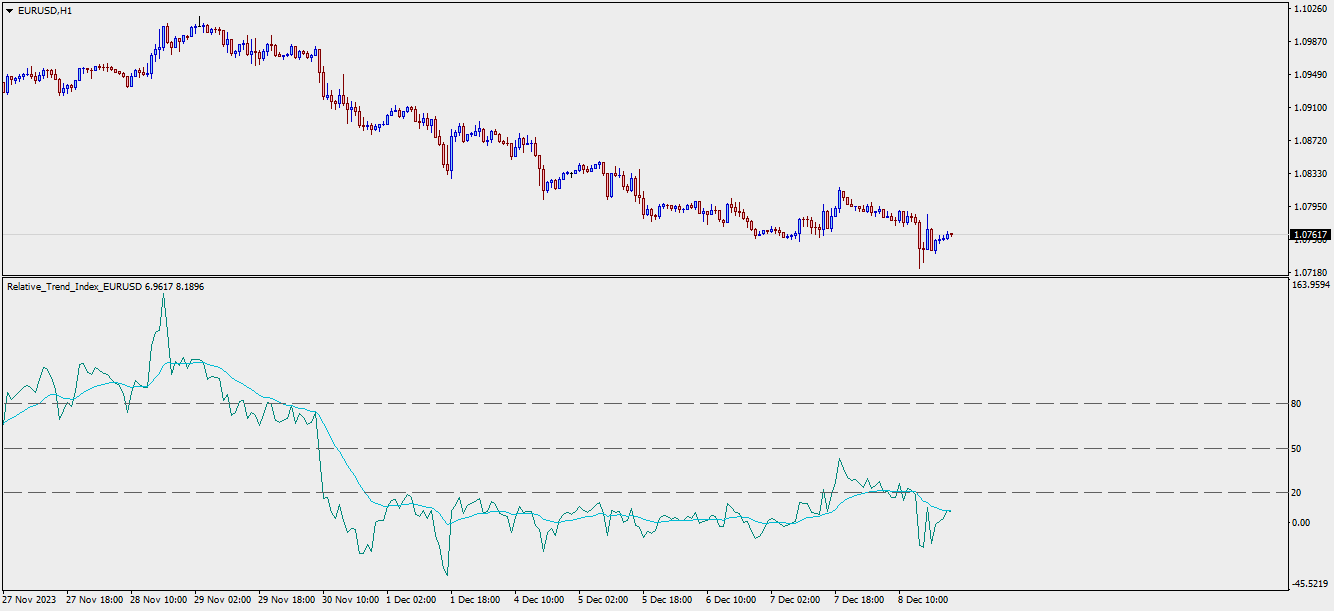
Gösterge başka bir programlama dilinden MQL'e çevrilmiştir. RTI, grafiğin Trendini salınımlı bir şekilde tanımlamak için güçlü bir ücrettir.

İşte orijinal programcıdan bazı notlar:

Genel Bakış
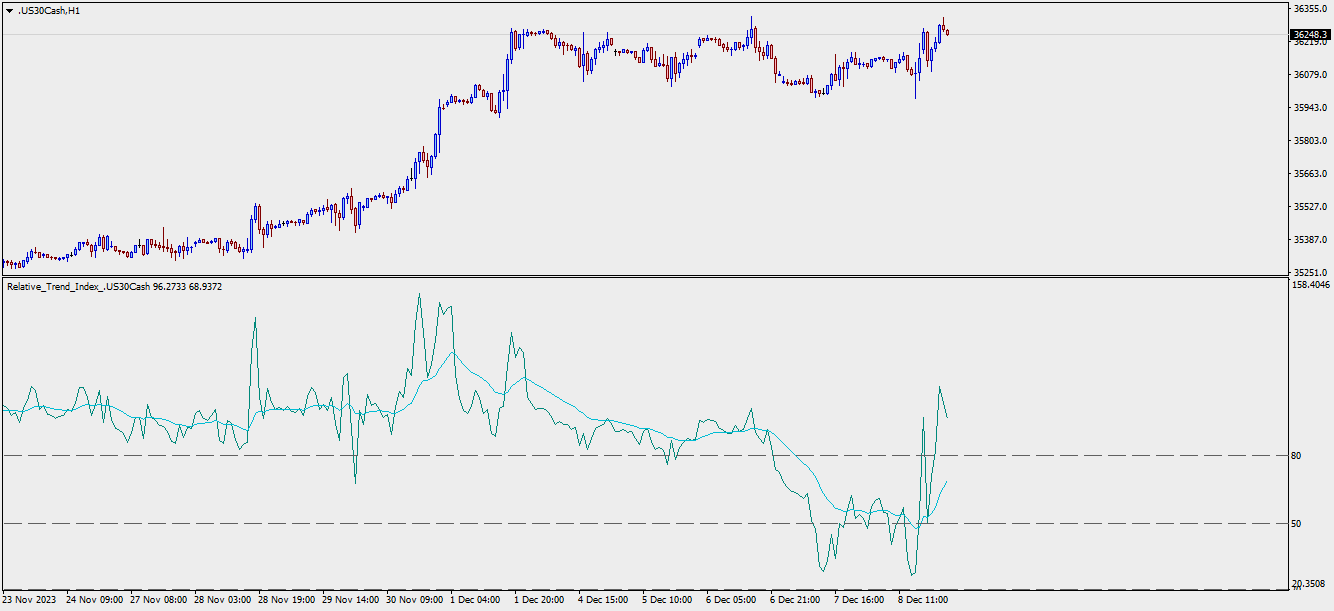
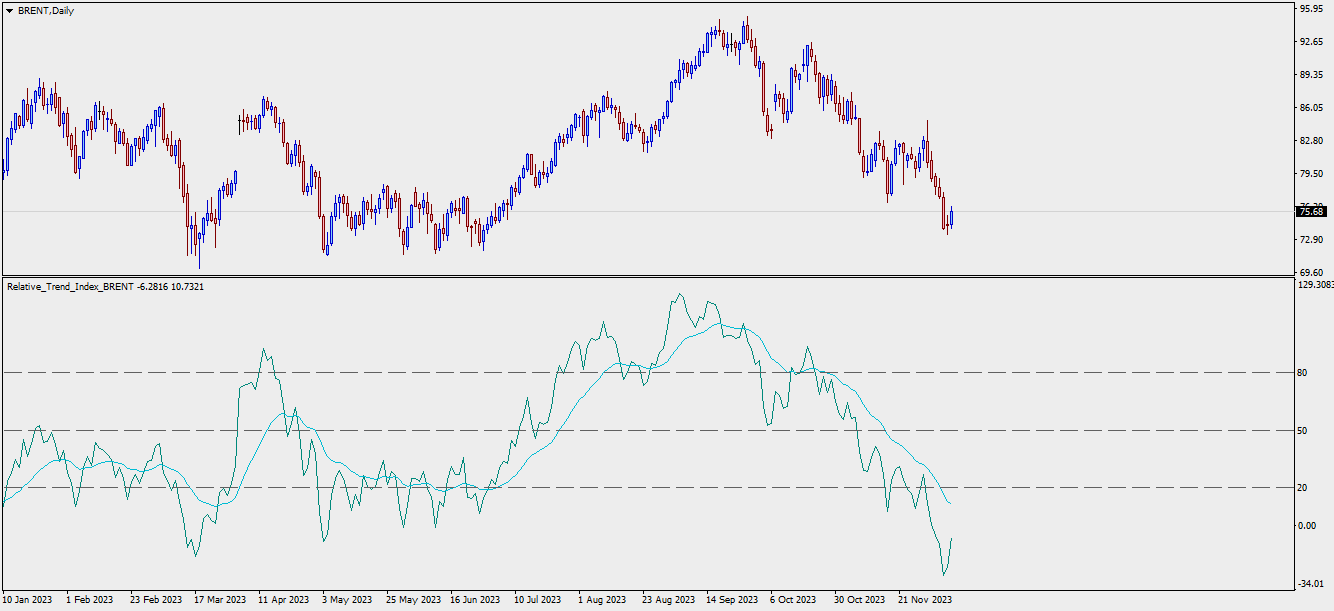
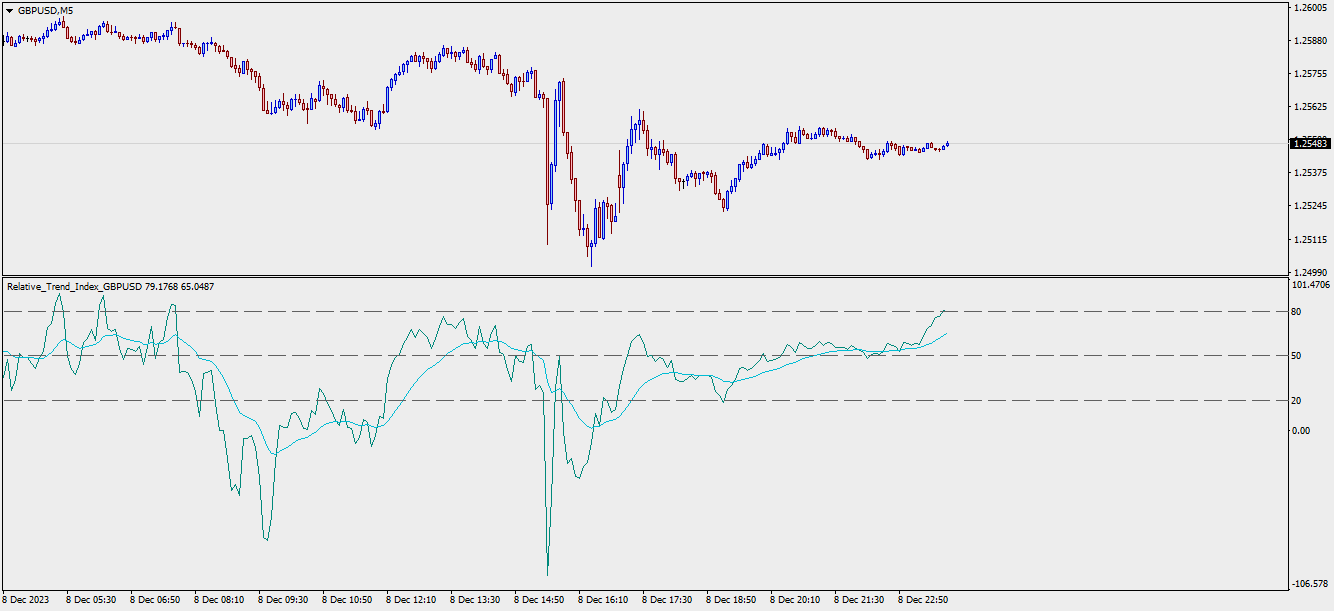
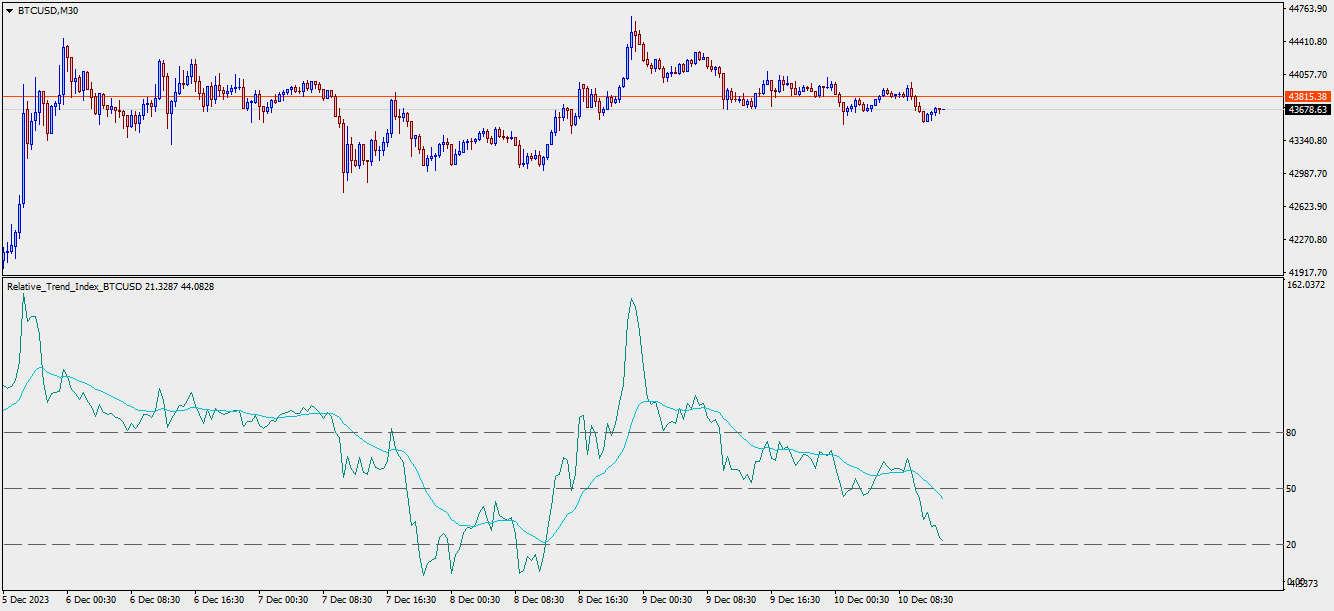
Zeiierman tarafından geliştirilen Göreceli Trend Endeksi (RTI), piyasa trendinin gücünü ve yönünü ölçmek için tasarlanmış yenilikçi bir teknik analiz aracıdır. Bazı geleneksel göstergelerin aksine RTI, piyasadaki dalgalanmalara uyum sağlama ve yanıt verme konusunda kendine özgü bir yeteneğe sahip olmakla birlikte, küçük, kısa vadeli piyasa dalgalanmalarının etkilerini en aza indirir.

Göreceli Trend Endeksi trend takibi ve ortalama geri dönüş özelliklerini harmanlayarak trend gücüne yönelik özelleştirilebilir ve sezgisel bir yaklaşımla bir araya getirir ve fiyat hareketine olan duyarlılığı bu göstergeyi öne çıkarır.

RSI yerine bu RTI'yı kullanmanın faydaları
Göreceli Güç Endeksi (RSI) ve Göreceli Trend Endeksi (RTI), her biri kendine özgü güçlü yönlere sahip güçlü teknik göstergelerdir.
Ancak, özellikle trendlerin ve aşırı alım/aşırı satım (OB/OS) alanlarının belirlenmesi söz konusu olduğunda, RTI'yı tartışmasız bir şekilde daha sofistike ve hassas kılan önemli farklılıklar vardır.
Önerilen ürünler
The indicator is the advanced form of the MetaTrader 4 standard Fibonacci tool. It is unique and very reasonable for serious Fibonacci traders. Key Features Drawing of Fibonacci retracement and expansion levels in a few seconds by using hotkeys. Auto adjusting of retracement levels once the market makes new highs/lows. Ability to edit/remove any retracement & expansion levels on chart. Auto snap to exact high and low of bars while plotting on chart. Getting very clear charts even though many ret
Std Channels
Muhammed Emin Ugur
Std Channels The Std Channels Indicator is a technical indicator that uses standard deviation to create five channels around a price chart. The channels are used to identify support and resistance levels, as well as trends and reversals. The indicator is calculated by first calculating the standard deviation of the price data over a specified period of time. The channels are then created by adding and subtracting the standard deviation from the price data. The five channels are as follows: Upper
Bu yazılım aracı, özelleştirilebilir beş renk arasından seçtiğiniz yatay trend çizgileri ve dikdörtgenler oluşturma sürecini kolaylaştırmak için tasarlanmıştır. MT5'te hassas yatay trend çizgileri çizmek zor olabilir ancak bu göstergeyle bunları tercihlerinize uygun renklerde zahmetsizce oluşturabilirsiniz. Ayrıca aracımız, çizdiğiniz yatay çizgilerle ilişkili fiyat seviyelerinin net bir şekilde görüntülenmesini sağlar. Geri bildiriminize değer veriyoruz ve bu aracı ticari ihtiyaçlarınız
1 of 10 for 69$ . Next Price is 89$ SMC Unmitigated Finding is a indicator for find unmitigated supply and demand in previous legs of price Settings Zigzag Settings ZZDepth - by Default is 12. ZZDeviation - by Default is 5. ZZBackStep - by Default is 3. Rectangle Settings SupportColor-  color for Support line.  ResistanceColor  -  color for Resistance line. Settings Num of Show -  Number of Support & Resistance Show.
Индикатор ищет подобную ценовую структуру, сравнивая с последней ценовой структурой. Размер паттерна (грубо говоря количество переломов зигзага) настраивается (всегда меньше на 1, чем введено - нулевой перелом не считается). Все найденные совпадения отмечаются прямоугольником. Так же к паттернам существует быстрая навигация с помощью кнопочек "Next patt" и "Prev patt". В индикатор вшиты два индикатора типа ЗигЗа г : стандартный зигзаг и пользовательский , моей разработки. Параметры настройки ста
A top-quality implementation of the famous  Zig Zag  indicator, which needs no introduction. It is completely coming from original algorithm.  After you have this indicator, you will no need any more indicator for opposite direction of trend. Trading direction of TREND Very easy to understand and set  It implements a multi-timeframe dashboard Buy and Sell signals on same chart  Working M5-M15-M30-H1-H4 and D1  After the purchase, please contact me for to learn how to use it. 
The Sensitive Volume indicator is an indicator designed to generate trading signals. The purpose of this indicator is to generate signals from the highest probability of trading. Using a number of price movements and a set of indicator properties to generate these signals.  Easy to use, simple and understandable to the user. With alert features, user signals can be reached quickly.  Visually the user can easily recognize the signals. This indicator will not repaint. Parameters Trend_Period - p
Scanner and Dashboard for Money Flow Index for MT4 The Money Flow Index (MFI) is a technical oscillator that uses price and volume data for identifying overbought or oversold signals in an asset. It can also be used to spot divergences which warn of a trend change in price. The oscillator moves between 0 and 100. Advantages of the Scanner: - Full Alert Options. - Multi Timefrare  - Works for all instruments including Currencies, Indices, Commodities, Cryptocurrencies and Stocks. - Fully customis
Very special indicator of Joe Dinapoli which is a derivative from traditional MACD indicator. It shows the precise price, at which MACD will show line crossing and trend shifting. Also, this level is known one period ahead of time.You can constantly reassess your current position by looking at this studying a variety of timeframes. When you are in a trade, you have a feel for how much time you have for the trade to go your way by looking at the distance between the MACD Predictor line and the
The trend beads indicator is software that does not include trend indicators such as moving average, Bollinger bands. This indicator works entirely with price and bar movements. The purpose of the indicator is to calculate the most likely trends. To assist the user in determining trend trends. The user determines the trend direction with the colors on the screen. You can use this indicator alone as a trend indicator. Or with other indicators suitable for your strategy. Trade Rules Rising trend
The Fibonacci Target indicator is an indicator that uses the Low, High and Fibonacci levels. This indicator has the ability to predict the target. It tries to determine the target that the graph will go on average and draws a target region. The indicator also serves as an oscillator. It can be used as a trend oscillator after making the necessary settings. This indicator is helpful to your strategy. There is no signal generating capability. Parameters TargetPeriod - Target line period setting
MYEwo
Ahmet Metin Yilmaz
MYEWO göstergesi, grafiğinizdeki kısa vade yönünü bulmanıza yardımcı olan bir araçtır. Varsayılan giriş değerleri bu göstergedeki sık kullanılan değerlerdir. Kendi değerlerinizi kendi trend algılamaya ve çiftlerinize göre bulabilir ve kullanabilirsiniz. Tavsiyem, ana grafikteki uzun vadeye olan trendini (200 ve daha yüksek uygun olabilir) anlamak için hareketli bir ortalama kullanmaktır. M5 grafikleri, kullanacağınız scalping tarzı ticaret işlemlerini basitleştirecektir. Genellikle MYEWO göster
Teknolojide ki yüksek gelişim, üretim, e ticaret, lojistik vb tüm sektörlerde kullanıma başlandığı gibi artık finansal piyasalarda da “ yapay zeka ve algoritma” kullanılmaya başlandı. Smart Algoritma indikatörü; kaynak kodu içinde yer alan algoritma ve yapay zekası ile hiçbir analize ihtiyaç duyulmadan gün içi bütün forex enstrümanları için size buy ve sell sinyalleri yanında hedef kanal (gün içi en yüksek ve en düşük seviyeler) verir. İndikatör texti aşağıda ki bölümlerden oluşur ve herkesin a
Introduction to Smart Renko The main characteristics of Renko Charting concern price movement. To give you some idea on its working principle, Renko chart is constructed by placing a brick over or below when the price make the movement beyond a predefined range, called brick height. Therefore, naturally one can see clear price movement with less noise than other charting type. Renko charting can provide much clearer trend direction and it helps to identify important support and resistance level
The Multi Channel Trend indicator was developed to help you determine the trend direction by drawing channels on the graphical screen. It draws all channels that can be trending autonomously. It helps you determine the direction of your trend. This indicator makes it easy for you to implement your strategies. The indicator has Down trend lines and Up trend lines. You can determine the price direction according to the multiplicity of the trend lines. For example , if the Down trend lines start to
This indicator counts ticks and graphically displays the price levels, on which the greatest number of them was detected. Thus, it sufficiently accurately determines the levels of support and resistance. The indicator will be useful for traders who trade breakout or scalping strategies. Features Technical analysis provides several ways for finding levels of support and resistance. Ticks to Levels provides another, fairly accurate, way of determining these levels empirically. The criterion for
Very special indicator of Joe Dinapoli which is a derivative  of a Detrended Oscillator. Through a set of parametric equations, a predicting oscillator is created that forecasts, one period ahead of time, overbought and oversold conditions. The resulting predictor values are expressed as bands on the bar chart, both above and below the market. It may be mistaken as a Bollinger Band but has no resemblance to it whatsoever. The Predictor bands may be used in a variety of ways to aid in entering an
The Stochastic Alerts indicator is an advanced model of the standard stochastic indicator. This indicator is different from the standard indicator 2 level warning feature has been added. For example, the user will be able to receive warnings at levels above 80 and below 20. It can change the levels you wish. For example 60 and 40 can do. This depends on the user's discretion. you can turn the alerts on or off as desired. Parameters Kperiod - Standard stochastic kperiod setting Dperiod - Stan
Flag Pattern indicator is an indicator designed to find flag patterns. Bullish and bear find flag patterns. It finds these patterns by its own algorithm. The display is easy to use and simple. Features Bullish and bear find flag patterns. Draw patterns on the graphic screen. invalid flag patterns. alert the user with the alert feature. Flag patterns have the ability to change colors. Parameters MinSplashHeight -  Min. height of splash setting MaxBarsDuration -  Max bars before crossing setting
The indicator is the advanced form of the MetaTrader 4 standard Fibonacci tool. It is unique and very reasonable for serious Fibonacci traders. Key Features Drawing of Fibonacci retracement and expansion levels in a few seconds by using hotkeys. Auto adjusting of retracement levels once the market makes new highs/lows. Ability to edit/remove any retracement & expansion levels on chart. Auto snap to exact high and low of bars while plotting on chart. Getting very clear charts even though man
FiboZag
Andriy Sydoruk
Indicator FiboZag - transfer the indicator to the chart and the Fibonacci levels will be built automatically on the last ZigZag turn. The main advantage lies in the correct construction of Fibonacci levels and markup of price levels. Simple, visual and effective use. The indicator is not redrawn and does not lag. Works on all currency pairs and on all timeframes.
Introduction to X3 Chart Pattern Scanner X3 Cherart Pattern Scanner is the non-repainting and non-lagging indicator detecting X3 chart patterns including Harmonic pattern, Elliott Wave pattern, X3 patterns, and Japanese Candlestick patterns. Historical patterns match with signal patterns. Hence, you can readily develop the solid trading strategy in your chart. More importantly, this superb pattern scanner can detect the optimal pattern of its kind. In addition, you can switch on and off individu
Auto Levels
Yaroslav Varankin
Auto Level this tool is able to determine the levels of support and resistance. search and display when the price has broken through the level and when it pushed off from it. the indicator can be useful if you use resistance support levels in your trading. or the highs and lows of the price, then it will greatly simplify your work and help you more quickly and more accurately determine the rebound or breakdown of the current trend or tendencies level. blue line bottom uptrend red line on top dow
LinearRegressionDecomposition ( LRD ) Linear Regression Decomposition has been calculated using a very complex method. Basically, by examining the retractions of the price movements of the instruments on the Metatrader platform, it is aimed to decompose these movements linearly. The indicator is shown on the graph with two separate lines. The red line is our main indicator and handles the price divergence. The blue line filters the red signal. For example, for a buy signal to occur: the red
ICT Core Content Concepts turned into indicator plus all previous tools known from the  Position Smart Indicator . This makes it the Full PSI Private Version ( read more ) restricted up to now but available only after the Mentorship Core Content was made public on   YouTube. You will find many price action study tools like: Central Bank Dealing Range - CBDR Asian Range FLOUT Profiles and SD targets on the CBRD, Asian Range and Flout both on the   wicks   and on the   bodies Seek & Destroy Profil
Introducing our advanced MQL4 Indicator, a groundbreaking tool for identifying support and resistance zones with unmatched precision. Elevate your trading strategy with a host of features, including a dual-color upper and lower box system that allows for easy visual recognition of market trends. Key Features: Dual-Color Box for the Support and Resistance Zones Customize your analysis with dual-color box. The upper and lower boxes offer distinct colors, providing a clear visual representation o
Scanner and Dashboard for Cycle Sniper ATR Fibo Channels Indicator As users know indicator draws Fibonacci Channels and arrows according to the user's settings. With CS ATR Fibo Channels Scanner, you will have the ability to watch the market. - Multi Timeframe - Multi Instrument Enter your parameters to watch (as explained in Cycle Sniper ATR Fibo Channels Indicator )  - If you cho0se "Arrows by ATR Levels" , you will receive the potential reversal arrrows. - If you choose "Arrows by M
Nice Stable Arrow   indicator is designed for signal trading. This indicator generates trend signals. It uses many algorithms and indicators to generate this signal. It tries to generate a signal from the points with the highest trend potential. This indicator is a complete trading product. This indicator does not need any additional indicators. The indicator certainly does not repaint. The point at which the signal is given does not change. Signals are sent at the beginning of new candle
Trend Guess
Harun Celik
3 (2)
The ”Trend Guess” is a complex software that does not involve the MACD, RSI or moving averages. It adapts itself to current market conditions using complicated algorithms based on price action and out custom indicators. The indicator will gives you trading signals Buy or Sell stop loss levels indicated in the popup alert window and graphically. You have to do is to press buy or sell button whenever you get a signal Important Rules Identify a current long term trend. Example – if you trade on a
This is a well-known ZigZag indicator. But it differs by the fact that its plot is based on values of the middle line which is set by a user. It can display Andrews’ Pitchfork and standard or Bobokus Fibo levels. NO REPAINTING. Parameters Period МА — middle line period. Default value is 34. Minimum value is 4. Maximum value is set at your discretion. Used to calculate price - base price to calculate the middle line. The averaging method - method of smoothing the middle line. Turning pitchfork
Bu ürünün alıcıları ayrıca şunları da satın alıyor
Gann Made Easy
Oleg Rodin
4.93 (56)
Gann Made Easy , bay teorisini kullanarak ticaretin en iyi ilkelerine dayanan, profesyonel ve kullanımı kolay bir Forex ticaret sistemidir. WD Gann. Gösterge, Zararı Durdur ve Kâr Al Seviyeleri dahil olmak üzere doğru SATIN AL ve SAT sinyalleri sağlar. PUSH bildirimlerini kullanarak hareket halindeyken bile işlem yapabilirsiniz. Lütfen satın aldıktan sonra benimle iletişime geçin! Alım satım ipuçlarımı ve harika bonus göstergelerini ücretsiz olarak sizinle paylaşacağım! Muhtemelen Gann ticaret y
Özel MT4 göstergemizle başarılı forex ticaretinin sırrını keşfedin! Forex piyasasında nasıl başarıya ulaşacağınızı hiç merak ettiniz, riski en aza indirirken sürekli olarak kar kazandınız mı? İşte aradığınız cevap! Ticaret yaklaşımınızda devrim yaratacak tescilli MT4 göstergimizi tanıtmamıza izin verin. Benzersiz çok yönlülük Göstergemiz, Renko ve RangeBar Mum oluşumlarını tercih eden kullanıcılar için özel olarak tasarlanmıştır. Bu grafik türlerinin birçok deneyimli tüccar tarafından ter
Atomic Analyst
Issam Kassas
5 (3)
Öncelikle belirtmek gerekir ki bu Ticaret Göstergesi Yeniden Çizim Yapmaz, Gecikmez ve Gecikme Göstermez, bu da hem manuel hem de robot ticareti için ideal hale getirir. Kullanıcı kılavuzu: ayarlar, girişler ve strateji. Atom Analisti, Piyasada Daha İyi Bir Avantaj Bulmak İçin Fiyatın Gücünü ve Momentumunu Kullanan PA Fiyat Hareketi Göstergesidir. Gürültüleri ve Yanlış Sinyalleri Kaldırmaya ve Ticaret Potansiyelini Artırmaya Yardımcı Olan Gelişmiş Filtrelerle Donatılmıştır. Birden fazla katma
ŞU ANDA %26 INDIRIMLI Yeni Başlayanlar veya Uzman Tüccarlar için En İyi Çözüm! Bu Gösterge benzersiz, yüksek kaliteli ve uygun fiyatlı bir ticaret aracıdır çünkü bir dizi tescilli özellik ve yeni bir formül ekledik. Sadece BİR grafik ile 28 Forex çifti için Döviz Gücünü okuyabilirsiniz! Yeni bir trendin veya scalping fırsatının tam tetik noktasını belirleyebildiğiniz için ticaretinizin nasıl gelişeceğini hayal edin? Kullanım kılavuzu: buraya tıklayın Bu ilk olan, orijinal! Değersiz bir
Tanıtım       Kuantum Trend Keskin Nişancı Göstergesi   , trend tersine dönmeleri belirleme ve ticaret yapma şeklinizi değiştiren çığır açan MQL5 Göstergesi! 13 yılı aşkın ticaret tecrübesine sahip deneyimli tüccarlardan oluşan bir ekip tarafından geliştirilmiştir.       Kuantum Trend Keskin Nişancı Göstergesi       trend dönüşlerini son derece yüksek doğrulukla belirlemenin yenilikçi yolu ile ticaret yolculuğunuzu yeni zirvelere taşımak için tasarlanmıştır. ***Kuantum Trend Keskin Nişancı Gö
Gold Stuff
Vasiliy Strukov
4.89 (253)
Gold Stuff, özellikle altın için tasarlanmış bir trend göstergesidir ve herhangi bir finansal enstrümanda da kullanılabilir. Gösterge yeniden çizilmez ve gecikmez. Önerilen zaman dilimi H1. Bu göstergede tam otomatik Uzman Danışman EA Gold Stuff çalışır. Profilimde bulabilirsiniz. Ayarları ve kişisel bir bonusu almak için satın alma işleminden hemen sonra benimle iletişime geçin!   AYARLAR Ok Çiz - açık kapalı. grafik üzerinde oklar çizmek. Uyarılar - sesli uyarılar kapalı. E-posta bild
Trend Screener
STE S.S.COMPANY
4.83 (86)
Trend Göstergesi, Trend Alım Satım ve Filtreleme için Çığır Açan Benzersiz Çözüm, Tüm Önemli Trend Özellikleriyle Tek Bir Araç İçinde Yerleştirildi! Forex, emtialar, kripto para birimleri, endeksler ve hisse senetleri gibi tüm sembollerde/araçlarda kullanılabilen %100 yeniden boyamayan çoklu zaman çerçevesi ve Çoklu para birimi göstergesidir. Trend Screener, grafikte noktalarla ok trend sinyalleri sağlayan etkili bir trend trend göstergesidir. Trend analizörü göstergesinde bulunan özellikler: 1.
Öncelikle, bu Ticaret Aracının Non-Repainting, Non-Redrawing ve Non-Lagging Gösterge olduğunu vurgulamakta fayda var, bu da onu profesyonel ticaret için ideal hale getiriyor. Çevrimiçi kurs, kullanıcı kılavuzu ve demo. Akıllı Fiyat Hareketi Kavramları Göstergesi, hem yeni hem de deneyimli tüccarlar için çok güçlü bir araçtır. İleri ticaret fikirlerini, Inner Circle Trader Analizi ve Smart Money Concepts Ticaret Stratejileri gibi 20'den fazla kullanışlı göstergeyi bir araya getirerek bir araya g
TPSpro RFI Levels
Roman Podpora
5 (13)
A key element in trading is zones or levels from which decisions to buy or sell a trading instrument are made. Despite attempts by major players to conceal their presence in the market, they inevitably leave traces. Our task was to learn how to identify these traces and interpret them correctly. Reversal First Impulse levels (RFI)   -  Version MT5                INSTRUCTIONS                 RUS                 ENG                                       R ecommended to use with an indicator   -  
Şu anda %20 İNDİRİMLİ! Herhangi bir Acemi veya Uzman Tüccar için En İyi Çözüm! Bu gösterge paneli yazılımı 28 döviz çifti üzerinde çalışıyor. Ana göstergelerimizden 2'sine (Gelişmiş Para Birimi Gücü 28 ve Gelişmiş Para Birimi Dürtüsü) dayanmaktadır. Tüm Forex piyasasına harika bir genel bakış sağlar. Gelişmiş Para Birimi Gücü değerlerini, para birimi hareket hızını ve tüm (9) zaman dilimlerinde 28 Forex çifti için sinyalleri gösterir. Trendleri ve / veya scalping fırsatlarını belirlemek içi
TPSproTREND PrO
Roman Podpora
5 (15)
TPSpro TRENDPRO  - is a trend indicator that automatically analyzes the market and provides information about the trend and each of its changes, as well as giving signals for entering trades without redrawing! The indicator uses each candle, analyzing them separately. referring to different impulses - up or down impulse. Exact entry points into transactions for currencies, crypto, metals, stocks, indices!  -  Version MT5               DETAILED DESCRIPTION        /       TRADING SETUPS           
Break and Retest
Mohamed Hassan
4.56 (9)
‍You can visually backtest Break & Retest to see how it behaved in the past!     Manual guide:   Click here $65  for only 1  copy left! Next price is $120 .  This Indicator only places quality trades when the market is really in your favor with a clear break and retest. Patience is key with this price action strategy! Recommended timeframes: M1 for Scalpers.  M15 for Intraday traders. H1 & H4 for Day traders. Other timeframes are also excellent! After many months of hard w
RelicusRoad Pro
Relicus LLC
4.78 (139)
Şimdi 147 $ (birkaç güncellemeden sonra 499 $ 'a yükseliyor) - Sınırsız Hesaplar (PC'ler veya Mac'ler) RelicusRoad Kullanım Kılavuzu + Eğitim Videoları + Özel Discord Grubuna Erişim + VIP Durumu PİYASAYA BAKMAK İÇİN YENİ BİR YOL RelicusRoad, forex, vadeli işlemler, kripto para birimleri, hisse senetleri ve endeksler için dünyanın en güçlü ticaret göstergesidir ve yatırımcılara kârlı kalmaları için ihtiyaç duydukları tüm bilgileri ve araçları sağlar. Başlangıç ​​seviyesinden ileri seviyey
Advanced Supply Demand
Bernhard Schweigert
4.92 (310)
CURRENTLY 26% OFF !! Best Solution for any Newbie or Expert Trader! This indicator is a unique, high quality and affordable trading tool because we have incorporated a number of proprietary features and a new formula. With this update, you will be able to show double timeframe zones. You will not only be able to show a higher TF but to show both, the chart TF, PLUS the higher TF: SHOWING NESTED ZONES. All Supply Demand traders will love it. :) Important Information Revealed Maximize the potenti
Scalper Vault
Oleg Rodin
5 (28)
Scalper Vault , başarılı bir scalping için ihtiyacınız olan her şeyi size sağlayan profesyonel bir scalping sistemidir. Bu gösterge, forex ve ikili opsiyon tüccarları tarafından kullanılabilecek eksiksiz bir ticaret sistemidir. Önerilen zaman çerçevesi M5'tir. Sistem size trend yönünde doğru ok sinyalleri sağlar. Ayrıca size üst ve alt sinyaller ve Gann piyasa seviyeleri sağlar. Göstergeler, PUSH bildirimleri dahil her türlü uyarıyı sağlar. Göstergeyi satın aldıktan sonra lütfen benimle iletişim
Mucizevi Forex Göstergesi Tanıtımı: Keskin Ticaretin Gücünü Serbest Bırakın Tüm zaman dilimlerinde gerçekten olağanüstü sonuçlar sunan en iyi Forex göstergesini aramaktan sıkıldınız mı? Artık aramayın! Mucizevi Forex Göstergesi, ticaret deneyiminizi devrimleştirip kazançlarınızı yeni zirvelere taşımak için burada. Gelişmiş teknoloji ve yılların özenli geliştirmesi temelinde Mucizevi Forex Göstergesi, döviz piyasasında güç ve keskinlik açısından doruğa çıkar. Bu olağanüstü araç, tüm seviyelerdeki
Quantum Breakout Indicator PRO
Bogdan Ion Puscasu
4.96 (26)
Tanıtım       Quantum Breakout PRO   , Breakout Bölgeleri ile ticaret yapma şeklinizi değiştiren çığır açan MQL5 Göstergesi! 13 yılı aşkın ticaret deneyimine sahip deneyimli tüccarlardan oluşan bir ekip tarafından geliştirilen   Quantum Breakout PRO   , yenilikçi ve dinamik koparma bölgesi stratejisiyle ticaret yolculuğunuzu yeni zirvelere taşımak için tasarlanmıştır. Kuantum Breakout Göstergesi, size 5 kar hedefi bölgesi ile kırılma bölgelerinde sinyal okları ve kırılma kutusuna dayalı ol
BB Reversal Arrows Teknik Ticaret Sistemi, perakende kararları almak için ters noktaları tahmin etmek için geliştirilmiştir. Mevcut pazar durumu gösterge ile analiz edilir ve çeşitli kriterler için yapılandırılır: ters anlar beklentisi, potansiyel dönüm noktaları, satın alma ve satış sinyalleri. Gösterge fazla bilgi içermez, tüccarların makul kararlar vermesine izin veren görsel anlaşılabilir bir arayüze sahiptir. Tüm oklar mumu kapatıyor gibi görünüyor, yeniden çizim yapmadan, birkaç uyarı
GOLD Impulse with Alert
Bernhard Schweigert
4.56 (9)
Bu gösterge, 2 ürünümüz Advanced Currency IMPULSE with ALERT  +   Currency Strength Exotics  'in süper bir kombinasyonudur. Tüm zaman dilimleri için çalışır ve 8 ana para birimi artı bir Sembol için grafiksel olarak güç veya zayıflık dürtüsünü gösterir! Bu Gösterge, Altın, Egzotik Çiftler, Emtialar, Endeksler veya Vadeli İşlemler gibi herhangi bir sembol için para birimi gücü ivmesini göstermek için uzmanlaşmıştır. Türünün ilk örneğidir, Altın, Gümüş, Petrol, DAX, US30, MXN, TRY, CNH vb.
Fiyat tersine döndükçe ve geri çekildikçe piyasa yapısından elde edilen kâr değişir. Piyasa yapısını tersine çevirme uyarısı göstergesi, bir trendin veya fiyat hareketinin ne zaman tükenmeye yaklaştığını ve tersine dönmeye hazır olduğunu tanımlar. Genellikle bir geri dönüş veya büyük bir geri çekilme meydana gelmek üzereyken meydana gelen piyasa yapısındaki değişiklikler konusunda sizi uyarır. Gösterge, olası bir tükenme noktasının yakınında her yeni yüksek veya düşük oluştuğunda, başlangıçta
Scalper Inside PRO
Alexey Minkov
4.75 (57)
An exclusive indicator that utilizes an innovative algorithm to swiftly and accurately determine the market trend. The indicator automatically calculates opening, closing, and profit levels, providing detailed trading statistics. With these features, you can choose the most appropriate trading instrument for the current market conditions. Additionally, you can easily integrate your own arrow indicators into Scalper Inside Pro to quickly evaluate their statistics and profitability. Scalper Inside
TrendDecoder Premium
Christophe, Pa Trouillas
5 (3)
Aralıkları ve bir sonraki olası hamleleri belirleyin   |  Trendlerin en erken sinyallerini ve gücünü alın   |  Geri dönüşten önce net çıkışlar alın   |  Fiyatın test edeceği Fibo seviyelerini tespit edin Gecikmesiz, takip edilmeyen gösterge - manuel ve otomatik ticaret için ideal - tüm varlıklar ve tüm zaman birimleri için uygun Sınırlı süreli teklif >>   %50 İNDİRİM Satın aldıktan sonra, kişiselleştirilmiş ayarlar için bu kanaldan benimle iletişime geçin . MT5   sürümü:   buraya tıklayın Tam y
Entry Points Pro
Yury Orlov
4.7 (225)
Yeniden boyamadan bir ticarete girmek için doğru sinyaller sağlayan MT5 için en iyi gösterge! Herhangi bir finansal varlığa uygulanabilir: forex, kripto para birimleri, metaller, hisse senetleri, endeksler. MT5 versiyonu burada Oldukça doğru alım satım sinyalleri sağlayacak ve bir alım satımı açıp kapatmanın en iyi zamanını size söyleyecektir. Göstergeyi ödeyen yalnızca bir sinyali işleme örneğiyle videoyu (6:22) izleyin! Çoğu tüccar, Giriş Noktaları Pro göstergesinin yardımıyla ilk işl
TrendMaestro
Stefano Frisetti
5 (2)
note: this indicator is for METATRADER4, if you want the version for METATRADER5 this is the link:  https://www.mql5.com/it/market/product/108106 TRENDMAESTRO ver 2.4 TRENDMAESTRO recognizes a new TREND in the bud, he never makes mistakes. The certainty of identifying a new TREND is priceless. DESCRIPTION TRENDMAESTRO identifies a new TREND in the bud, this indicator examines the volatility, volumes and momentum to identify the moment in which there is an explosion of one or more of these data a
Currency Strength Wizard , başarılı ticaret için size hepsi bir arada çözüm sağlayan çok güçlü bir göstergedir. Gösterge, birden çok zaman dilimindeki tüm para birimlerinin verilerini kullanarak şu veya bu forex çiftinin gücünü hesaplar. Bu veriler, şu veya bu para biriminin gücünü görmek için kullanabileceğiniz, kullanımı kolay para birimi endeksi ve para birimi güç hatları biçiminde temsil edilir. İhtiyacınız olan tek şey, işlem yapmak istediğiniz tabloya göstergeyi eklemektir ve gösterge size
Up down v6T
Guner Koca
5 (1)
Thise indicator is up down v6  comes with tradingwiev pinescript. purchased people, after installed on terminal ,contact me on mql5  to get BONUS  TradingView pinescript. up-down indicator is no repaint and works all pairs and lower than weekly time frames charts. it is suitable also 1 m charts for all pairs. and hold long way to signal. dont gives too many signals. when red histogram cross trigger line that is up signal.and price probably will down when blue histogram cross trigger line that
FX Power MT4 NG
Daniel Stein
5 (9)
Sabah Brifingimiz burada mql5 ve on Telegram! FX Power MT4 NG , uzun zamandır çok popüler olan döviz gücü ölçerimiz FX Power'ın yeni neslidir. Peki bu yeni nesil güç ölçer ne sunuyor? Orijinal FX Power hakkında sevdiğiniz her şey PLUS GOLD/XAU güç analizi Daha da hassas hesaplama sonuçları Ayrı ayrı yapılandırılabilir analiz dönemleri Daha da iyi performans için özelleştirilebilir hesaplama limiti Özel çokluDaha fazlasını görmek isteyenler için örnek ayarlar Her grafikte en sevdiğiniz renkler i
nrp vertex g indicator is no repaint vertex indicator. it works all time frame and all pairs. working princible is wery easy and can use beginners. when histogram up side and there is a white star on it that is buy signal.. and reverse signal sell comes when histogram below zero and white star on it.that is sell signal. indicator hold long time to signal.and it is not neccesary to stay on computer. minimum bar number is 500 bars on chart to work of it. and the cnt nr is minimum 500 can be. but p
The 1 2 3 Pattern Scanner
Reza Aghajanpour
4.78 (54)
** All Symbols x All Timeframes scan just by pressing scanner button ** After 17 years of experience in the markets and 3 years of programming, Winner indicator is ready. I would like to share with you! *** Contact me after purchase to send you instructions and add you in "123 scanner group" for sharing or seeing experiences with other users. Introduction The 123 Pattern Scanner indicator with a special enhanced algorithm is a very repetitive common pattern finder with a high success rate . Inte
ICT, SMC, SMART MONEY CONCEPTS, SMART MONEY, Smart Money Concept, Support and Resistance, Trend Analysis, Price Action, Market Structure, Order Blocks, BOS/CHoCH,   Breaker Blocks ,  Momentum Shift,   Supply&Demand Zone/Order Blocks , Strong Imbalance, HH/LL/HL/LH,    Fair Value Gap, FVG,  Premium  &   Discount   Zones, Fibonacci Retracement, OTE, Buy Side Liquidity, Sell Side Liquidity, BSL/SSL Taken, Equal Highs & Lows, MTF Dashboard, Multiple Time Frame, BigBar, HTF OB, HTF Market Structure, 
Yazarın diğer ürünleri
Market Steps MT4
Mahdi Ebrahimzadeh
5 (1)
Piyasa Adımları (Market Steps) göstergesi, Gann Zaman/Fiyat korelasyonlarına dayalı olarak tasarlanmış ve oluşturulmuştur ve Forex Piyasası için Fiyat Eylemine özel kurallarla optimize edilmiştir. Yüksek hacimli siparişler için potansiyel fiyat bölgelerini tahmin etmek için Piyasa emri akışı kavramlarını kullanır. Gösterge Düzeyleri, kendi başına işlem yapmak için veya diğer Stratejilerin/Göstergelerin yanlış sinyallerini filtrelemek için bir kombinasyon olarak kullanılabilir. Her tüccar, çok
LuxAlgo tarafından kodlanan başka bir platformdan dönüştürülen gösterge. Hareketli Ortalamayı farklı türde ekledim ve veri çeşitliliğini kaynakladım. Orijinal versiyonda hareketli ortalama SMA'dır ve piyasadan gelen veri kaynağı sadece mumların kapanışından toplanır.  Bu sürümde birçok hareketli ortalama türü ve ayrıca yüksek / düşük / HL2 / HLC / HLC2 / ... gibi kaynak verileri seçebilirsiniz. İşte orijinal geliştiriciden bazı detaylar: Range Detector göstergesi, fiyatların değiştiği a
Bu kod orijinal olarak LuxAlgo tarafından başka bir programlama dilinden yayınlanmıştır.  Birçok ticaret amacı için kullanılabilecek kabul edilebilir Trend Tahmin yeteneklerine sahiptir. işte kod oluşturucudan bazı açıklamalar: Bu gösterge, daha önce yayınlanan Nadaraya-Watson yumuşatıcıları üzerine inşa edilmiştir. Burada, fiyat ve zarf uçları arasındaki kesişmelerden entegre uyarılar içeren Çekirdek Düzgünleştirmeye dayalı bir zarf göstergesi oluşturduk. Nadaraya-Watson tahmincisinin aksi
Indicator is converted from another programming language code by programmer " sbtnc ". MQL version is simplified to be more useful by less settings complexity.  There is some clues from programmer about indicator: The indicator tracks and reports the percentage of occurrence of daily tops and bottoms by the time of the day.  At certain times during the trading day, the market reverses and marks the high or low of the day. Tops and bottoms are vital when entering a trade, as they will decide if y
FREE
MACD Bands
Mahdi Ebrahimzadeh
Ürün başka bir platformdan dönüştürülmüştür ve orijinali TradeMaster Lite tarafından oluşturulmuştur. Gösterge temel olarak MACD konseptini kullanır, ancak yeteneklerini farklı Ortalama Alma teknikleri ile güçlendirir. Trend ve tersine dönüş tanımlama için güçlüdür.  İşte orijinal sahibinden bazı detaylar: Aşağıdaki özelliklere sahip özelleştirilebilir bir MACD göstergesi sunuyoruz: Çoklu zaman dilimi Olağandışı oynaklığı tespit etmek için sapma bantları 9 Hareketli Ortalama türleri Koşullu
Market Steps MT5
Mahdi Ebrahimzadeh
Piyasa Adımları (Market Steps) göstergesi, Gann Zaman/Fiyat korelasyonlarına dayalı olarak tasarlanmış ve oluşturulmuştur ve Forex Piyasası için Fiyat Eylemine özel kurallarla optimize edilmiştir. Yüksek hacimli siparişler için potansiyel fiyat bölgelerini tahmin etmek için Piyasa emri akışı kavramlarını kullanır. Gösterge Düzeyleri, kendi başına işlem yapmak için veya diğer Stratejilerin/Göstergelerin yanlış sinyallerini filtrelemek için bir kombinasyon olarak kullanılabilir. Her tüccar, çok
Filtrele:
İnceleme yok
İncelemeye yanıt