AIS Adaptive Nonlinear Smoothing

Very often, in the study of financial series apply their smoothing. Using smoothing, you can remove high-frequency components - it is believed that they are caused by random factors and therefore irrelevant. Smoothing always includes some way of averaging the data, in which random changes in the time series mutually absorb each other. Most often, for this purpose, simple or weighted moving average methods are used, as well as exponential smoothing.
Each of these methods has its advantages and disadvantages. Thus, a simple moving average is simple and intuitive, but its application requires the relative stability of the periodic and trend components of the time series. In addition, a signal delay is characteristic of a moving average. The exponential smoothing method is free from the lag effect. But even here there are flaws - exponential smoothing is effective only when aligning the series with random outliers.
A reasonable compromise between simple and exponential averages is the use of a weighted moving average. However, there is the problem of choosing specific weight values. Let's try to sort this out together.
So, first define what we would like to achieve from the smoothing procedure:
• first, we need to remove random changes and noise from the price series;
• secondly, we would like to identify abnormal emissions and unusual price behavior, which can also be used in trade;
• and finally, the averaging procedure should identify sustainable trends if they are present in the market.
And, of course, we would like the smoothing procedure to be adapted to the current market situation.
In order to get the desired result, we will calculate weights depending on how far this price level is from the maximum and minimum prices for the study period. Through this approach, we get a filter that implements the smoothing procedure depending on the distribution of prices for the period of interest.
The main advantage of such a smoothing algorithm is its stability with respect to various kinds of emissions: price deviations can be very large, but the filter will still follow the most significant trends. In addition, with different initial data, we can get different in its essence effects. So, if prices are distributed more or less evenly, then we will get a moving median filter. If prices accumulate around one value and a sufficiently large difference between the maximum and minimum we get modal smoothing. If all prices lie within a very narrow interval, then we get a simple moving average.
The main disadvantage of this method is that smoothing is performed without taking into account price changes over time. Indeed, we can arbitrarily change the order of the prices within the analyzed period - this does not affect the result of the calculations. Thus, we can say that this algorithm considers the price change as a random process.
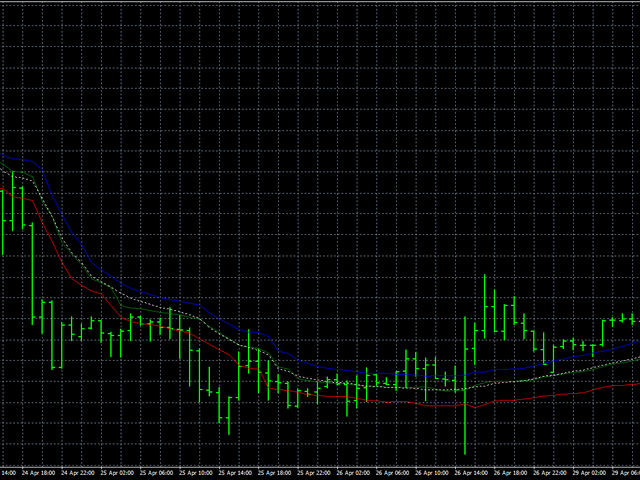
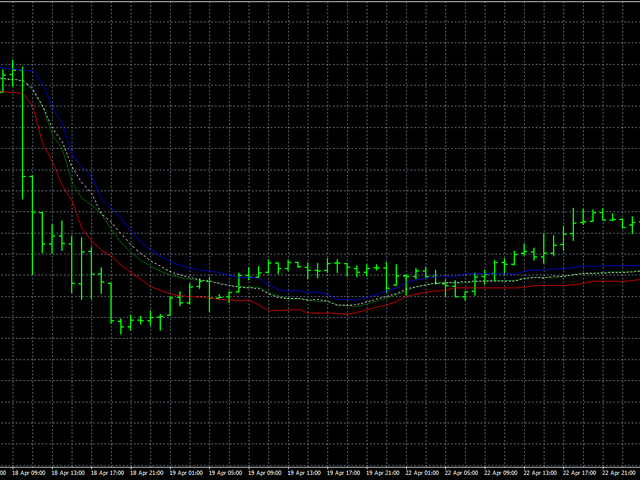
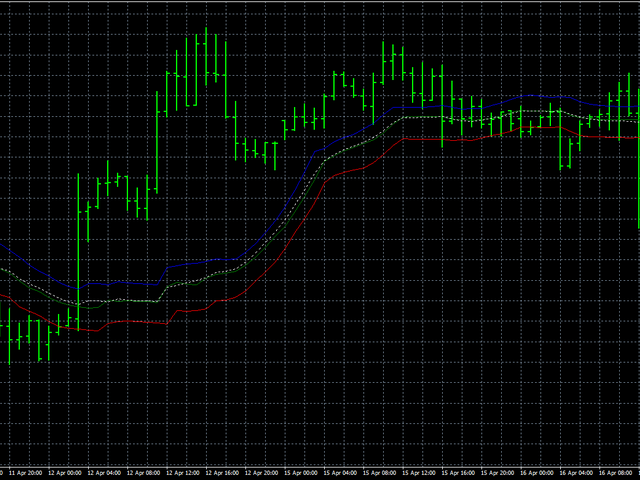
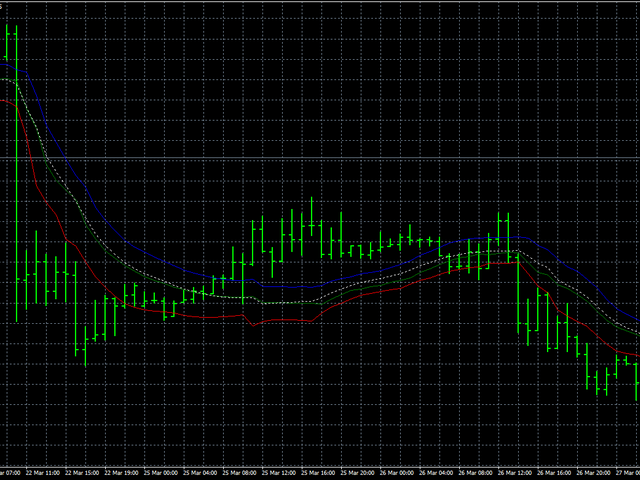
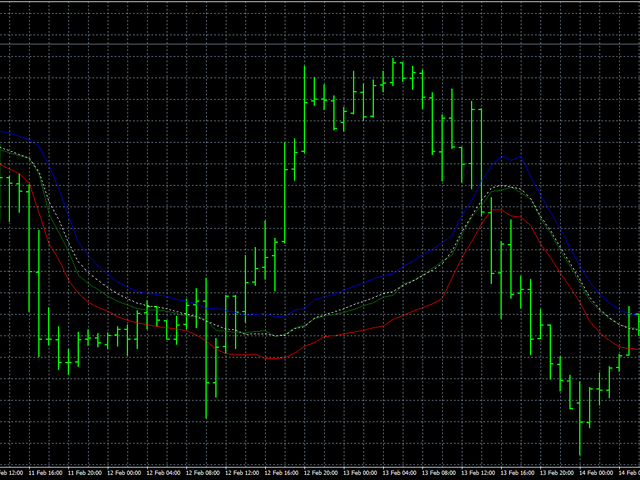
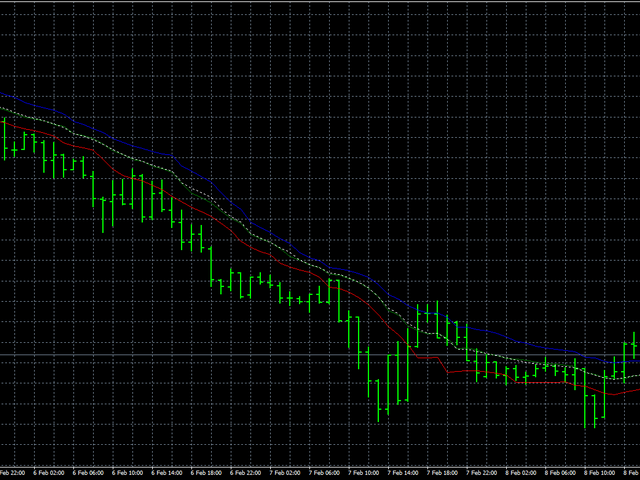
Despite this drawback, let's see how this algorithm works on real data. In this case, we proceed as follows: first, we will smooth the prices of Open, High and Low separately from each other, and then all prices together. Smoothing all prices at the same time will allow us to judge how stable the price behavior is in general. The blue line will show the smoothing of High prices, the red line - Low, and the green line will indicate the smoothing of opening prices. The white dotted line shows the smoothing of all prices at the same time.
  • LH is a parameter that sets the number of bars used for analysis. Its allowable value is in the range of 0 - 255, while the real number of bars is one more.
Önerilen ürünler
El indicador "MR BEAST ALERTAS DE LIQUIDEZ" es una herramienta avanzada diseñada para proporcionar señales y alertas sobre la liquidez del mercado basándose en una serie de indicadores técnicos y análisis de tendencias. Ideal para traders que buscan oportunidades de trading en función de la dinámica de precios y los niveles de volatilidad, este indicador ofrece una visualización clara y detallada en la ventana del gráfico de MetaTrader. Características Principales: Canal ATR Adaptativo: Calcula
Alpha Trend sign has been a very popular trading tool in our company for a long time. It can verify our trading system and clearly indicate trading signals, and the signals will not drift. Main functions: Based on the market display of active areas, indicators can be used to intuitively determine whether the current market trend belongs to a trend market or a volatile market. And enter the market according to the indicator arrows, with green arrows indicating buy and red arrows indicating se
Gold Trader Pro Indicator
Massimiliano Tuzzolino
4.33 (6)
Gold Trader Pro is an advanced analytical tool specifically engineered for professional trading on XAUUSD (Gold). It provides an immediate comprehensive overview of market structure across 7 different timeframes, allowing traders to identify flow direction and signal strength through a modern, draggable, and interactive interface. Key Features Multi-Timeframe Analysis: Real-time monitoring of M1, M5, M15, M30, H1, H4, and D1. Two Operational Modes: MODE_SCALPING: Optimized for fast-paced analys
FREE
ADX Pointer is an indicator which is based on "Average Directional Index" and draws three numbers in chart window depending on the value of ADX. In ADX Pointer you can set "ADX_Period" which is of course period of Average Directional Index and you can also set 3 levels. When ADX value exceed first level ("ADX_Level1") in chart window appears number "1", when ADX exceed second level ("ADX_Level2") appears "2" and when ADX exceed third level ("ADX_Level3") appears "3". Simple. ADX Pointer works on
Trend Detective Indicator
Zakri Bin Othman
4.5 (2)
Leave a review for this product, and receive another "Free" product that you choose. You can see my other products here: https://www.mql5.com/en/users/zakri/seller Trend Detective is an advanced trend detection indicator which shows accurate entry points in direction of trend. It uses smart technology in order to detect entry points, trend changing points, and TP points. It also shows hit rate for current chart using selected parameters. Hit rate for this indicator on different charts can be 8
Trend Flasher Trend is your friend is the age old saying quote in trading arena, there are though many ways to gauge the trend and its direction, more scientific measure and logically meaningful will be an ATR break outs to identify and spot the trend and its acceleration, so we created this easy to use trend identification panel and optimized super trend based multi time frame panel entry system to aid and help the traders to make their trading decision. Unique Features of Trend Flasher 1. H
DMAX pro
Danny Teoh Kok Keong
DMAX SIGNAL IS VERY POWERFUL TOOL TO HELP YOU ENTRY,ITS CAN DETECT OVERSOLD AND OVERBOUGHT IN FOREX MARKET. ITS CAN TRADE 24 FOREX PAIR IN MARKET, 80% ACCURATE RESULT. MANY TRADER FAIL BECAUSE OF ENTRY POINT AND EXIT POINT , SIGNAL OF DMAX WILL GIVE VERY GOOD SIGNAL TO LET YOU KNOW WHERE TO ENTRY AND EXIT.  RISK MANAGEMENT IS VERY IMPORTANT IN TRADING FOREX, PLEASE DONT RISK OVER 5% PER TRADE IS FORE MARKET
Spread and Close MT4
Alexander Denisovich Jegorov
Spread & Candle Close Timer Indicator for MT4  Optimize your trading with this lightweight and efficient indicator, designed to display the real-time spread and candle close countdown directly on your MT4 chart. Features: Live Spread Monitoring – Instantly see market conditions. Candle Close Timer – Stay prepared for the next price movement. Simple & Non-Intrusive Design – No unnecessary settings, just clear and accurate data. Ideal for scalpers, day traders, and those who need real-time exec
Indicador Taurus All4
Fabio Oliveira Magalhaes
Taurus All4 Taurus All4 is a high-performance indicator, it will tell you the strength of the trend, and you will be able to observe the strength of the candle. Our indicator has more than 4 trend confirmations. It is very simple and easy to use. Confirmation Modes Candle Trend Confirmations: When the candle switches to light green the trend is high. When the candle switches to light red the trend is reverting down. When the candle changes to dark red the trend is low. Trendline Trend Confirm
Küçük fiyat hareketlerini filtreleyin ve büyük trendlere odaklanın . Renko grafik göstergesi, küçük fiyat hareketlerini filtreleyerek genel trende odaklanmanıza yardımcı olur. Fiyat, bir Renko bloğu oluşturmak için belirli bir miktar hareket etmelidir. Bu, fiyatın hareket ettiği mevcut trend yönünü kolayca tespit etmenizi sağlar. Çok işlevli araç : 66+ özellik içerir  |   Sorularınız varsa bana ulaşın   |    MT5 sürümü Göstergenin ayarlarında şunları yapılandırabilirsiniz: Hesaplama Ayarları: B
Introduction It is common practice for professional trades to hide their stop loss / take profit from their brokers. Either from keeping their strategy to the themselves or from the fear that their broker works against them. Using this indicator, the stop loss / take profit points will be drawn on the product chart using the bid price. So, you can see exactly when the price is hit and close it manually.  Usage Once attached to the chart, the indicator scans the open orders to attach lines for t
Meraz Trend V4 – High Accuracy 1-Minute Binary Options Signal Indicator Meraz Trend V4 is specially designed for binary options traders who trade on the 1-minute timeframe. It Best Work On Any OTC Pair Any Broker The indicator provides clear Buy and Sell arrow signals directly on the chart. When an arrow appears on a candle, you must enter the trade at the opening of the next candle. Expiry time is strictly 1 minute (1 candle). Entry Rules: If a Buy Arrow appears → Open a BUY (CALL)
MT4 için "Trend Flat Pro Histogram" Kripto Forex Göstergesi, Yeniden Boyama Yok. - "Trend Flat Pro Histogram" göstergesi, standart Hareketli Ortalamalardan çok daha hassas ve çok daha verimlidir. - Mevcut piyasa koşullarını göstermek için tasarlanmıştır: Düz, Yükseliş Trendi, Düşüş Trendi. - Göstergenin 3 rengi vardır: Düz piyasa koşulları için Sarı, düşüş trendi için Kırmızı ve yükseliş trendi için Yeşil (renkler ayarlardan değiştirilebilir). - Mobil ve PC uyarılarıyla. - Bu göstergeyi diğer i
Trend PA
Mikhail Nazarenko
5 (3)
The Trend PA indicator uses   Price Action   and its own filtering algorithm to determine the trend. This approach helps to accurately determine entry points and the current trend on any timeframe. The indicator uses its own algorithm for analyzing price changes and Price Action. Which gives you the advantage of recognizing, without delay, a new nascent trend with fewer false positives. Trend filtering conditions can be selected in the settings individually for your trading style. The indicator
MT4 için Crypto_Forex Göstergesi "Çekiç ve Asılı Adam" formasyonları, Yeniden boyama yok, gecikme yok. - "Çekiç ve Asılı Adam" göstergesi, Fiyat Hareketi işlemleri için çok güçlü bir göstergedir. - Gösterge, grafikte hem yükseliş hem de düşüş trendi gösteren Çekiç formasyonlarını tespit eder: - Yükseliş trendi Çekiç - Grafikte mavi ok sinyali (resimlere bakın). - Düşüş trendi Asılı Adam - Grafikte kırmızı ok sinyali (resimlere bakın). - Bilgisayar, Mobil ve E-posta uyarılarıyla. - "Çekiç ve As
Robot scalper for M5 timeframe. Trades on the GBPUSD currency pair. This robot has been specially developed by a company of professional traders for trading in the pound sterling. The robot approximately opens 5 to 15 trades every day. It is best to trade with brokers that have a low spread on GBPUSD up to 10 pips. The recommended minimum deposit to start is $500 or more. Advantages: does not use martingale. not a net. every trade has a stop loss. professional bot specifically for the GBPUSD p
PABT Pattern Indicator - it's classical system one of the signal patterns. Indicator logic - the Hi & Lo of the bar is fully within the range of the preceding bar, look to trade them as pullback in trend. In the way if indicator found PABT pattern it's drawing two lines and arrow what showing trend way.  - First line - it's entry point and drawing at: 1. On the high of signal bar or on middle of the signal bar (depending from indicator mode) for buy; 2. On the low of signal bar or on middle of t
Octave Fractal Channel — Dynamic Gann-Based Support/Resistance Levels with Auto-Scaling. This indicator plots a dynamic channel based on the fractal structure of price movement. Channel levels adapt to the current symbol and timeframe, making it suitable for use across various financial instruments — from currency pairs to cryptocurrencies and indices. The indicator can be used in combination with other technical tools, such as the RSI oscillator, to provide additional signal filtering. How to
Price Magnet — Price Density and Attraction Levels Indicator Price Magnet is a professional analytical tool designed to identify key support and resistance levels based on statistical Price Density. The indicator analyzes a specified historical period and detects price levels where the market spent the most time. These zones act as “magnets,” attracting price action or forming a structural base for potential reversals. Unlike traditional Volume Profile tools, Price Magnet focuses on price-time d
A powerful chart indicator which intelligently analyses Index, FX & Commodity prices to identify the strongest support and resistance price boundaries. Each line shows where prices consistently close, while the frequency of these matching prices is quoted to reflect each boundary strength. Use these predictive boundaries to identify pivot points, resistance and support levels for crossover, trending, reversal and channel strategies. For FX pairs, set volatility filter = 1 For Indices & Commodit
Golden Gendut
Anthonius Soruh
5 (1)
Gendel Gendut is Binary Option Indicator From @realTatino Trade with expaired time Pairs : All Forex Pair Time Frame : M5 only Trade Time All Time Alert : Alert Message, Alert Email, Alerts Push Buffer : 4 Buffer (0,2 (Buy) || 1,3 (Sell) Broker Suitable : All Broker Binary With Forex Pair Auto Trade : Yes Repaint : NO Delay : NO Other Binary Indicator : https://www.mql5.com/en/market/product/70915 https://www.mql5.com/en/market/product/71054 https://www.mql5.com/en/market/product/57755 etc IND
Rira Renko
Vitor Palmeira Abbehusen
RENKO on Time Chart This indicator is an enhanced Renko, so you can watch the Renko bricks on the chart to understand price movement more clearly the other improvement is automated box size according to ATR (Average True Range) period you can set the ATR number as you want and the box size of Renko changes automatically based on price movement Inputs Mode: Box size is the input to specify the size of the Renko box you want to print on the chart. This input lets you choose the fixed box siz
"Auto FIBO Pro" Crypto_Forex göstergesi - ticarette harika bir yardımcı araçtır! - Gösterge, Fibo seviyelerini ve yerel trend çizgilerini (kırmızı renk) otomatik olarak hesaplar ve grafikte yerleştirir. - Fibonacci seviyeleri, fiyatın tersine dönebileceği önemli alanları gösterir. - En önemli seviyeler %23,6, %38,2, %50 ve %61,8'dir. - Ters scalping veya bölge ızgara ticareti için kullanabilirsiniz. - Auto FIBO Pro göstergesini kullanarak mevcut sisteminizi geliştirmek için birçok fırsat vardır
The LineMagnit Indicator for MT4 is a highly precise tool that builds support and resistance levels which magnetically attract prices. This feature allows traders to easily determine the most probable entry and exit points in the market, as well as identify the market's directional forces, as levels are based on capital inflows into the instrument. Equipped with an intuitively understandable graphical interface, the LineMagnit Indicator enables users to quickly locate and analyze support and res
Smooth Heikin Ashi provides a more smoothed signal of bull or bearish trends than regular Japanese candlesticks, or even the standard Heikin Ashi candles. Heikin Ashi as an alternative candlestick pattern that has been in use since its invention in Japan back in the 1700s. On normal Japanese candlesticks, there is a lot noise with mixed bearish and bullish candles side by side, even during trends. Heikin Ashi reduces this noise leaving an easier visual representation of trends. This indicator is
AW Heiken Ashi
AW Trading Software Limited
AW Heiken Ashi — Trend ve TP seviyelerinin akıllı göstergesi. Klasik Heiken Ashi'ye dayalı, tüccarlar için uyarlanmış, daha fazla esneklik ve netliğe sahip gelişmiş gösterge. Standart göstergenin aksine, AW Heiken Ashi trendi analiz etmeye, kar hedeflerini belirlemeye ve yanlış sinyalleri filtrelemeye yardımcı olarak daha güvenli ticaret kararları sağlar. Kurulum Kılavuzu ve Talimatlar - Burada / MT5 Sürümü - Burada AW Heiken Ashi'nin Avantajları: Herhangi bir varlık ve zaman diliminde çalışır,
The Sensitive Volume indicator is an indicator designed to generate trading signals. The purpose of this indicator is to generate signals from the highest probability of trading. Using a number of price movements and a set of indicator properties to generate these signals.  Easy to use, simple and understandable to the user. With alert features, user signals can be reached quickly.  Visually the user can easily recognize the signals. This indicator will not repaint. Parameters Trend_Period - pe
Добрый День уважаемые трейдеры!  Вашему вниманию индикатор созданный и работающий на базе трендовика ADX,  для торговли на смене направления движения который учитывает коррекцию и даёт возможность на ней заработать.  Применяю этот индикатор для скальпинга. Рекомендую таймфреймы от 15 ти минутного(М15) до часового (Н1) периодов.  Красный кружок сигнал на продажу- Sell) Зелёный кружок  сигнал на покупку Buy) Чем меньше ваш таймфрейм тем меньше пунктов вы зарабатываете.   Важно выставлять стопы! !В
Xmaster göstergesinin yeni, daha doğru versiyonu. Dünyanın dört bir yanından 200'den fazla tüccar, en etkili ve doğru formülü elde etmek için bu göstergenin farklı kombinasyonlarının 15.000'den fazla testini bilgisayarlarında gerçekleştirdi. Ve burada size doğru sinyalleri gösteren ve yeniden boyamayan "Xmaster formül göstergesi forex yeniden boyama yok" göstergesini sunuyoruz. Bu gösterge aynı zamanda tüccara e-posta ve push yoluyla sinyaller gönderir. Her yeni tick'in gelmesiyle birlikte, 75'
About: Looks for price making a trend flip pattern. Importance of this pattern is that after it happens, price tends to range a bit and then breakout right after. Features: Looks for trend flip pattern Num of bars creating pattern Extend lines to right to wait for breakout Bull/Bear Strength for candles making the pattern Filter using Halftrend/NRTR How it Works: Use this technique for scalping. After a pattern happens, you will see a red/green rectangle. Red means a Bearish pattern and green
Bu ürünün alıcıları ayrıca şunları da satın alıyor
Neuro Poseidon MT4
Daria Rezueva
4.95 (38)
Neuro Poseidon is a new indicator by Daria Rezueva. It combines precise trading signals with adaptive TP/SL levels - creating best possible trades as a result! Message me and get  Neuro Poseidon Assistant  as a gift to automize your trading process! What makes it stand out? 1. Proven profitability on all assets and timeframes 2. Only confirmed BUY and SELL signals present on the chart 3. Adaptive TP & SL levels generated by the software for each trade 4. Easy to understand - suitable for all
Miraculous Göstergesi – Gann Dokuz Kareye Dayalı %100 Tekrarlamayan Forex ve İkili Araç Bu video, Forex ve İkili Opsiyon traderları için özel olarak geliştirilmiş son derece doğru ve güçlü bir ticaret aracı olan Miraculous Göstergesi 'ni tanıtıyor. Bu göstergeyi benzersiz kılan, efsanevi Gann Dokuz Karesi ve Gann Titreşim Yasası 'na dayanmasıdır; bu da onu modern ticarette mevcut en hassas tahmin araçlarından biri yapmaktadır. Miraculous Göstergesi tamamen tekrarlamaz ; yani mum kapandıktan son
Trend Catcher ind
Ramil Minniakhmetov
5 (7)
TREND YAKALAYICI GÖSTERGE Trend Yakalayıcı Gösterge, yazarın tescilli ve özelleştirilmiş uyarlanabilir trend analiz göstergelerinin bir kombinasyonunu kullanarak piyasa fiyat hareketlerini analiz eder. Kısa vadeli gürültüyü filtreleyerek ve temel momentum gücüne, volatilite genişlemesine ve fiyat yapısı davranışına odaklanarak gerçek piyasa yönünü belirler. Ayrıca, hareketli ortalamalar, RSI ve volatilite filtreleri gibi yumuşatma ve trend filtreleme özelleştirilmiş göstergelerinin bir kombina
Gann Made Easy
Oleg Rodin
4.84 (165)
Gann Made Easy , bay teorisini kullanarak ticaretin en iyi ilkelerine dayanan, profesyonel ve kullanımı kolay bir Forex ticaret sistemidir. WD Gann. Gösterge, Zararı Durdur ve Kâr Al Seviyeleri dahil olmak üzere doğru SATIN AL ve SAT sinyalleri sağlar. PUSH bildirimlerini kullanarak hareket halindeyken bile işlem yapabilirsiniz. Satın alma işleminden sonra, alım satım talimatlarını ve harika ek göstergeleri ücretsiz olarak almak için lütfen benimle iletişime geçin! Muhtemelen Gann ticaret yöntem
Prop Firm Sniper MT4  is a professional market structure indicator that automatically identifies high-probability BUY and SELL opportunities using BOS and CHoCH analysis. Recommended Timeframes: For backtesting, use the indicator on   M5 or M15   for Gold (XAUUSD), and   M15 or H1   for more volatile Forex pairs such as   GBPUSD, USDJPY, EURGBP , and similar markets. CONTACT ME AFTER PURCHASE TO CLAIM YOUR FREE BONUSES! Prop Firm Sniper  is a professional market structure indicator designed t
M1 Sniper
Oleg Rodin
5 (24)
M1 SNIPER kullanımı kolay bir işlem göstergesi sistemidir. M1 zaman dilimi için tasarlanmış bir ok göstergesidir. Gösterge, M1 zaman diliminde scalping için bağımsız bir sistem olarak kullanılabilir ve mevcut işlem sisteminizin bir parçası olarak kullanılabilir. Bu işlem sistemi özellikle M1'de işlem yapmak için tasarlanmış olsa da, diğer zaman dilimleriyle de kullanılabilir. Başlangıçta bu yöntemi XAUUSD ve BTCUSD ticareti için tasarladım. Ancak bu yöntemi diğer piyasalarda işlem yaparken de ya
Dynamic Forex28 Navigator
Bernhard Schweigert
4.43 (7)
Dynamic Forex28 Navigator - Yeni Nesil Forex Ticaret Aracı. ŞU ANDA %49 İNDİRİM. Dynamic Forex28 Navigator, uzun zamandır popüler olan göstergelerimizin evrimidir ve üçünün gücünü tek bir göstergede birleştirir: Gelişmiş Döviz Gücü28 Göstergesi (695 inceleme) + Gelişmiş Döviz İMPULS ve UYARI (520 inceleme) + CS28 Kombo Sinyalleri (Bonus). Gösterge hakkında ayrıntılar https://www.mql5.com/en/blogs/post/758844 Yeni Nesil Güç Göstergesi Ne Sunuyor?  Orijinallerde sevdiğiniz her şey, şimdi yeni
RelicusRoad Pro
Relicus LLC
4.65 (107)
RelicusRoad Pro: Kantitatif Piyasa İşletim Sistemi ÖMÜR BOYU ERİŞİMDE %70 İNDİRİM (SINIRLI SÜRE) - 2.000+ TRADER'A KATILIN Neden çoğu trader "mükemmel" indikatörlere rağmen başarısız olur? Çünkü tekil kavramları boşlukta trade ederler. Bağlamı olmayan bir sinyal kumardır. Sürekli kazanmak için KONFLÜANS (UYUM) gerekir. RelicusRoad Pro basit bir ok indikatörü değildir. Tam bir Kantitatif Piyasa Ekosistemi dir. Tescilli volatilite modellemesini kullanarak fiyatın ilerlediği "Adil Değer Yolu"nu har
Scalper Inside PRO
Alexey Minkov
4.68 (69)
Scalper Inside PRO Scalper Inside PRO is an intraday trend and scalping indicator that uses exclusive built-in algorithms to evaluate market direction and key target levels. The indicator automatically calculates entry and exit points and several profit target levels, and it shows detailed performance statistics, so you can see how different instruments and strategies behaved on historical data. This helps you select instruments that fit current market conditions. You can also connect your own a
MetaBands M4
Vahidreza Heidar Gholami
3.5 (6)
MetaBands uses powerful and unique algorithms to draw channels and detect trends so that it can provide traders with potential points for entering and exiting trades. It’s a channel indicator plus a powerful trend indicator. It includes different types of channels which can be merged to create new channels simply by using the input parameters. MetaBands uses all types of alerts to notify users about market events. Features Supports most of the channel algorithms Powerful trend detection algorith
Genesis Matrix Pro is a professional multi-timeframe trend detection indicator designed to help traders identify high-quality market alignment with clarity and structure. It combines 12 different technical indicators into one visual alignment matrix, allowing traders to quickly see when market conditions are bullish, bearish, or neutral. A signal is generated only when the selected strategies are aligned, helping reduce noise and improve decision-making. PLEASE CONTACT ME AFTER PURCHASE TO GET
Bu ürün 2026 piyasası için güncellendi ve en son MT5 sürümleri için optimize edildi. FİYAT GÜNCELLEME BİLDİRİMİ: Smart Trend Trading System şu anda $99 fiyatıyla sunulmaktadır. Sonraki 30 satın alma işleminden sonra fiyat $199 olacaktır. ÖZEL TEKLİF: Smart Trend Trading System satın aldıktan sonra bana özel mesaj gönderin, Smart Universal EA’yı ÜCRETSİZ olarak alın ve Smart Trend sinyallerinizi otomatik işlemlere dönüştürün. Smart Trend Trading System, daha temiz sinyaller, daha iyi trend yönü
BTMM State Engine Pro is a MetaTrader 4 indicator for traders who use the Beat The Market Maker approach: Asian session context, kill zone timing, level progression, peak formation detection, and a multi-pair scanner from a single chart. It combines cycle state logic with a built-in scanner dashboard so you do not need the same tool on many charts at once. What it does Draws the Asian session range; session times can follow broker server offset or be set in inputs. Tracks level progression (L
Advanced Supply Demand
Bernhard Schweigert
4.91 (300)
Özel Ticaret –%30 İndirim Yeni Başlayanlar veya Uzman Yatırımcılar İçin En İyi Çözüm! Bu gösterge, bir dizi özel özellik ve yeni bir formül içerdiği için benzersiz, yüksek kaliteli ve uygun fiyatlı bir işlem aracıdır. Bu güncelleme ile çift zaman dilimi bölgeleri gösterebileceksiniz. Sadece daha yüksek bir zaman dilimini değil, hem grafik zaman dilimini hem de daha yüksek zaman dilimini gösterebileceksiniz: İÇ İÇE GEÇMİŞ BÖLGELER GÖSTERİYOR. Tüm Arz Talep yatırımcıları buna bayılacak. :) Önem
Gann Kare Göstergesi, W.D. Gann tarafından yazılan "Piyasa Tahminleri için Matematiksel Formül" makalesine dayalı güçlü bir piyasa analizi aracıdır. Bu araç, piyasa analizi için matematiksel ve Gann teorilerini kullanarak hassas analizler gerçekleştirir. 144, 90, 52 karelerini ve ayrıca 9 karesini kullanır. Ayrıca, 'ın 9 karesi ve bu kareyle ilişkili kanallar ve yıldız modelleri için yöntemini içerir. Kullanıcı Kılavuzu ve Uygulama: Bu göstergeleri kullanmadan önce, kullanıcı kılavuzunu okumanız
Neo Wave PRO
Nikolay Raykov
5 (1)
Price & Time Market Structure Indicator A professional market structure tool that analyzes waves through both price and time — not price alone. Main Description NeoWave PRO is a professional market structure indicator for MetaTrader 4 designed for traders who want to move beyond traditional one-dimensional wave tools such as ZigZag, swing indicators, and basic high/low systems. Most wave indicators analyze only one thing: Price. But a real market wave is not only a price movement. A true wave de
Enigma scalper fx
Yonny Pascal Ekwa Mezui
Enigma Scalper  Overview Enigma Scalper Pro is a multi-filter breakout indicator designed for traders who want clean entry signals with confirmation from several technical conditions instead of relying on a single trigger. The indicator combines: 3-Bar Breakout pattern detection Higher Timeframe confluence Bollinger Band extreme filtering RSI momentum analysis Optional EMA trend filtering ATR-based SL/TP projection Signals are generated only after candle close to ensure stable non-repainting beh
PRO Renko Sistemi, RENKO grafikleri ticareti için özel olarak tasarlanmış son derece hassas bir ticaret sistemidir. Bu, çeşitli ticaret araçlarına uygulanabilen evrensel bir sistemdir. Sistemi etkin piyasa sana doğru ters sinyallerine erişim hakkı denilen ses nötralize eder. Göstergenin kullanımı çok kolaydır ve sinyal üretiminden sorumlu tek bir parametreye sahiptir. Aracı, seçtiğiniz herhangi bir ticaret aracına ve renko çubuğunun boyutuna kolayca uyarlayabilirsiniz. Yazılımımla karlı bir
Scalper Vault
Oleg Rodin
5 (37)
Scalper Vault , başarılı bir scalping için ihtiyacınız olan her şeyi size sağlayan profesyonel bir scalping sistemidir. Bu gösterge, forex ve ikili opsiyon tüccarları tarafından kullanılabilecek eksiksiz bir ticaret sistemidir. Önerilen zaman çerçevesi M5'tir. Sistem size trend yönünde doğru ok sinyalleri sağlar. Ayrıca size üst ve alt sinyaller ve Gann piyasa seviyeleri sağlar. Göstergeler, PUSH bildirimleri dahil her türlü uyarıyı sağlar. Göstergeyi satın aldıktan sonra lütfen benimle iletişim
CRT Candle Range Theory HTF MT4.   Ultimate CRT Indicator: Advanced ICT Concepts and Malaysian SnR Trading System Discounted   Price   $50  !!     Secure your lifetime access   now   before it switches to   subscription-only ! Master the Market Maker's Footprints with the Most Advanced Candle Range Theory Indicator Unlock the true power of   Smart Money Concepts (SMC)   and trade precisely like the institutions with the   Ultimate CRT Indicator . Built exclusively for serious traders, this indic
Pinpoint , XAUUSD için doğru alım ve satım sinyalleri sağlamak amacıyla geliştirilmiş, yeniden çizim yapmayan ve gecikmesiz, yüksek verimli bir işlem göstergesidir. Gösterge, hızlı değişen bir piyasada gerçek zamanlı olarak hızlı, doğru ve görsel çözümler isteyen yatırımcılar için oluşturulmuştur. Gösterge, hazır bir ticaret stratejisi olarak çalışır. O, varlığın fiyatının davranışını belirlenen bir algoritmaya göre analiz eder ve ideal giriş noktalarını belirler, ayrıca kârın en iyi nerede sabi
The indicator scans for Dinapoli thrust pattern in multiple timeframes for the all markets filtered and shows the results on Dashboard. Key Features Dashboard can be used for all markets It can scan for thrust pattern on MN1, W1, D1, H4, H1, M30, M15 ,M5, M1 timeframes Ability to choose number of bars required above/below displaced moving average to define thrust Parameters UseMarketWatch: Set true to copy all symbols available in market watch MarketWatchCount : Set the number of symbols that
ŞU ANDA %40INDIRIMLI Yeni Başlayanlar veya Uzman Tüccarlar için En İyi Çözüm! Bu Gösterge benzersiz, yüksek kaliteli ve uygun fiyatlı bir ticaret aracıdır çünkü bir dizi tescilli özellik ve yeni bir formül ekledik. Sadece BİR grafik ile 28 Forex çifti için Döviz Gücünü okuyabilirsiniz! Yeni bir trendin veya scalping fırsatının tam tetik noktasını belirleyebildiğiniz için ticaretinizin nasıl gelişeceğini hayal edin? Kullanım kılavuzu: buraya tıklayın Bu ilk olan, orijinal! Değersiz bir özent
Reversion King MT4
Eugen-alexandru Zibileanu
Piyasaya Yeni Bir Kral Geldi – Gösterge + Emir Yönetimi (TP1 + TP2 + TP3) (TAM TİCARET SİSTEMİ) Bu gösterge; gelişmiş bir strateji, tamamen özelleştirilebilir emir yönetim sistemi ve Envelopes genişlemelerini kullanan bir Ortalama Dönüş (Mean Reversion) sistemi ile birlikte gelir. RSI gibi çoklu akıllı onay filtreleri sayesinde yüksek olasılıklı dönüş noktalarını tespit eder ve net BUY (Alış) ile SELL (Satış) sinyalleri üretir. Gösterge Repaint Yapmaz (No Repaint). Sadece işlem açmayı değil, ayn
Bu gösterge, pratik ticaret için mükemmel olan otomatik dalga analizine yönelik bir göstergedir! Dava... Not:   Dalga sınıflandırması için Batılı isimleri kullanmaya alışkın değilim. Tang Lun'un (Tang Zhong Shuo Zen) adlandırma kuralının etkisiyle, temel dalgayı   kalem   , ikincil dalga bandını ise   segment   olarak adlandırdım. aynı zamanda segmentin trend yönü vardır. Adlandırma   esas olarak trend segmentidir   (bu adlandırma yöntemi gelecekteki notlarda kullanılacaktır, öncelikle söyleyey
Introduction Harmonic Patterns are best used to predict potential turning point. Traditionally, Harmonic Pattern was identified manually connecting peaks and troughs points in the chart. Manual harmonic pattern detection is painfully tedious and not suitable for everyone. You are often exposed under subjective pattern identification with manual pattern detection. To avoid these limitations, Harmonic Pattern Plus was designed to automate your harmonic pattern detection process. The functionality
Swing Scanner
Reza Aghajanpour
4.65 (23)
** All Symbols x All Time frames scan just by pressing scanner button ** Discount: The price is $70$, But now it is just $39, Limited time offer is active. *** Contact me  to send you instruction and add you in "Swing scanner group" for sharing or seeing experiences with other users. Swing EA:  https://www.mql5.com/en/market/product/124747 Introduction: Swing Scanner is the indicator designed to detect swings in the direction of the trend and possible reversal swings. The indicator studies sev
KT Alpha Hunter Arrows MT4
KEENBASE SOFTWARE SOLUTIONS
Çoğu ok göstergesi size yalnızca bir sinyal verir ve geri kalan her şeyi sizin çözmenizi bekler. KT Alpha Hunter Arrows ise size eksiksiz bir işlem planı sunar. Her sinyal oku, grafikte hazır bir planla birlikte görünür: giriş çizgisi, stop loss, dört take profit seviyesi ve bu sembol ile zaman diliminin o anda işlem yapmaya değer olup olmadığını gösteren canlı edge kararı. Pakete dahil olan Trade Manager EA, siz işleme girdikten sonra yönetimi üstlenir. Böylece piyasa hareketli ve duygusal açıd
Break Axis Signal
Leandro Bernardez Camero
BreakAxis — Dönüş Noktasında Hassas Sinyaller Yeni güncellemeleri kaçırmamak için kanala katılın: https://www.mql5.com/en/channels/forexnewadvisor Eksen Kesişimine Dayalı Sinyal Mantığı BreakAxis Signal, sıfır ekseni kesişimlerine dayalı olarak fiyat yönündeki değişimleri algılamak üzere tasarlanmıştır. Histogram geçişleri, potansiyel piyasa momentumu değişimlerini vurgulamak için kullanılır ve yön okları ile görsel onay sağlanır. Sinyal Onayı ve Kararlılığı Her sinyal, belirli matematikse
PZ ABCD Retracement
PZ TRADING SLU
4 (5)
Identify precise entry and exit points with AB=CD patterns This indicator finds AB=CD retracement patterns. The AB=CD Retracement pattern is a 4-point price structure where the initial price segment is partially retraced and followed by an equidistant move from the completion of the pullback, and is the basic foundation for all harmonic patterns. [ Installation Guide | Update Guide | Troubleshooting | FAQ | All Products   ] Customizable pattern sizes Customizable AC and BD ratios Customizable b
Yazarın diğer ürünleri
This script allows selecting the TakeProfit and StopLoss levels. It analyzes the history data, and then calculates the probability of reaching a given price level. How the script works Suppose you have a trading strategy and you want to select the TakeProfit and StopLoss levels. Run the script and set the parameter: Number of Bars - the average position holding time in bars. Once the script operation is complete, the AIS-PPL.csv file will be created in the Files folder in the terminal data cata
FREE
The script is based on the simulation of trade transactions using a random number generator. This allows you to get completely different results, even with the same input parameters. When you run the script, a dialog box opens in which you can set the desired values ​​for external variables. In the  Trading options  block, the basic parameters that are necessary for trading modeling are defined. Start Balance  - sets the initial size of the trade balance. Number Trade  - sets the number of trad
FREE
Choosing the levels of StopLoss and TakeProfit can have a very strong impact on the overall performance of trading. In addition to the obvious parameters of a trade transaction - the size of a possible win or probable loss - the levels of StopLoss and TakeProfit also affect the expected duration of the transaction, and the profitability of trading in general. If you have already determined the optimal transaction duration using the “ AIS-ODT ” script, then you can begin to determine the paramete
FREE
This script is designed so that the trader can determine the average duration of trade transactions, at which the ratio of possible profits and losses will be optimal. First, let's look at the general approach to determining the optimal duration of trade transactions. We introduce the following variables: R   - the result of the transaction; T   - the time during which the transaction was open; W  - the time between the closing of the previous transaction and the opening of the next one. Every t
FREE
This script allows selecting the TakeProfit and StopLoss levels. It analyzes the history data, and then calculates the probability of reaching a given price level. How the script works Suppose you have a trading strategy and you want to select the TakeProfit and StopLoss levels. Run the script and set the parameter: Number of Bars - the average position holding time in bars. Once the script operation is complete, the AIS-PPL.csv file will be created in the Files folder in the terminal data cata
FREE
AIS Doğru Ortalamalar göstergesi, piyasadaki bir trend hareketinin başlangıcını belirlemenizi sağlar. Göstergenin bir diğer önemli kalitesi, trendin sonunun açık bir işaretidir. Gösterge yeniden çizilmez veya yeniden hesaplanmaz. Görüntülenen Değerler h_AE - AE kanalının üst sınırı l_AE - AE kanalının alt sınırı h_EC - Mevcut çubuk için yüksek tahmin edilen değer l_EC - Mevcut çubuk için düşük tahmin edilen değer Gösterge ile çalışırken sinyaller Ana sinyal, AE ve EC kanallarının kesişimid
AIS Ağırlıklı Hareketli Ortalama göstergesi, ağırlıklı bir hareketli ortalama hesaplar ve trend olan bir piyasa hareketinin başlangıcını belirlemenize olanak tanır. Ağırlık katsayıları, her bir çubuğun belirli özellikleri dikkate alınarak hesaplanır. Bu, rastgele piyasa hareketlerini filtrelemenize olanak tanır. Bir trendin başladığını teyit eden ana sinyal, gösterge çizgilerinin yönündeki bir değişiklik ve gösterge çizgilerini geçen fiyattır. WH (mavi çizgi), Yüksek fiyatların ağırlıklı ort
AIS Advanced Grade Fizibilite göstergesi, fiyatın gelecekte ulaşabileceği seviyeleri tahmin etmek için tasarlanmıştır. Görevi, son üç çubuğu analiz etmek ve buna dayalı bir tahmin oluşturmaktır. Gösterge herhangi bir zaman diliminde ve herhangi bir döviz çiftinde kullanılabilir. Ayarların yardımıyla, tahminin istenen kalitesini elde edebilirsiniz. Tahmin derinliği - istenen tahmin derinliğini çubuklar halinde ayarlar. Bu parametrenin 18-31 aralığında seçilmesi önerilir. Bu sınırların ötesine g
The indicator is designed to measure the price volatility. This allows determining the moments for opening or closing trade positions more accurately. High intensity of the market indicates the instability of its movement, but allows for better results. And, conversely, low intensity of the market indicates the stability of its movement. Parameters Bars to process - the number of bars to measure the price movements. A low value of this parameter allows determining the moments of rapid price mov
This indicator uses the Fibonacci p-numbers to smooth a price series. This allows combining the advantages of the simple and exponential moving averages. The smoothing coefficients depend on the level of the p-number, which is set in the indicator parameters. The higher the level, the greater the influence of the simple moving average and the less significant the exponential moving average. Parameters Fibonacci Numbers Order - order of the Fibonacci p-number, specified by trader. Valid values a
MinDeposit
Aleksej Poljakov
5 (1)
The script analyzes the history of quotes and gives recommendations on the minimum deposit. The calculations take into account the variability of prices and the standard deviation. Margin requirements for the instrument are also taken into account. The result of the script is the minimum recommended deposit for trading the given currency pair.
FREE
The indicator is based on the analysis of interaction of two filters. The first filter is the popular Moving Average. It helps to identify linear price movements and to smooth minor price fluctuations. The second filter is the Sliding Median. It is a non-linear filter. It allows to filter out noise and single spikes in the price movement. A predictive filter implemented in this indicator is based on the difference between these filters. The indicator is trained during operation and is therefore
This indicator studies the price action as a combination of micro-trends. All micro-trends are analyzed and averaged. Price movement is filtered based on this averaging. IP_High and IP_Low (blue and red dashed lines) show the instantaneous price movement. They display the forecast only for the current price values, taking into account only the number of bars defined by the 'Filter level' parameter. SP_High and SP_Low (blue and red solid lines) smooth the price movements with respect to history.
The script allows selecting the required 'Filter level' value of the AIS-MTF indicator. Run the script on the required chart and selected timeframe. Once its operation is complete, the HPS.csv file will be created in the Files folder. Open the file. You will see three columns. The 'Filter lvl' column represents the value of the 'Filter level' for the AIS-MTF indicator. Am. dev. - degree and direction of the indicator's deviation from the price level (sorted in ascending order). Negative values i
FREE
Bu gösterge, basit bir doğrusal yumuşatma işlemi uygular. Üstel yumuşatmanın dezavantajlarından biri, sinyalin hızlı bozulmasıdır. Bu, fiyat aralığındaki uzun vadeli eğilimleri tam olarak takip etmeyi imkansız hale getirir. Doğrusal yumuşatma, sinyal filtrelemeyi daha doğru ve ince bir şekilde ayarlamanıza olanak tanır. Gösterge, parametreler seçilerek yapılandırılır: LP - bu parametre, yumuşatma süresini seçmenize olanak tanır. Değeri ne kadar büyük olursa, gösterge o kadar uzun vadeli eğil
Этот индикатор представляет гибридный фильтр основанный на совместном использовании медианы и скользящей средней. Использование медианы позволяет отфильтровывать аномальные выбросы и случайные импульсы в значениях ценового ряда. При этом на трендовую составляющую медианный фильтр не действует, оставляя ее без изменений. Так как медианный фильтр является нелинейным, то для сглаживания его значений используется скользящая средняя. Такой подход позволяет более точно выделять не только тренд, но и п
This indicator is a combination of two modified Lanczos filters. The first filter serves to extrapolate the price. Based on past values, he predicts a possible price movement within the current bar. That is, it shows what the price would be if the past trends remained unchanged. The second filter for smoothing and averaging prices within the window, determined by the level of the filter. Thanks to the selection of weights, this filter is most actively responding to the periodic component that is
The script is based on the simulation of trade transactions using a random number generator. This allows you to get completely different results, even with the same input parameters. When you run the script, a dialog box opens in which you can set the desired values ​​for external variables. In the Trading options block, the basic parameters that are necessary for trading modeling are defined. Start Balance - sets the initial size of the trade balance. Number Trade - sets the number of trade tr
FREE
This script is designed so that the trader can determine the average duration of trade transactions, at which the ratio of possible profits and losses will be optimal. First, let's look at the general approach to determining the optimal duration of trade transactions. We introduce the following variables: R   - the result of the transaction; T   - the time during which the transaction was open; W - the time between the closing of the previous transaction and the opening of the next one. Every tr
FREE
Let's look at the nature of price changes in the Forex market, not paying attention to the reasons why these changes occur. This approach will allow us to identify the main factors affecting the price movement. For example, let's take the opening prices of bars on the EUR-USD currency pair and the H1 timeframe. For these prices, we construct the Lameray diagram (Figure 1). In this diagram, it can be seen that the price movement basically occurs according to a linear equation. To determine the pa
This indicator is more informative. His work is based on the assumption that the price movement in the market can be represented as noise of a particular color, which depends on the parameters of the distribution of price values. Thanks to this, it is possible to analyze the price change from different angles, and considering the price movement as noise of a particular color, one can get information about the current state of affairs in the market and make a forecast about the price behavior. W
Despite some drawbacks of the “ AIS Color Noise Filter ” indicator, the idea to use it to smooth the price series and forecast prices looks quite attractive. This is due to several reasons: first, taking into account several noise components allows building a forecast on factors independent of each other, which can improve the quality of forecasting; secondly, the noise characteristics of the price series behave quite stably throughout the entire history, which makes it possible to obtain stabl
In order to isolate long-term and non-random components, it is necessary to know not only how much the price has changed, but also how these changes occurred. In other words - we are interested not only in the values ​​of price levels, but also in the order in which these levels replace each other. Through this approach, one can find long-term and stable factors that influence (or may influence) the price change at a given point in time. And knowledge of these factors allows you to make a more
One of the powerful methods of analysis is the modeling of financial series using Levy processes. The main advantage of these processes is that they can be used to model a huge number of phenomena - from the simplest to the most complex. Suffice it to say that the idea of ​​the fractal price movement in the market is only a special case of Levy processes. On the other hand, with proper selection of parameters, any Levy process can be represented as a simple moving average. Figure 1 shows an exa
Very often, the trader is faced with the task of determining the extent to which the price may change in the near future. For this purpose, you can use the Johnson distribution type SB. The main advantage of this distribution is that it can be used even with a small amount of accumulated data. The empirical approach used in determining the parameters of this distribution, allows you to accurately determine the maximum and minimum levels of the price channel. These values ​​can be used in differ
This indicator allows you to determine the likelihood that the price will reach one or another level. Its algorithm is quite simple and is based on the use of statistical data on the price levels of a particular currency pair. Thanks to the collected historical data, it is possible to determine the extent to which the price will change during the current bar. Despite its simplicity, this indicator can provide invaluable assistance in trading. So, with its help it is possible to determine TakePr
Stable distributions can be used to smooth financial series. Since a fairly deep history can be used to calculate the distribution parameters, such smoothing may in some cases be even more effective than other methods. The figure shows an example of the distribution of the opening prices of the currency pair " EUR-USD " on the time frame H1 for ten years (figure 1). Looks fascinating, doesn't it? The main idea behind this indicator is to determine the parameters of a stable distribution based
When making trading decisions, it is useful to rely not only on historical data, but also on the current market situation. In order to make it more convenient to monitor current trends in market movement, you can use the AIS Current Price Filter  indicator. This indicator takes into account only the most significant price changes in one direction or another. Thanks to this, it is possible to predict short-term trends in the near future - no matter how the current market situation develops, soon
When analyzing financial time series, researchers most often make a preliminary assumption that prices are distributed according to the normal (Gaussian) law. This approach is due to the fact that a large number of real processes can be simulated using the normal distribution. Moreover, the calculation of the parameters of this distribution presents no great difficulties. However, when applied to financial markets, normal distribution does not always work. The returns on financial instruments of
The Cauchy distribution is a classic example of a fat-tailed distribution. Thick tails indicate that the probability of a random variable deviating from the central trend is very high. So, for a normal distribution, the deviation of a random variable from its mathematical expectation by 3 or more standard deviations is extremely rare (the 3 sigma rule), and for the Cauchy distribution, deviations from the center can be arbitrarily large. This property can be used to simulate price changes in th
Filtrele:
Değerlendirme yok
Değerlendirmeye yanıt