Aleksej Poljakov / Satıcı
Yayınlanmış ürünler

The script analyzes the history of quotes and gives recommendations on the minimum deposit. The calculations take into account the variability of prices and the standard deviation. Margin requirements for the instrument are also taken into account. The result of the script is the minimum recommended deposit for trading the given currency pair.
FREE

This indicator studies the price action as a combination of micro-trends. All micro-trends are analyzed and averaged. Price movement is filtered based on this averaging. IP_High and IP_Low (blue and red dashed lines) show the instantaneous price movement. They display the forecast only for the current price values, taking into account only the number of bars defined by the 'Filter level' parameter. SP_High and SP_Low (blue and red solid lines) smooth the price movements with respect to history.

This indicator studies the price action as a combination of micro-trends. All micro-trends are analyzed and averaged. Price movement is filtered based on this averaging. IP_High and IP_Low (blue and red dashed lines) show the instantaneous price movement. They display the forecast only for the current price values, taking into account only the number of bars defined by the 'Filter level' parameter. SP_High and SP_Low (blue and red solid lines) smooth the price movements with respect to history.

Bu gösterge, bir gün içindeki en büyük ticaret faaliyetinin zamanını belirlemek için tasarlanmıştır. Bu hesaplamadan sonra, gösterge en önemli ticaret seviyelerini oluşturur. Bu seviyeleri fiili fiyat hareketiyle karşılaştırmak, piyasa eğilimlerinin gücü ve yönü hakkında bilgi sağlayabilir.
Göstergenin özellikleri Zaman çerçevesi D1'in altında olmalıdır. Önerilen zaman dilimleri: M15, M30 ve H1. H1'in üzerindeki zaman dilimleri çok kaba bir resim verebilir. Ve M15'in altındaki zaman dilimleri

The script allows selecting the required 'Filter level' value of the AIS-MTF MT5 indicator. Run the script on the required chart and selected timeframe. Once its operation is complete, the HPS.csv file will be created in the Files folder. Open the file. You will see three columns. The 'Filter lvl' column represents the value of the 'Filter level' for the AIS-MTF indicator. Am. dev. - degree and direction of the indicator's deviation from the price level (sorted in ascending order). Negative valu
FREE

The script allows selecting the required 'Filter level' value of the AIS-MTF indicator. Run the script on the required chart and selected timeframe. Once its operation is complete, the HPS.csv file will be created in the Files folder. Open the file. You will see three columns. The 'Filter lvl' column represents the value of the 'Filter level' for the AIS-MTF indicator. Am. dev. - degree and direction of the indicator's deviation from the price level (sorted in ascending order). Negative values i
FREE

This script allows selecting the TakeProfit and StopLoss levels. It analyzes the history data, and then calculates the probability of reaching a given price level.
How the script works Suppose you have a trading strategy and you want to select the TakeProfit and StopLoss levels. Run the script and set the parameter: Number of Bars - the average position holding time in bars. Once the script operation is complete, the AIS-PPL.csv file will be created in the Files folder in the terminal data cat
FREE

This script allows selecting the TakeProfit and StopLoss levels. It analyzes the history data, and then calculates the probability of reaching a given price level.
How the script works Suppose you have a trading strategy and you want to select the TakeProfit and StopLoss levels. Run the script and set the parameter: Number of Bars - the average position holding time in bars. Once the script operation is complete, the AIS-PPL.csv file will be created in the Files folder in the terminal data cat
FREE

The indicator is based on the analysis of interaction of two filters. The first filter is the popular Moving Average. It helps to identify linear price movements and to smooth minor price fluctuations. The second filter is the Sliding Median. It is a non-linear filter. It allows to filter out noise and single spikes in the price movement. A predictive filter implemented in this indicator is based on the difference between these filters. The indicator is trained during operation and is therefore

The indicator is based on the analysis of interaction of two filters. The first filter is the popular Moving Average. It helps to identify linear price movements and to smooth minor price fluctuations. The second filter is the Sliding Median. It is a non-linear filter. It allows to filter out noise and single spikes in the price movement. A predictive filter implemented in this indicator is based on the difference between these filters. The indicator is trained during operation and is therefore

This indicator uses the Fibonacci p-numbers to smooth a price series. This allows combining the advantages of the simple and exponential moving averages. The smoothing coefficients depend on the level of the p-number, which is set in the indicator parameters. The higher the level, the greater the influence of the simple moving average and the less significant the exponential moving average.
Parameters Fibonacci Numbers Order - order of the Fibonacci p-number, specified by trader. Valid values

When making trading decisions, it is useful to rely not only on historical data, but also on the current market situation. In order to make it more convenient to monitor current trends in market movement, you can use the AIS Current Price Filter indicator. This indicator takes into account only the most significant price changes in one direction or another. Thanks to this, it is possible to predict short-term trends in the near future - no matter how the current market situation develops, soon

When making trading decisions, it is useful to rely not only on historical data, but also on the current market situation. In order to make it more convenient to monitor current trends in market movement, you can use the AIS Current Price Filter indicator. This indicator takes into account only the most significant price changes in one direction or another. Thanks to this, it is possible to predict short-term trends in the near future - no matter how the current market situation develops, so

Stable distributions can be used to smooth financial series. Since a fairly deep history can be used to calculate the distribution parameters, such smoothing may in some cases be even more effective than other methods. The figure shows an example of the distribution of the opening prices of the currency pair " EUR-USD " on the time frame H1 for ten years (figure 1). Looks fascinating, doesn't it?
The main idea behind this indicator is to determine the parameters of a stable distribution bas

Stable distributions can be used to smooth financial series. Since a fairly deep history can be used to calculate the distribution parameters, such smoothing may in some cases be even more effective than other methods. The figure shows an example of the distribution of the opening prices of the currency pair " EUR-USD " on the time frame H1 for ten years (figure 1). Looks fascinating, doesn't it?
The main idea behind this indicator is to determine the parameters of a stable distribution

This indicator allows you to determine the likelihood that the price will reach one or another level. Its algorithm is quite simple and is based on the use of statistical data on the price levels of a particular currency pair. Thanks to the collected historical data, it is possible to determine the extent to which the price will change during the current bar. Despite its simplicity, this indicator can provide invaluable assistance in trading. So, with its help it is possible to determine TakePr

This indicator allows you to determine the likelihood that the price will reach one or another level. Its algorithm is quite simple and is based on the use of statistical data on the price levels of a particular currency pair. Thanks to the collected historical data, it is possible to determine the extent to which the price will change during the current bar. Despite its simplicity, this indicator can provide invaluable assistance in trading. So, with its help it is possible to determine TakePr

Very often, the trader is faced with the task of determining the extent to which the price may change in the near future. For this purpose, you can use the Johnson distribution type SB. The main advantage of this distribution is that it can be used even with a small amount of accumulated data. The empirical approach used in determining the parameters of this distribution, allows you to accurately determine the maximum and minimum levels of the price channel. These values can be used in differ

Very often, the trader is faced with the task of determining the extent to which the price may change in the near future. For this purpose, you can use the Johnson distribution type SB. The main advantage of this distribution is that it can be used even with a small amount of accumulated data. The empirical approach used in determining the parameters of this distribution, allows you to accurately determine the maximum and minimum levels of the price channel. These values can be used in differ

One of the powerful methods of analysis is the modeling of financial series using Levy processes. The main advantage of these processes is that they can be used to model a huge number of phenomena - from the simplest to the most complex. Suffice it to say that the idea of the fractal price movement in the market is only a special case of Levy processes. On the other hand, with proper selection of parameters, any Levy process can be represented as a simple moving average. Figure 1 shows an exa

One of the powerful methods of analysis is the modeling of financial series using Levy processes. The main advantage of these processes is that they can be used to model a huge number of phenomena - from the simplest to the most complex. Suffice it to say that the idea of the fractal price movement in the market is only a special case of Levy processes. On the other hand, with proper selection of parameters, any Levy process can be represented as a simple moving average. Figure 1 shows an exa

In order to isolate long-term and non-random components, it is necessary to know not only how much the price has changed, but also how these changes occurred. In other words - we are interested not only in the values of price levels, but also in the order in which these levels replace each other. Through this approach, one can find long-term and stable factors that influence (or may influence) the price change at a given point in time. And knowledge of these factors allows you to make a more

In order to isolate long-term and non-random components, it is necessary to know not only how much the price has changed, but also how these changes occurred. In other words - we are interested not only in the values of price levels, but also in the order in which these levels replace each other. Through this approach, one can find long-term and stable factors that influence (or may influence) the price change at a given point in time. And knowledge of these factors allows you to make a more

Very often, in the study of financial series apply their smoothing. Using smoothing, you can remove high-frequency components - it is believed that they are caused by random factors and therefore irrelevant. Smoothing always includes some way of averaging the data, in which random changes in the time series mutually absorb each other. Most often, for this purpose, simple or weighted moving average methods are used, as well as exponential smoothing. Each of these methods has its advantages and d

Very often, in the study of financial series apply their smoothing. Using smoothing, you can remove high-frequency components - it is believed that they are caused by random factors and therefore irrelevant. Smoothing always includes some way of averaging the data, in which random changes in the time series mutually absorb each other. Most often, for this purpose, simple or weighted moving average methods are used, as well as exponential smoothing. Each of these methods has its advantages and d

Despite some drawbacks of the “ AIS Color Noise Filter ” indicator, the idea to use it to smooth the price series and forecast prices looks quite attractive. This is due to several reasons: first, taking into account several noise components allows building a forecast on factors independent of each other, which can improve the quality of forecasting; secondly, the noise characteristics of the price series behave quite stably throughout the entire history, which makes it possible to obtain stabl

Despite some drawbacks of the “ AIS Color Noise Filter ” indicator, the idea to use it to smooth the price series and forecast prices looks quite attractive. This is due to several reasons: first, taking into account several noise components allows building a forecast on factors independent of each other, which can improve the quality of forecasting; secondly, the noise characteristics of the price series behave quite stably throughout the entire history, which makes it possible to obtain stabl

This indicator is more informative. His work is based on the assumption that the price movement in the market can be represented as noise of a particular color, which depends on the parameters of the distribution of price values. Thanks to this, it is possible to analyze the price change from different angles, and considering the price movement as noise of a particular color, one can get information about the current state of affairs in the market and make a forecast about the price behavior. W

This indicator is more informative. His work is based on the assumption that the price movement in the market can be represented as noise of a particular color, which depends on the parameters of the distribution of price values. Thanks to this, it is possible to analyze the price change from different angles, and considering the price movement as noise of a particular color, one can get information about the current state of affairs in the market and make a forecast about the price behavior. W

Let's look at the nature of price changes in the Forex market, not paying attention to the reasons why these changes occur. This approach will allow us to identify the main factors affecting the price movement. For example, let's take the opening prices of bars on the EUR-USD currency pair and the H1 timeframe. For these prices, we construct the Lameray diagram (Figure 1). In this diagram, it can be seen that the price movement basically occurs according to a linear equation. To determine the pa

Let's look at the nature of price changes in the Forex market, not paying attention to the reasons why these changes occur. This approach will allow us to identify the main factors affecting the price movement. For example, let's take the opening prices of bars on the EUR-USD currency pair and the H1 timeframe. For these prices, we construct the Lameray diagram (Figure 1). In this diagram, it can be seen that the price movement basically occurs according to a linear equation. To determine the pa

The indicator is designed to measure the price volatility. This allows determining the moments for opening or closing trade positions more accurately. High intensity of the market indicates the instability of its movement, but allows for better results. And, conversely, low intensity of the market indicates the stability of its movement.
Parameters Bars to process - the number of bars to measure the price movements. A low value of this parameter allows determining the moments of rapid price mo

Bu gösterge, basit bir doğrusal yumuşatma işlemi uygular.
Üstel yumuşatmanın dezavantajlarından biri, sinyalin hızlı bozulmasıdır. Bu, fiyat aralığındaki uzun vadeli eğilimleri tam olarak takip etmeyi imkansız hale getirir. Doğrusal yumuşatma, sinyal filtrelemeyi daha doğru ve ince bir şekilde ayarlamanıza olanak tanır.
Gösterge, parametreler seçilerek yapılandırılır:
LP - bu parametre, yumuşatma süresini seçmenize olanak tanır. Değeri ne kadar büyük olursa, gösterge o kadar uzun vadeli e

This indicator is a sequential hybrid filter based on a combination of median and moving average properties.
Using the median allows filtering out abnormal outliers and random impulses in the values of the price series. At the same time, the median filter does not act on the trend in price movement, leaving it unchanged. Since the median filter is non-linear, averaging using a simple moving average is used to smooth its values. This approach allows us to more accurately identify not only the

Этот индикатор представляет гибридный фильтр основанный на совместном использовании медианы и скользящей средней. Использование медианы позволяет отфильтровывать аномальные выбросы и случайные импульсы в значениях ценового ряда. При этом на трендовую составляющую медианный фильтр не действует, оставляя ее без изменений. Так как медианный фильтр является нелинейным, то для сглаживания его значений используется скользящая средняя. Такой подход позволяет более точно выделять не только тренд, но и п

This indicator is a combination of two modified Lanczos filters. The first filter serves to extrapolate the price. Based on past values, he predicts a possible price movement within the current bar. That is, it shows what the price would be if the past trends remained unchanged. The second filter for smoothing and averaging prices within the window, determined by the level of the filter. Thanks to the selection of weights, this filter is most actively responding to the periodic component that is

This indicator is a combination of two modified Lanczos filters. The first filter serves to extrapolate the price. Based on past values, he predicts a possible price movement within the current bar. That is, it shows what the price would be if the past trends remained unchanged. The second filter for smoothing and averaging prices within the window, determined by the level of the filter. Thanks to the selection of weights, this filter is most actively responding to the periodic component that is

The arithmetic mean or median can be used to determine the measure of the central trend of a time series. Both methods have some disadvantages. The arithmetic mean is calculated by the Simple Moving Average indicator. It is sensitive to emissions and noise. The median behaves more steadily, but there is a loss of information at the boundaries of the interval. In order to reduce these disadvantages, pseudo-median signal filtering can be used. To do this, take the median of a small length and rec

The arithmetic mean or median can be used to determine the measure of the central trend of a time series. Both methods have some disadvantages. The arithmetic mean is calculated by the Simple Moving Average indicator. It is sensitive to emissions and noise. The median behaves more steadily, but there is a loss of information at the boundaries of the interval. In order to reduce these disadvantages, pseudo-median signal filtering can be used. To do this, take the median of a small length and rec

AIS Advanced Grade Fizibilite göstergesi, fiyatın gelecekte ulaşabileceği seviyeleri tahmin etmek için tasarlanmıştır. Görevi, son üç çubuğu analiz etmek ve buna dayalı bir tahmin oluşturmaktır. Gösterge herhangi bir zaman diliminde ve herhangi bir döviz çiftinde kullanılabilir. Ayarların yardımıyla, tahminin istenen kalitesini elde edebilirsiniz.
Tahmin derinliği - istenen tahmin derinliğini çubuklar halinde ayarlar. Bu parametrenin 18-31 aralığında seçilmesi önerilir. Bu sınırların ötesine

AIS Ağırlıklı Hareketli Ortalama göstergesi, ağırlıklı bir hareketli ortalama hesaplar ve trend olan bir piyasa hareketinin başlangıcını belirlemenize olanak tanır.
Ağırlık katsayıları, her bir çubuğun belirli özellikleri dikkate alınarak hesaplanır. Bu, rastgele piyasa hareketlerini filtrelemenize olanak tanır.
Bir trendin başladığını teyit eden ana sinyal, gösterge çizgilerinin yönündeki bir değişiklik ve gösterge çizgilerini geçen fiyattır.
WH (mavi çizgi), Yüksek fiyatların ağırlıklı

AIS Doğru Ortalamalar göstergesi, piyasadaki bir trend hareketinin başlangıcını belirlemenizi sağlar. Göstergenin bir diğer önemli kalitesi, trendin sonunun açık bir işaretidir. Gösterge yeniden çizilmez veya yeniden hesaplanmaz.
Görüntülenen Değerler h_AE - AE kanalının üst sınırı
l_AE - AE kanalının alt sınırı
h_EC - Mevcut çubuk için yüksek tahmin edilen değer
l_EC - Mevcut çubuk için düşük tahmin edilen değer
Gösterge ile çalışırken sinyaller Ana sinyal, AE ve EC kanallarının kesi

Bu komut dosyası, çeşitli pencere işlevlerinde ağırlıkları değerlendirmek için tasarlanmıştır. Bu pencere işlevleri üzerine kurulu bir gösterge https://www.mql5.com/ru/market/product/72159 adresinden indirilebilir. Giriş parametreleri: iPeriod – gösterge dönemi. iDönem >= 2 iCenter, pencere işlevinin merkezinin bulunacağı referansın dizinidir. Varsayılan olarak, bu parametre 0'dır - pencerenin merkezi, göstergenin merkeziyle çakışır. 1 <= iCenter <= iPeriod ile, pencere işlevinin merkezi ka
FREE

Bu komut dosyası, çeşitli pencere işlevlerinde ağırlıkları değerlendirmek için tasarlanmıştır. Bu pencere işlevleri üzerine kurulu bir gösterge https://www.mql5.com/ru/market/product/72160 adresinden indirilebilir. Giriş parametreleri: iPeriod – gösterge dönemi. iDönem >= 2 iCenter, pencere işlevinin merkezinin bulunacağı referansın dizinidir. Varsayılan olarak, bu parametre 0'dır - pencerenin merkezi, göstergenin merkeziyle çakışır. 1 <= iCenter <= iPeriod ile, pencere işlevinin merkezi kaydır
FREE
Zaman serilerini yumuşatmak için çeşitli pencere işlevleri kullanılabilir. Pencere işlevleri, özellikleri bakımından birbirinden oldukça farklı olabilir - yumuşatma seviyesi, gürültü bastırma vb. Bu gösterge, ana pencere işlevlerini uygulamanıza ve finansal zaman serilerindeki performanslarını değerlendirmenize olanak tanır. Gösterge parametreleri: iPeriod – gösterge dönemi. iDönem >= 2 iCenter , pencere işlevinin merkezinin bulunacağı referansın dizinidir. Varsayılan olarak, bu parametre 0'd
Zaman serilerini yumuşatmak için çeşitli pencere işlevleri kullanılabilir. Pencere işlevleri, özellikleri bakımından birbirinden oldukça farklı olabilir - yumuşatma seviyesi, gürültü bastırma vb. Bu gösterge, ana pencere işlevlerini uygulamanıza ve finansal zaman serilerindeki performanslarını değerlendirmenize olanak tanır. Gösterge parametreleri: iPeriod – gösterge dönemi. iDönem >= 2 iCenter , pencere işlevinin merkezinin bulunacağı referansın dizinidir. Varsayılan olarak, bu parametre 0'd

Sayı dizilerinden birine "Orman Yangını Dizisi" denir. En güzel yeni dizilerden biri olarak kabul edildi. Başlıca özelliği, bu dizinin lineer trendlerden, hatta en kısa olanlardan kaçınmasıdır. Bu göstergenin temelini oluşturan bu özelliktir. Bir finansal zaman serisini analiz ederken, bu gösterge tüm olası trend seçeneklerini reddetmeye çalışır. Ve ancak başarısız olursa, bir trendin varlığını tanır ve uygun sinyali verir. Bu yaklaşım, yeni trendlerin başladığı anların doğru bir şekilde belirl

Sayı dizilerinden birine "Orman Yangını Dizisi" denir. En güzel yeni dizilerden biri olarak kabul edildi. Başlıca özelliği, bu dizinin lineer trendlerden, hatta en kısa olanlardan kaçınmasıdır. Bu göstergenin temelini oluşturan bu özelliktir. Bir finansal zaman serisini analiz ederken, bu gösterge tüm olası trend seçeneklerini reddetmeye çalışır. Ve ancak başarısız olursa, bir trendin varlığını tanır ve uygun sinyali verir. Bu yaklaşım, yeni trendlerin başladığı anların doğru bir şekilde belirl

Bu gösterge ogive şekillerine dayanmaktadır. Bu tür şekiller aerodinamik ve uzay teknolojisinde kullanılır. Mermilerin bile bir çeşit ogival şekli vardır. Bu tür formların teknik bir göstergede kullanılması, göstergenin hassasiyeti ile istikrarı arasında bir uzlaşmaya varılmasını mümkün kılar. Bu, uygulamasında ek olanaklar sağlar. Gösterge parametreleri: iType - ogive formunun türü. iPeriod - gösterge dönemi. iFactor , parabolik ve üstel formlarda kullanılan ek bir parametredir. Geçerli de

Bu gösterge ogive şekillerine dayanmaktadır. Bu tür şekiller aerodinamik ve uzay teknolojisinde kullanılır. Mermilerin bile bir çeşit ogival şekli vardır. Bu tür formların teknik bir göstergede kullanılması, göstergenin hassasiyeti ile istikrarı arasında bir uzlaşmaya varılmasını mümkün kılar. Bu, uygulamasında ek olanaklar sağlar. Gösterge parametreleri: iType - ogive formunun türü. iPeriod - gösterge dönemi. iFactor , parabolik ve üstel formlarda kullanılan ek bir parametredir. Geçerli değer

Bu gösterge, ağırlık katsayıları olarak sözde "kötü" sayıları kullanır. Karşıtları, bu göstergede de sunulan "iğrenç" sayılardır. Sayıların bu iki sınıfa bölünmesi, belirli bir sayının ikili gösterimindeki birim sayısı ile belirlenen Hamming ağırlığı ile ilişkilidir. Bu sayıları ağırlıklandırma faktörleri olarak kullanmak, trend izleyen bir göstergeyle sonuçlanır. Ayrıca, iğrenç sayılar daha hassas bir gösterge verir ve kötü sayılar muhafazakar bir gösterge verir. Aralarındaki fark çok büyük de

Bu gösterge, ağırlık katsayıları olarak sözde "kötü" sayıları kullanır. Karşıtları, bu göstergede de sunulan "iğrenç" sayılardır. Sayıların bu iki sınıfa bölünmesi, belirli bir sayının ikili gösterimindeki birim sayısı ile belirlenen Hamming ağırlığı ile ilişkilidir. Bu sayıları ağırlıklandırma faktörleri olarak kullanmak, trend izleyen bir göstergeyle sonuçlanır. Ayrıca, iğrenç sayılar daha hassas bir gösterge verir ve kötü sayılar muhafazakar bir gösterge verir. Aralarındaki fark çok büyük de
Bu ticaret uzmanının temel amacı, takip eden durdurma işlevlerini yerine getirmektir. Pozisyonları açmaz veya kapatmaz, sadece setler ve hareketler kar alır ve zararı durdurur. Kar al ve zararı durdur hesaplamak için fiyat hareketi istatistikleri ve D. Bernoulli'nin ahlaki beklentisi kullanılır. Bu nedenle, uzman tarafından belirlenen yeni seviyeler, risk/ödül oranı açısından (mümkün olanın) en iyi seçeneğini sunar. Ticaret robotunun parametrelerine bakalım.
Tracked Symbols - EA tarafından
Bu ticaret uzmanının temel amacı, takip eden durdurma işlevlerini yerine getirmektir. Pozisyonları açmaz veya kapatmaz, sadece setler ve hareketler kar alır ve zararı durdurur. Kar al ve zararı durdur hesaplamak için fiyat hareketi istatistikleri ve D. Bernoulli'nin ahlaki beklentisi kullanılır. Bu nedenle, uzman tarafından belirlenen yeni seviyeler, risk/ödül oranı açısından (mümkün olanın) en iyi seçeneğini sunar. Ticaret robotunun parametrelerine bakalım.
Tracked Symbols - EA tarafından iz
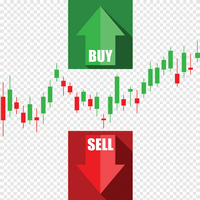
Bu gösterge, fiyat serisinin yerel en yüksek ve en düşük seviyelerini kullanır. Ekstremi vurguladıktan sonra değerleri yumuşatılır. Bu sayede iki kanal inşa edilmiştir - harici ve dahili. Fiyat hareketi kesinlikle lineer bir trend izliyorsa, dahili kanal limitleri gösterir. Dış kanal, logaritmik bir eğilim ile fiyat hareketinin sınırlarını gösterir. Gösterge, kanalları hesapladıktan sonra gerçek fiyat hareketini analiz eder ve pozisyonların açılması ve kapanması için öneriler sunar. Mavi noktal
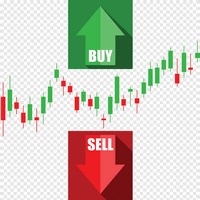
Bu gösterge, fiyat serisinin yerel en yüksek ve en düşük seviyelerini kullanır. Ekstremi vurguladıktan sonra değerleri yumuşatılır. Bu sayede iki kanal inşa edilmiştir - harici ve dahili. Fiyat hareketi kesinlikle lineer bir trend izliyorsa, dahili kanal limitleri gösterir. Dış kanal, logaritmik bir eğilim ile fiyat hareketinin sınırlarını gösterir. Gösterge, kanalları hesapladıktan sonra gerçek fiyat hareketini analiz eder ve pozisyonların açılması ve kapanması için öneriler sunar. Mavi noktal
Hipergeometrik seri, bu filtrenin ağırlık katsayılarını hesaplamak için kullanılır. Bu yaklaşım, zaman serilerinde oldukça ilginç bir düzeltme elde etmenizi sağlar. Hipergeometrik filtre ağırlıkları, üstel ve doğrusal ağırlıklı hareketli ortalamalar kadar hızlı azalmaz, ancak düzleştirilmiş hareketli ortalamalardan daha hızlı bozulur. Bu nedenle, bu filtrenin davranışı birçok yönden hareketli ortalamaların davranışına benzer. Ancak, birkaç avantajı vardır. Gecikmesi, hareketli ortalamanınkinden
Hipergeometrik seri, bu filtrenin ağırlık katsayılarını hesaplamak için kullanılır. Bu yaklaşım, zaman serilerinde oldukça ilginç bir düzeltme elde etmenizi sağlar. Hipergeometrik filtre ağırlıkları, üstel ve doğrusal ağırlıklı hareketli ortalamalar kadar hızlı azalmaz, ancak düzleştirilmiş hareketli ortalamalardan daha hızlı bozulur. Bu nedenle, bu filtrenin davranışı birçok yönden hareketli ortalamaların davranışına benzer. Ancak, birkaç avantajı vardır. Gecikmesi, hareketli ortalamanınkinden
Bu gösterge, optimum kar al ve zararı durdur seviyelerini gösterir. Bu seviyeler geçmiş verilere dayalı olarak hesaplanır. İlk başlangıçta, gösterge tarih konusunda eğitilir. Bundan sonra, fiyatın gelecekte şu veya bu seviyenin üstesinden gelme olasılığını değerlendirir ve stop emri vermek için en uygun seçenekleri seçer. Örneğin, kârı al değerleri, kârın maksimum olması ve fiyatın seviyesine ulaşma olasılığının mümkün olan en yüksek olması için seçilir. Durdurma kaybı seviyesi minimum olmalıdı
Bu gösterge, optimum kar al ve zararı durdur seviyelerini gösterir. Bu seviyeler geçmiş verilere dayalı olarak hesaplanır. İlk başlangıçta, gösterge tarih konusunda eğitilir. Bundan sonra, fiyatın gelecekte şu veya bu seviyenin üstesinden gelme olasılığını değerlendirir ve stop emri vermek için en uygun seçenekleri seçer. Örneğin, kârı al değerleri, kârın maksimum olması ve fiyatın seviyesine ulaşma olasılığının mümkün olan en yüksek olması için seçilir. Durdurma kaybı seviyesi minimum olmalıdı

Bu filtre, Bessel polinomlarına dayanmaktadır. Ana avantajı, küçük bir zaman gecikmesidir. Bu filtrenin bir diğer özelliği de finansal zaman serilerinin en son değerlerine karşı yüksek duyarlılığıdır. Bu nedenle gösterge, gürültü sapmalarını yumuşatırken aktif fiyat hareketlerini vurgular. Klasik varyanta ek olarak, bir ağırlık fonksiyonu olarak göstergeye Bessel katsayılarının logaritmaları eklenmiştir. Bu durumda, göstergenin daha yumuşak olduğu ortaya çıkıyor, ancak aynı zamanda fiyat aktif

Bu filtre, Bessel polinomlarına dayanmaktadır. Ana avantajı, küçük bir zaman gecikmesidir. Bu filtrenin bir diğer özelliği de finansal zaman serilerinin en son değerlerine karşı yüksek duyarlılığıdır. Bu nedenle gösterge, gürültü sapmalarını yumuşatırken aktif fiyat hareketlerini vurgular. Klasik varyanta ek olarak, bir ağırlık fonksiyonu olarak göstergeye Bessel katsayılarının logaritmaları eklenmiştir. Bu durumda, göstergenin daha yumuşak olduğu ortaya çıkıyor, ancak aynı zamanda fiyat aktif

Bu gösterge, ayrık Hartley dönüşümüne dayanmaktadır. Bu dönüşümü kullanmak, finansal zaman serilerini işlerken farklı yaklaşımlar uygulamanıza olanak tanır. Bu göstergenin ayırt edici bir özelliği, okumalarının grafikteki bir noktaya değil, gösterge döneminin tüm noktalarına atıfta bulunmasıdır. Bir zaman serisini işlerken gösterge, zaman serisinin çeşitli öğelerini seçmenize olanak tanır. İlk filtreleme olasılığı bu yaklaşım üzerine kuruludur - tüm gereksiz yüksek frekanslı bileşenler basitçe

Bu gösterge, ayrık Hartley dönüşümüne dayanmaktadır. Bu dönüşümü kullanmak, finansal zaman serilerini işlerken farklı yaklaşımlar uygulamanıza olanak tanır. Bu göstergenin ayırt edici bir özelliği, okumalarının grafikteki bir noktaya değil, gösterge döneminin tüm noktalarına atıfta bulunmasıdır. Bir zaman serisini işlerken gösterge, zaman serisinin çeşitli öğelerini seçmenize olanak tanır. İlk filtreleme olasılığı bu yaklaşım üzerine kuruludur - tüm gereksiz yüksek frekanslı bileşenler basitçe

Lehmer ortalaması, ağırlık katsayıları hesaplamada kullanılan değişkenlerin değerlerine bağlı olan bir pencere işlevi olarak düşünülebilir. Bu ortalama doğrusal değildir, çünkü hesaplamasında üs alma kullanılır. Göstergenin özellikleri iki parametreye bağlıdır: iPeriod - gösterge dönemi, geçerli değer 2'ye eşit veya daha büyük; iPower - gösterge değerleri hesaplanırken kullanılan üs. Geçerli aralık: -32768 - 32767
iPower = 0 ile harmonik ortalamayı elde ederiz, iPower = 1 ile - aritmetik

Lehmer ortalaması, ağırlık katsayıları hesaplamada kullanılan değişkenlerin değerlerine bağlı olan bir pencere işlevi olarak düşünülebilir. Bu ortalama doğrusal değildir, çünkü hesaplamasında üs alma kullanılır. Göstergenin özellikleri iki parametreye bağlıdır: iPeriod - gösterge dönemi, geçerli değer 2'ye eşit veya daha büyük; iPower - gösterge değerleri hesaplanırken kullanılan üs. Geçerli aralık: -32768 - 32767
iPower = 0 ile harmonik ortalamayı elde ederiz, iPower = 1 ile - aritmetik orta

Kolmogorov-Zhurbenko filtresi, spektral sızıntıyı ortadan kaldırmak için tasarlanmış özel bir pencere işlevi olarak düşünülebilir. Bu filtre, stokastik (finansal dahil) zaman serilerini yumuşatmak için idealdir. Bu filtreye dayalı gösterge aşağıdaki parametreleri içerir: iLength - filtreyi oluşturmak için kullanılan orijinal dikdörtgen pencerenin süresi. Geçerli değer 2 - 255'tir. iDegree - filtre sırası. iDegree=0 ise, basit bir hareketli ortalama elde edilecektir. iDegree=1 ise, üçgen hareket

Kolmogorov-Zhurbenko filtresi, spektral sızıntıyı ortadan kaldırmak için tasarlanmış özel bir pencere işlevi olarak düşünülebilir. Bu filtre, stokastik (finansal dahil) zaman serilerini yumuşatmak için idealdir. Bu filtreye dayalı gösterge aşağıdaki parametreleri içerir: iLength - filtreyi oluşturmak için kullanılan orijinal dikdörtgen pencerenin süresi. Geçerli değer 2 - 255'tir. iDegree - filtre sırası. iDegree=0 ise, basit bir hareketli ortalama elde edilecektir. iDegree=1 ise, üçgen hareket

The trend allows you to predict the price movement and determine the main directions of the conclusion of transactions. The construction of trend lines is possible using various methods suitable for the trader's trading style. This indicator calculates the parameters of the trend movement based on the von Mises distribution. Using this distribution makes it possible to obtain stable values of the trend equation. In addition to calculating the trend, the levels of possible deviations up and dow

The trend allows you to predict the price movement and determine the main directions of the conclusion of transactions. The construction of trend lines is possible using various methods suitable for the trader's trading style. This indicator calculates the parameters of the trend movement based on the von Mises distribution. Using this distribution makes it possible to obtain stable values of the trend equation. In addition to calculating the trend, the levels of possible deviations up and do

When analyzing financial time series, researchers most often make a preliminary assumption that prices are distributed according to the normal (Gaussian) law. This approach is due to the fact that a large number of real processes can be simulated using the normal distribution. Moreover, the calculation of the parameters of this distribution presents no great difficulties. However, when applied to financial markets, normal distribution does not always work. The returns on financial instruments of

When analyzing financial time series, researchers most often make a preliminary assumption that prices are distributed according to the normal (Gaussian) law. This approach is due to the fact that a large number of real processes can be simulated using the normal distribution. Moreover, the calculation of the parameters of this distribution presents no great difficulties. However, when applied to financial markets, normal distribution does not always work. The returns on financial instruments of

The Cauchy distribution is a classic example of a fat-tailed distribution. Thick tails indicate that the probability of a random variable deviating from the central trend is very high. So, for a normal distribution, the deviation of a random variable from its mathematical expectation by 3 or more standard deviations is extremely rare (the 3 sigma rule), and for the Cauchy distribution, deviations from the center can be arbitrarily large. This property can be used to simulate price changes in th

The Cauchy distribution is a classic example of a fat-tailed distribution. Thick tails indicate that the probability of a random variable deviating from the central trend is very high. So, for a normal distribution, the deviation of a random variable from its mathematical expectation by 3 or more standard deviations is extremely rare (the 3 sigma rule), and for the Cauchy distribution, deviations from the center can be arbitrarily large. This property can be used to simulate price changes in th
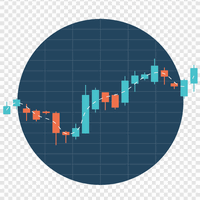
Some traders are guided by trading sessions during trading. Figure 1 shows the average price swing over one week. It can be seen that trading sessions on different days differ in their duration and activity. This indicator is designed to estimate the average price movement at certain intervals within a weekly cycle. It takes into account price movements up and down separately from each other and makes it possible to determine the moments when high volatility is possible in the market. On the ch
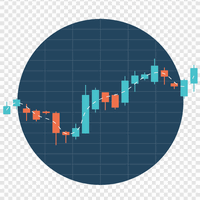
Some traders are guided by trading sessions during trading. Figure 1 shows the average price swing over one week. It can be seen that trading sessions on different days differ in their duration and activity. This indicator is designed to estimate the average price movement at certain intervals within a weekly cycle. It takes into account price movements up and down separately from each other and makes it possible to determine the moments when high volatility is possible in the market. On the ch

The script is based on the simulation of trade transactions using a random number generator. This allows you to get completely different results, even with the same input parameters. When you run the script, a dialog box opens in which you can set the desired values for external variables. In the Trading options block, the basic parameters that are necessary for trading modeling are defined. Start Balance - sets the initial size of the trade balance. Number Trade - sets the number of trad
FREE

The script is based on the simulation of trade transactions using a random number generator. This allows you to get completely different results, even with the same input parameters. When you run the script, a dialog box opens in which you can set the desired values for external variables. In the Trading options block, the basic parameters that are necessary for trading modeling are defined. Start Balance - sets the initial size of the trade balance. Number Trade - sets the number of trade tr
FREE

Choosing the levels of StopLoss and TakeProfit can have a very strong impact on the overall performance of trading. In addition to the obvious parameters of a trade transaction - the size of a possible win or probable loss - the levels of StopLoss and TakeProfit also affect the expected duration of the transaction, and the profitability of trading in general. If you have already determined the optimal transaction duration using the “ AIS-ODT ” script, then you can begin to determine the paramete
FREE

Choosing the levels of StopLoss and TakeProfit can have a very strong impact on the overall performance of trading. In addition to the obvious parameters of a trade transaction - the size of a possible win or probable loss - the levels of StopLoss and TakeProfit also affect the expected duration of the transaction, and the profitability of trading in general. If you have already determined the optimal transaction duration using the “ AIS-ODT ” script, then you can begin to determine the paramete
FREE

This script is designed so that the trader can determine the average duration of trade transactions, at which the ratio of possible profits and losses will be optimal. First, let's look at the general approach to determining the optimal duration of trade transactions. We introduce the following variables: R - the result of the transaction; T - the time during which the transaction was open; W - the time between the closing of the previous transaction and the opening of the next one. Every tr
FREE

This script is designed so that the trader can determine the average duration of trade transactions, at which the ratio of possible profits and losses will be optimal. First, let's look at the general approach to determining the optimal duration of trade transactions. We introduce the following variables: R - the result of the transaction; T - the time during which the transaction was open; W - the time between the closing of the previous transaction and the opening of the next one. Every t
FREE