AIS Adaptive Trend Smoothing

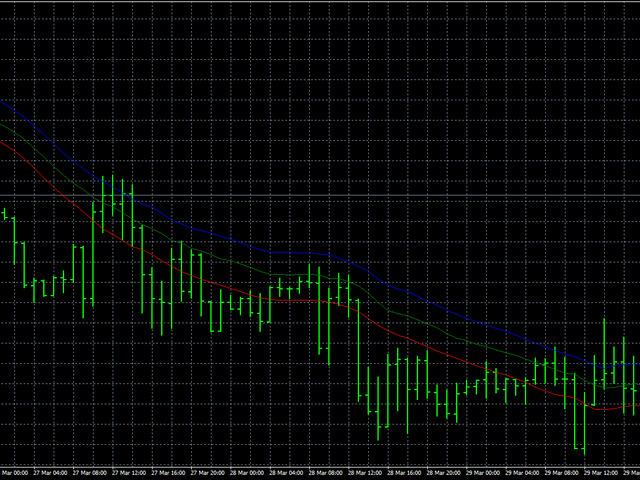
In order to isolate long-term and non-random components, it is necessary to know not only how much the price has changed, but also how these changes occurred. In other words - we are interested not only in the values ​​of price levels, but also in the order in which these levels replace each other. Through this approach, one can find long-term and stable factors that influence (or may influence) the price change at a given point in time. And knowledge of these factors allows you to make a more or less accurate prediction.
Let's determine what specific results we want to get from the analysis of financial series in time:
• first of all we need to highlight the trend, if it is present in the market;
• secondly, we need to identify periodic components;
• thirdly, the results should be sufficiently stable to be used for forecasting;
• and finally, our analysis method should adapt to the current market situation.
In order to fulfill the specified conditions, we use a regression analysis of relative price changes, and make an indicator based on this model. The algorithm of this indicator is based on learning from historical data, and its work is under the complete control of the trader.
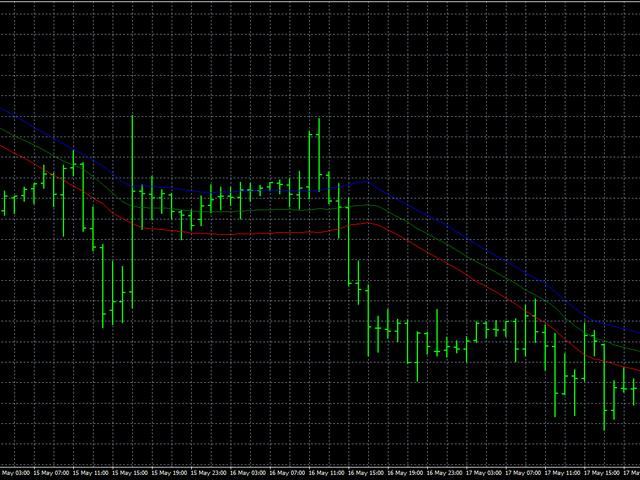
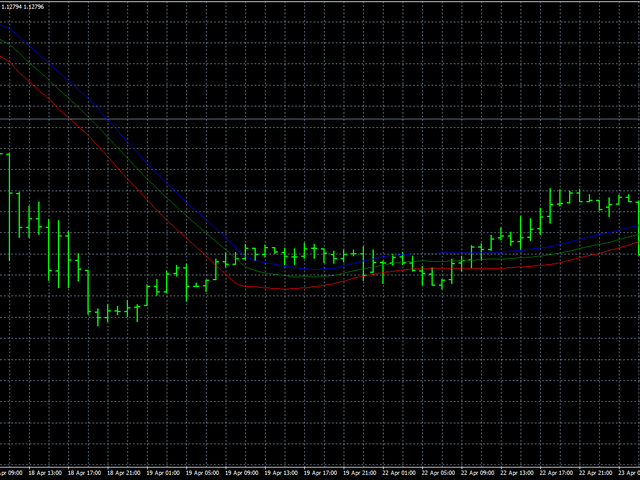
  • LH is a parameter that determines the number of bars used to smooth the financial series. Its allowable value is between 0 - 255.
  • UTS is a parameter that affects the speed and depth of learning. Its value also lies within 0 - 255. If the value of UTS is zero, then learning occurs throughout the history. In all other cases, the training set is updated from time to time. This update occurs the more often the smaller the UTS value.
The main disadvantage of this indicator is that when smoothing the financial series are considered as stationary, which may cause some delay.
Önerilen ürünler
"Dinamik Scalping Osilatörü" - gelişmiş, özel bir Kripto-Forex göstergesi - MT4 için verimli bir işlem aracı! - Yeni nesil Osilatörler - nasıl kullanılacağını görmek için resimlere bakın. - Dinamik Scalping Osilatörü, uyarlanabilir Aşırı Satış/Aşırı Alım bölgelerine sahiptir. - Osilatör, dinamik Aşırı Satış/Aşırı Alım bölgelerinden kesin giriş noktalarını bulmak için yardımcı bir araçtır. - Aşırı Satış değerleri: Yeşil çizginin altında, Aşırı Alım değerleri: Turuncu çizginin üzerinde. - Bu göst
EARLY REMINDER: The Starting price is 65 price will rise soon up to 365$ and then 750$ after first 10 copies of sales. Grab this offer now! Introduction Hello, traders! Welcome to the demonstration of the Forex Beast Indicator , a comprehensive tool designed to assist aspiring traders in navigating the complexities of the forex market. This indicator incorporates seven essential components to provide a well-rounded trading experience: Moving Averages Colored Zones Support and Resistance Levels
Quantum Falcon Signal Free is a smart visual trading indicator for MetaTrader 4 designed for Forex and Gold traders. The indicator combines: • Trend analysis • RSI momentum confirmation • MACD momentum filtering • ATR volatility filtering • Higher timeframe confirmation • Smart exit signal detection Main Features: • Smart Buy and Sell signals • Exit Buy / Exit Sell alerts • Real-time dashboard on chart • Professional candle arrows • Multi-timeframe trend confirmation • ATR market volatility filt
FREE
The indicator allows you to trade binary options. The recommended time frame is М1 and the expiration time is 1,2,3 minutes. The indicator suitable for auto and manual trading. A possible signal is specified as a arrows above/under a candle. You should wait until the candle closes! Arrows are not re-painted Trade sessions: TOKYO section (Half-end) Currency pairs: USD/JPY Working time frame: M1 Expiration time: 1,2,3 minutes. The indicator also shows good results when using the martingale strateg
FREE
SX Supply Demand Zones accurately identifies and draws high-probability Supply and Demand zones using a sophisticated algorithm. Unlike traditional indicators that clutter your chart, this indicator is designed with a focus on performance and a clean user experience. New Unique Feature: Interactive Legend System What truly sets this indicator apart from everything else is the Interactive Control Legend. You have a professional dashboard directly on your chart that allows you to: Show/Hide: Ins
FREE
SuperTrend Alerts adds alerts to the widely popular SuperTrend indicator. As the name suggests, SuperTrend is a trending indicator which works best in trendy (not choppy) markets. SuperTrend is extremely popular for intraday and daily trading, and can be used on any timeframe. Place a call when the price closes above the SuperTrend line, and place a put when the price closes below the SuperTrend line. These crossovers are highlighted by non-repainting up/down arrows. Alerts Email, message and s
Super Reversal Pattern
Parfait Mujinga Ndalika
Super Reversal Pattern Indicator Unlock the power of advanced pattern recognition with our Super Reversal Pattern Indicator. Designed for traders seeking precision and reliability, this indicator identifies one of the most effective reversal patterns in technical analysis, offering a significant edge in your trading strategy. Key Features: Non-Repainting Accuracy: Enjoy the confidence of non-repainting technology. Once a Super Reversal Pattern is detected, it remains static, providing consiste
Double HMA lines MTF
Pavel Zamoshnikov
5 (2)
This is a multi-timeframe version of the popular Hull Moving Average (HMA). The Double HMA MTF Light indicator combines two timeframes on a single chart. The HMA of the higher timeframe defines the trend, and the HMA of the current timeframe defines short-term price movements. The indicator is freely distributed and hasn't audio signals or messages. Its main function is the visualization of price movements. If you need advanced functionality of the HMA multi-timeframe indicator (information ab
FREE
OrderBlock TS Roman
Vladislav Vlastovskii
3.8 (5)
Индикатор строит блоки заказов (БЗ) по торговой системе (ТС) Романа. Поиск блоков осуществляется одновременно на двух таймфремах: текущем и старшем (определяемым в настройках). Для оптимизации и игнорирования устаревших блоков в настройках задается ограничение количества дней в пределах которых осуществляется поиск блоков. Блоки строятся по правилам ТС состоящем из трех шагов: какую свечу вынесли (что?); какой свечой вынесли (чем?); правило отрисовки (как?).
FREE
"Auto FIBO Pro" Crypto_Forex göstergesi - ticarette harika bir yardımcı araçtır! - Gösterge, Fibo seviyelerini ve yerel trend çizgilerini (kırmızı renk) otomatik olarak hesaplar ve grafikte yerleştirir. - Fibonacci seviyeleri, fiyatın tersine dönebileceği önemli alanları gösterir. - En önemli seviyeler %23,6, %38,2, %50 ve %61,8'dir. - Ters scalping veya bölge ızgara ticareti için kullanabilirsiniz. - Auto FIBO Pro göstergesini kullanarak mevcut sisteminizi geliştirmek için birçok fırsat vardır
Binary Options Support Resistance Indicator This indicator is designed for binary options trading and effectively shows retracements from support and resistance levels. Signals appear on the current candle. A red arrow pointing downwards indicates a potential selling opportunity, while a blue arrow pointing upwards suggests buying opportunities. All that needs adjustment is the color of the signal arrows. It is recommended to use it on the M1-M5 timeframes as signals are frequent on these timef
Colored Volume
Seyed Ali Tabatabaei Lotfi
The Colored Volume is a simple, yet useful indicator that paints the color of the volume based on the price direction.  If the price has increased, the volume will be shown in green. If the price has decreased, the volume will be shown in red. This indicator will make it super easy for traders to track volume bars based on price movements. (The settings of the volume bars including line width and color can be manually changed by the trader.)
Simple Long Short Bar A very concise and clear indicator, very easy to understand, but it is very useful for tracking trends. The usage of this indicator is very simple: Long signal: If the price shows signs of a long market, then a yellow box will appear. Short signal: If the price shows signs of a short market, then a blue box will appear. Bull strength: If the size of the box is large, it means the bull strength is strong, and vice versa. Short strength: If the size of the box is small, it m
Smart FVG Indicator MT4 – MetaTrader 4 için Gelişmiş Fair Value Gap Tespiti Smart FVG Indicator MT4, MetaTrader 4 grafikleri üzerinde Fair Value Gap (FVG) alanlarını profesyonel düzeyde tespit eder, izler ve uyarılar üretir. ATR tabanlı filtreleme ile piyasa yapısını dikkate alan akıllı bir algoritmayı birleştirerek gürültüyü azaltır, likiditeye uyum sağlar ve sadece en önemli dengesizlikleri bırakarak daha net işlem kararları almanıza yardımcı olur. Başlıca avantajlar Doğru FVG tespiti: Sadec
FREE
The   True Magic Oscillator   indicator is designed for signal trading. This indicator generates trend signals. It uses many algorithms and indicators to generate this signal. It tries to generate signals from the points with the highest trend potential. This indicator is a complete trading product. This indicator does not need any additional indicators. The indicator is never repainted. The point at which the signal is given does not change.         Features and Recommendations Works wit
[ZhiBiCCI] indicators are suitable for all cycle use, and are also suitable for all market varieties. [ZhiBiCCI] Green solid line is a reversal of bullish divergence. The green dotted line is a classic bullish divergence. [ZhiBiCCI] The solid line to the red is a reverse bearish divergence. The red dotted line is a classical bearish divergence. [ZhiBiCCI] can be set in the parameters (Alert, Send mail, Send notification), set to (true) to send instant signals to the alarm window, email, insta
Этот индикатор - очередная разновидность ЗигЗага, за исключением, он не рисует текущую линию, которая может перерисоваться. Этот индикатор, если нарисовал конечную точку, по закрытому бару, то больше ее не изменяет - это означает смену направления и следующая точка будет другого цвета. Может быть применен как для определения основного движения, при использовании увеличенных параметров, так и непосредственно для входа с минимальным риском.Очень хорошо показывает все волны. Работает с любым инстру
Indicator is based on cycles and moving averages and scans different periods. Better on timeframes started from 15 minutes. The parameters are clear: maximum bars to scan in history and alert settings (sound, email and notifications). Any question please answer in comments. Later MT5 version will be posted. And optimized version to use in the Expert advisors.
Closing average This is a completely new indicator in technical analysis. It is based solely on mathematical calculation. about signals It’s worth going into a buy transaction when the price has crossed the indicator line from bottom to top and it is under the price it is worth entering a deal on sell when the price is below the indicator line This author’s development, he doesn’t use any indicators of technical analysis in his analysis.
Price Magnet — Price Density and Attraction Levels Indicator Price Magnet is a professional analytical tool designed to identify key support and resistance levels based on statistical Price Density. The indicator analyzes a specified historical period and detects price levels where the market spent the most time. These zones act as “magnets,” attracting price action or forming a structural base for potential reversals. Unlike traditional Volume Profile tools, Price Magnet focuses on price-time d
The Super Arrow Indicator provides non-repainting buy and sell signals with exceptional accuracy. Key Features No repainting – confirmed signals remain fixed Clear visual arrows: green for buy, red for sell Real-time alerts via pop-up, sound, and optional email Clean chart view with no unnecessary clutter Works on all markets: Forex, gold, oil, indices, crypto Adjustable Parameters TimeFrame Default: "current time frame" Function: Sets the time frame for indicator calculation Options: Can be set
Skalping instant indicator. The signal to purchase or sale of the basement in conjunction with the value of the indicator arrow. A strong signal is considered when the arrow and the basement indicator that displays four timeframes coincide in the forecast. This indicator contains many algorithms and tasks that have been reduced to one result, which the Skalping instant indicator gives, namely, informs the trader about the direction of the market. Thus, he gives 1. Scalping signal (Figure 1)
PZ Penta O MT4
PZ TRADING SLU
2.33 (3)
The Penta-O is a 6-point retracement harmonacci pattern which usually precedes big market movements. Penta-O patterns can expand and repaint quite a bit. To make things easier this indicator implements a twist: it waits for a donchian breakout in the right direction before signaling the trade. The end result is an otherwise repainting indicator with a very reliable trading signal. The donchian breakout period is entered as an input. [ Installation Guide | Update Guide | Troubleshooting | FAQ | A
FREE
Ortalama geri dönüş ticareti için profesyonel ve nicel bir yaklaşım uygulayan benzersiz gösterge. Fiyatın tahmin edilebilir ve ölçülebilir bir şekilde ortalamaya döndüğü ve yön değiştirdiği gerçeğinden yararlanır, bu da nicel olmayan ticaret stratejilerinden büyük ölçüde daha iyi performans gösteren net giriş ve çıkış kurallarına izin verir. [ Installation Guide | Update Guide | Troubleshooting | FAQ | All Products ] Ticaret sinyallerini temizle Ticaret yapmak inanılmaz derecede kolay Özelleşt
Pro Magic Signal   indicator is designed for signal trading. This indicator generates trend signals.  It uses many algorithms and indicators to generate this signal. It tries to generate a signal from the points with the highest trend potential. This indicator is a complete trading product. This indicator does not need any additional indicators.  The indicator certainly does not repaint. The point at which the signal is given does not change.  Thanks to the alert features you can get the signals
Scanner and Dashboard for Money Flow Index for MT4 The Money Flow Index (MFI) is a technical oscillator that uses price and volume data for identifying overbought or oversold signals in an asset. It can also be used to spot divergences which warn of a trend change in price. The oscillator moves between 0 and 100. Advantages of the Scanner: - Full Alert Options. - Multi Timefrare  - Works for all instruments including Currencies, Indices, Commodities, Cryptocurrencies and Stocks. - Fully customis
No idea why demo is not working. you can check the GIF to see how it works. Features With this scanner you can detect Candles which are below/above yesterday high/low lines. A pair's rectangle turns RED in dashboard if it is above the yesterday high, and rectangle turns GREEN in dashboard if it is below the yesterday low. It gives alerts in every 15m candle close. Contains a Dashboard which will help you to see all market pair's. It is possible to disable this sorting through to make it easier
Candle Dominance Index (CDI) is a sub-window histogram indicator for MetaTrader 4 that reveals the true conviction behind every candle — not just direction, but how hard bulls or bears dominated the full price range. Most traders look at candle color and size. CDI goes deeper. It measures the ratio of the candle body to the total wick range, giving you an instant read on whether the move was decisive or weak. A tall green bar means bulls closed near the high — genuine strength. A tall red bar me
MTF Kijun
Kristmundur Roman Zakharii
4 (1)
The indicator plots higher timeframe Kijun-sen (of Ichimoku ) on lower timeframes. To change timeframes, in the timeframe field enter the number: M1    PERIOD_M1 1 1 minute. M5    PERIOD_M5 5 5 minutes. M15  PERIOD_M15 15 15 minutes. M30  PERIOD_M30 30 30 minutes. H1    PERIOD_H1 60 1 hour. H4    PERIOD_H4 240 4 hour. D1    PERIOD_D1 1440 Daily. W1   PERIOD_W1 10080 Weekly. MN1  PERIOD_MN1 43200 Monthly. By default, the Kijun is shifted 3 periods forward but if you wish to have it exactly as
Alpha Trend sign has been a very popular trading tool in our company for a long time. It can verify our trading system and clearly indicate trading signals, and the signals will not drift. Main functions: Based on the market display of active areas, indicators can be used to intuitively determine whether the current market trend belongs to a trend market or a volatile market. And enter the market according to the indicator arrows, with green arrows indicating buy and red arrows indicating se
Bu ürünün alıcıları ayrıca şunları da satın alıyor
Neuro Poseidon MT4
Daria Rezueva
4.95 (38)
Neuro Poseidon is a new indicator by Daria Rezueva. It combines precise trading signals with adaptive TP/SL levels - creating best possible trades as a result! Message me and get  Neuro Poseidon Assistant  as a gift to automize your trading process! What makes it stand out? 1. Proven profitability on all assets and timeframes 2. Only confirmed BUY and SELL signals present on the chart 3. Adaptive TP & SL levels generated by the software for each trade 4. Easy to understand - suitable for all
Miraculous Göstergesi – Gann Dokuz Kareye Dayalı %100 Tekrarlamayan Forex ve İkili Araç Bu video, Forex ve İkili Opsiyon traderları için özel olarak geliştirilmiş son derece doğru ve güçlü bir ticaret aracı olan Miraculous Göstergesi 'ni tanıtıyor. Bu göstergeyi benzersiz kılan, efsanevi Gann Dokuz Karesi ve Gann Titreşim Yasası 'na dayanmasıdır; bu da onu modern ticarette mevcut en hassas tahmin araçlarından biri yapmaktadır. Miraculous Göstergesi tamamen tekrarlamaz ; yani mum kapandıktan son
Trend Catcher ind
Ramil Minniakhmetov
5 (5)
TREND YAKALAYICI GÖSTERGE Trend Yakalayıcı Gösterge, yazarın tescilli ve özelleştirilmiş uyarlanabilir trend analiz göstergelerinin bir kombinasyonunu kullanarak piyasa fiyat hareketlerini analiz eder. Kısa vadeli gürültüyü filtreleyerek ve temel momentum gücüne, volatilite genişlemesine ve fiyat yapısı davranışına odaklanarak gerçek piyasa yönünü belirler. Ayrıca, hareketli ortalamalar, RSI ve volatilite filtreleri gibi yumuşatma ve trend filtreleme özelleştirilmiş göstergelerinin bir kombina
Gann Made Easy
Oleg Rodin
4.84 (165)
Gann Made Easy , bay teorisini kullanarak ticaretin en iyi ilkelerine dayanan, profesyonel ve kullanımı kolay bir Forex ticaret sistemidir. WD Gann. Gösterge, Zararı Durdur ve Kâr Al Seviyeleri dahil olmak üzere doğru SATIN AL ve SAT sinyalleri sağlar. PUSH bildirimlerini kullanarak hareket halindeyken bile işlem yapabilirsiniz. Satın alma işleminden sonra, alım satım talimatlarını ve harika ek göstergeleri ücretsiz olarak almak için lütfen benimle iletişime geçin! Muhtemelen Gann ticaret yöntem
Prop Firm Sniper MT4  is a professional market structure indicator that automatically identifies high-probability BUY and SELL opportunities using BOS and CHoCH analysis. Recommended Timeframes: For backtesting, use the indicator on   M5 or M15   for Gold (XAUUSD), and   M15 or H1   for more volatile Forex pairs such as   GBPUSD, USDJPY, EURGBP , and similar markets. CONTACT ME AFTER PURCHASE TO CLAIM YOUR FREE BONUSES! Prop Firm Sniper  is a professional market structure indicator designed t
M1 Sniper
Oleg Rodin
5 (24)
M1 SNIPER kullanımı kolay bir işlem göstergesi sistemidir. M1 zaman dilimi için tasarlanmış bir ok göstergesidir. Gösterge, M1 zaman diliminde scalping için bağımsız bir sistem olarak kullanılabilir ve mevcut işlem sisteminizin bir parçası olarak kullanılabilir. Bu işlem sistemi özellikle M1'de işlem yapmak için tasarlanmış olsa da, diğer zaman dilimleriyle de kullanılabilir. Başlangıçta bu yöntemi XAUUSD ve BTCUSD ticareti için tasarladım. Ancak bu yöntemi diğer piyasalarda işlem yaparken de ya
Dynamic Forex28 Navigator
Bernhard Schweigert
4.43 (7)
Dynamic Forex28 Navigator - Yeni Nesil Forex Ticaret Aracı. ŞU ANDA %49 İNDİRİM. Dynamic Forex28 Navigator, uzun zamandır popüler olan göstergelerimizin evrimidir ve üçünün gücünü tek bir göstergede birleştirir: Gelişmiş Döviz Gücü28 Göstergesi (695 inceleme) + Gelişmiş Döviz İMPULS ve UYARI (520 inceleme) + CS28 Kombo Sinyalleri (Bonus). Gösterge hakkında ayrıntılar https://www.mql5.com/en/blogs/post/758844 Yeni Nesil Güç Göstergesi Ne Sunuyor?  Orijinallerde sevdiğiniz her şey, şimdi yeni
BTMM State Engine Pro is a MetaTrader 4 indicator for traders who use the Beat The Market Maker approach: Asian session context, kill zone timing, level progression, peak formation detection, and a multi-pair scanner from a single chart. It combines cycle state logic with a built-in scanner dashboard so you do not need the same tool on many charts at once. What it does Draws the Asian session range; session times can follow broker server offset or be set in inputs. Tracks level progression (L
Scalper Inside PRO
Alexey Minkov
4.68 (69)
Scalper Inside PRO Scalper Inside PRO is an intraday trend and scalping indicator that uses exclusive built-in algorithms to evaluate market direction and key target levels. The indicator automatically calculates entry and exit points and several profit target levels, and it shows detailed performance statistics, so you can see how different instruments and strategies behaved on historical data. This helps you select instruments that fit current market conditions. You can also connect your own a
MetaBands M4
Vahidreza Heidar Gholami
3.5 (6)
MetaBands uses powerful and unique algorithms to draw channels and detect trends so that it can provide traders with potential points for entering and exiting trades. It’s a channel indicator plus a powerful trend indicator. It includes different types of channels which can be merged to create new channels simply by using the input parameters. MetaBands uses all types of alerts to notify users about market events. Features Supports most of the channel algorithms Powerful trend detection algorith
Genesis Matrix Pro is a professional multi-timeframe trend detection indicator designed to help traders identify high-quality market alignment with clarity and structure. It combines 12 different technical indicators into one visual alignment matrix, allowing traders to quickly see when market conditions are bullish, bearish, or neutral. A signal is generated only when the selected strategies are aligned, helping reduce noise and improve decision-making. PLEASE CONTACT ME AFTER PURCHASE TO GET
Bu ürün 2026 piyasası için güncellendi ve en son MT5 sürümleri için optimize edildi. FİYAT GÜNCELLEME BİLDİRİMİ: Smart Trend Trading System şu anda $99 fiyatıyla sunulmaktadır. Sonraki 30 satın alma işleminden sonra fiyat $199 olacaktır. ÖZEL TEKLİF: Smart Trend Trading System satın aldıktan sonra bana özel mesaj gönderin, Smart Universal EA’yı ÜCRETSİZ olarak alın ve Smart Trend sinyallerinizi otomatik işlemlere dönüştürün. Smart Trend Trading System, daha temiz sinyaller, daha iyi trend yönü
Advanced Supply Demand
Bernhard Schweigert
4.91 (300)
Özel Ticaret –%30 İndirim Yeni Başlayanlar veya Uzman Yatırımcılar İçin En İyi Çözüm! Bu gösterge, bir dizi özel özellik ve yeni bir formül içerdiği için benzersiz, yüksek kaliteli ve uygun fiyatlı bir işlem aracıdır. Bu güncelleme ile çift zaman dilimi bölgeleri gösterebileceksiniz. Sadece daha yüksek bir zaman dilimini değil, hem grafik zaman dilimini hem de daha yüksek zaman dilimini gösterebileceksiniz: İÇ İÇE GEÇMİŞ BÖLGELER GÖSTERİYOR. Tüm Arz Talep yatırımcıları buna bayılacak. :) Önem
Gann Kare Göstergesi, W.D. Gann tarafından yazılan "Piyasa Tahminleri için Matematiksel Formül" makalesine dayalı güçlü bir piyasa analizi aracıdır. Bu araç, piyasa analizi için matematiksel ve Gann teorilerini kullanarak hassas analizler gerçekleştirir. 144, 90, 52 karelerini ve ayrıca 9 karesini kullanır. Ayrıca, 'ın 9 karesi ve bu kareyle ilişkili kanallar ve yıldız modelleri için yöntemini içerir. Kullanıcı Kılavuzu ve Uygulama: Bu göstergeleri kullanmadan önce, kullanıcı kılavuzunu okumanız
Neo Wave PRO
Nikolay Raykov
5 (1)
Price & Time Market Structure Indicator A professional market structure tool that analyzes waves through both price and time — not price alone. Main Description NeoWave PRO is a professional market structure indicator for MetaTrader 4 designed for traders who want to move beyond traditional one-dimensional wave tools such as ZigZag, swing indicators, and basic high/low systems. Most wave indicators analyze only one thing: Price. But a real market wave is not only a price movement. A true wave de
Enigma scalper fx
Yonny Pascal Ekwa Mezui
Enigma Scalper  Overview Enigma Scalper Pro is a multi-filter breakout indicator designed for traders who want clean entry signals with confirmation from several technical conditions instead of relying on a single trigger. The indicator combines: 3-Bar Breakout pattern detection Higher Timeframe confluence Bollinger Band extreme filtering RSI momentum analysis Optional EMA trend filtering ATR-based SL/TP projection Signals are generated only after candle close to ensure stable non-repainting beh
PRO Renko Sistemi, RENKO grafikleri ticareti için özel olarak tasarlanmış son derece hassas bir ticaret sistemidir. Bu, çeşitli ticaret araçlarına uygulanabilen evrensel bir sistemdir. Sistemi etkin piyasa sana doğru ters sinyallerine erişim hakkı denilen ses nötralize eder. Göstergenin kullanımı çok kolaydır ve sinyal üretiminden sorumlu tek bir parametreye sahiptir. Aracı, seçtiğiniz herhangi bir ticaret aracına ve renko çubuğunun boyutuna kolayca uyarlayabilirsiniz. Yazılımımla karlı bir
Scalper Vault
Oleg Rodin
5 (37)
Scalper Vault , başarılı bir scalping için ihtiyacınız olan her şeyi size sağlayan profesyonel bir scalping sistemidir. Bu gösterge, forex ve ikili opsiyon tüccarları tarafından kullanılabilecek eksiksiz bir ticaret sistemidir. Önerilen zaman çerçevesi M5'tir. Sistem size trend yönünde doğru ok sinyalleri sağlar. Ayrıca size üst ve alt sinyaller ve Gann piyasa seviyeleri sağlar. Göstergeler, PUSH bildirimleri dahil her türlü uyarıyı sağlar. Göstergeyi satın aldıktan sonra lütfen benimle iletişim
CRT Candle Range Theory HTF MT4.   Ultimate CRT Indicator: Advanced ICT Concepts and Malaysian SnR Trading System Discounted   Price   $50  !!     Secure your lifetime access   now   before it switches to   subscription-only ! Master the Market Maker's Footprints with the Most Advanced Candle Range Theory Indicator Unlock the true power of   Smart Money Concepts (SMC)   and trade precisely like the institutions with the   Ultimate CRT Indicator . Built exclusively for serious traders, this indic
Breakout Arrows Mt4
Michael Oko Oboh
5 (1)
Trend Breakout Arrows Indicator The Trend Breakout Arrows Indicator is a momentum-based signal tool designed to identify potential bullish and bearish breakout opportunities. It displays clear arrow signals directly on the price chart, helping traders quickly recognize possible trend changes and continuation setups. Up Arrow (Buy Signal) A magenta up arrow appears below a candle when bullish momentum begins to strengthen. This signal indicates that buying pressure may be overtaking selling press
Pinpoint , XAUUSD için doğru alım ve satım sinyalleri sağlamak amacıyla geliştirilmiş, yeniden çizim yapmayan ve gecikmesiz, yüksek verimli bir işlem göstergesidir. Gösterge, hızlı değişen bir piyasada gerçek zamanlı olarak hızlı, doğru ve görsel çözümler isteyen yatırımcılar için oluşturulmuştur. Gösterge, hazır bir ticaret stratejisi olarak çalışır. O, varlığın fiyatının davranışını belirlenen bir algoritmaya göre analiz eder ve ideal giriş noktalarını belirler, ayrıca kârın en iyi nerede sabi
The indicator scans for Dinapoli thrust pattern in multiple timeframes for the all markets filtered and shows the results on Dashboard. Key Features Dashboard can be used for all markets It can scan for thrust pattern on MN1, W1, D1, H4, H1, M30, M15 ,M5, M1 timeframes Ability to choose number of bars required above/below displaced moving average to define thrust Parameters UseMarketWatch: Set true to copy all symbols available in market watch MarketWatchCount : Set the number of symbols that
ŞU ANDA %40INDIRIMLI Yeni Başlayanlar veya Uzman Tüccarlar için En İyi Çözüm! Bu Gösterge benzersiz, yüksek kaliteli ve uygun fiyatlı bir ticaret aracıdır çünkü bir dizi tescilli özellik ve yeni bir formül ekledik. Sadece BİR grafik ile 28 Forex çifti için Döviz Gücünü okuyabilirsiniz! Yeni bir trendin veya scalping fırsatının tam tetik noktasını belirleyebildiğiniz için ticaretinizin nasıl gelişeceğini hayal edin? Kullanım kılavuzu: buraya tıklayın Bu ilk olan, orijinal! Değersiz bir özent
Reversion King MT4
Eugen-alexandru Zibileanu
Piyasaya Yeni Bir Kral Geldi – Gösterge + Emir Yönetimi (TP1 + TP2 + TP3) (TAM TİCARET SİSTEMİ) Bu gösterge; gelişmiş bir strateji, tamamen özelleştirilebilir emir yönetim sistemi ve Envelopes genişlemelerini kullanan bir Ortalama Dönüş (Mean Reversion) sistemi ile birlikte gelir. RSI gibi çoklu akıllı onay filtreleri sayesinde yüksek olasılıklı dönüş noktalarını tespit eder ve net BUY (Alış) ile SELL (Satış) sinyalleri üretir. Gösterge Repaint Yapmaz (No Repaint). Sadece işlem açmayı değil, ayn
Bu gösterge, pratik ticaret için mükemmel olan otomatik dalga analizine yönelik bir göstergedir! Dava... Not:   Dalga sınıflandırması için Batılı isimleri kullanmaya alışkın değilim. Tang Lun'un (Tang Zhong Shuo Zen) adlandırma kuralının etkisiyle, temel dalgayı   kalem   , ikincil dalga bandını ise   segment   olarak adlandırdım. aynı zamanda segmentin trend yönü vardır. Adlandırma   esas olarak trend segmentidir   (bu adlandırma yöntemi gelecekteki notlarda kullanılacaktır, öncelikle söyleyey
Introduction Harmonic Patterns are best used to predict potential turning point. Traditionally, Harmonic Pattern was identified manually connecting peaks and troughs points in the chart. Manual harmonic pattern detection is painfully tedious and not suitable for everyone. You are often exposed under subjective pattern identification with manual pattern detection. To avoid these limitations, Harmonic Pattern Plus was designed to automate your harmonic pattern detection process. The functionality
KT Alpha Hunter Arrows MT4
KEENBASE SOFTWARE SOLUTIONS
Çoğu ok göstergesi size yalnızca bir sinyal verir ve geri kalan her şeyi sizin çözmenizi bekler. KT Alpha Hunter Arrows ise size eksiksiz bir işlem planı sunar. Her sinyal oku, grafikte hazır bir planla birlikte görünür: giriş çizgisi, stop loss, dört take profit seviyesi ve bu sembol ile zaman diliminin o anda işlem yapmaya değer olup olmadığını gösteren canlı edge kararı. Pakete dahil olan Trade Manager EA, siz işleme girdikten sonra yönetimi üstlenir. Böylece piyasa hareketli ve duygusal açıd
Break Axis Signal
Leandro Bernardez Camero
BreakAxis — Dönüş Noktasında Hassas Sinyaller Yeni güncellemeleri kaçırmamak için kanala katılın: https://www.mql5.com/en/channels/forexnewadvisor Eksen Kesişimine Dayalı Sinyal Mantığı BreakAxis Signal, sıfır ekseni kesişimlerine dayalı olarak fiyat yönündeki değişimleri algılamak üzere tasarlanmıştır. Histogram geçişleri, potansiyel piyasa momentumu değişimlerini vurgulamak için kullanılır ve yön okları ile görsel onay sağlanır. Sinyal Onayı ve Kararlılığı Her sinyal, belirli matematikse
PZ ABCD Retracement
PZ TRADING SLU
4 (5)
Identify precise entry and exit points with AB=CD patterns This indicator finds AB=CD retracement patterns. The AB=CD Retracement pattern is a 4-point price structure where the initial price segment is partially retraced and followed by an equidistant move from the completion of the pullback, and is the basic foundation for all harmonic patterns. [ Installation Guide | Update Guide | Troubleshooting | FAQ | All Products   ] Customizable pattern sizes Customizable AC and BD ratios Customizable b
Trend Lines PRO
Roman Podpora
5 (1)
TREND ÇİZGİLERİ PRO     Piyasanın gerçek yön değişimini anlamaya yardımcı olur. Gösterge, gerçek trend dönüşlerini ve büyük oyuncuların piyasaya yeniden girdiği noktaları gösterir. Anlıyorsun     BOS hatları  Daha yüksek zaman dilimlerindeki trend değişiklikleri ve önemli seviyeler, karmaşık ayarlar veya gereksiz gürültü olmadan gösterilir. Sinyaller yeniden çizilmez ve çubuk kapandıktan sonra grafikte kalır. VERSION MT 5     -    RFI LEVELS PRO  göstergesiyle birlikte kullanıldığında maksimum p
Yazarın diğer ürünleri
This script allows selecting the TakeProfit and StopLoss levels. It analyzes the history data, and then calculates the probability of reaching a given price level. How the script works Suppose you have a trading strategy and you want to select the TakeProfit and StopLoss levels. Run the script and set the parameter: Number of Bars - the average position holding time in bars. Once the script operation is complete, the AIS-PPL.csv file will be created in the Files folder in the terminal data cata
FREE
The script is based on the simulation of trade transactions using a random number generator. This allows you to get completely different results, even with the same input parameters. When you run the script, a dialog box opens in which you can set the desired values ​​for external variables. In the  Trading options  block, the basic parameters that are necessary for trading modeling are defined. Start Balance  - sets the initial size of the trade balance. Number Trade  - sets the number of trad
FREE
This script is designed so that the trader can determine the average duration of trade transactions, at which the ratio of possible profits and losses will be optimal. First, let's look at the general approach to determining the optimal duration of trade transactions. We introduce the following variables: R   - the result of the transaction; T   - the time during which the transaction was open; W  - the time between the closing of the previous transaction and the opening of the next one. Every t
FREE
Choosing the levels of StopLoss and TakeProfit can have a very strong impact on the overall performance of trading. In addition to the obvious parameters of a trade transaction - the size of a possible win or probable loss - the levels of StopLoss and TakeProfit also affect the expected duration of the transaction, and the profitability of trading in general. If you have already determined the optimal transaction duration using the “ AIS-ODT ” script, then you can begin to determine the paramete
FREE
The script analyzes the history of quotes and gives recommendations on the minimum deposit. The calculations take into account the variability of prices and the standard deviation. Margin requirements for the instrument are also taken into account. The result of the script is the minimum recommended deposit for trading the given currency pair.
FREE
The script allows selecting the required 'Filter level' value of the AIS-MTF MT5 indicator. Run the script on the required chart and selected timeframe. Once its operation is complete, the HPS.csv file will be created in the Files folder. Open the file. You will see three columns. The 'Filter lvl' column represents the value of the 'Filter level' for the AIS-MTF indicator. Am. dev. - degree and direction of the indicator's deviation from the price level (sorted in ascending order). Negative valu
FREE
This script allows selecting the TakeProfit and StopLoss levels. It analyzes the history data, and then calculates the probability of reaching a given price level. How the script works Suppose you have a trading strategy and you want to select the TakeProfit and StopLoss levels. Run the script and set the parameter: Number of Bars - the average position holding time in bars. Once the script operation is complete, the AIS-PPL.csv file will be created in the Files folder in the terminal data cata
FREE
AIS Doğru Ortalamalar göstergesi, piyasadaki bir trend hareketinin başlangıcını belirlemenizi sağlar. Göstergenin bir diğer önemli kalitesi, trendin sonunun açık bir işaretidir. Gösterge yeniden çizilmez veya yeniden hesaplanmaz. Görüntülenen Değerler h_AE - AE kanalının üst sınırı l_AE - AE kanalının alt sınırı h_EC - Mevcut çubuk için yüksek tahmin edilen değer l_EC - Mevcut çubuk için düşük tahmin edilen değer Gösterge ile çalışırken sinyaller Ana sinyal, AE ve EC kanallarının kesişimid
AIS Ağırlıklı Hareketli Ortalama göstergesi, ağırlıklı bir hareketli ortalama hesaplar ve trend olan bir piyasa hareketinin başlangıcını belirlemenize olanak tanır. Ağırlık katsayıları, her bir çubuğun belirli özellikleri dikkate alınarak hesaplanır. Bu, rastgele piyasa hareketlerini filtrelemenize olanak tanır. Bir trendin başladığını teyit eden ana sinyal, gösterge çizgilerinin yönündeki bir değişiklik ve gösterge çizgilerini geçen fiyattır. WH (mavi çizgi), Yüksek fiyatların ağırlıklı ort
AIS Advanced Grade Fizibilite göstergesi, fiyatın gelecekte ulaşabileceği seviyeleri tahmin etmek için tasarlanmıştır. Görevi, son üç çubuğu analiz etmek ve buna dayalı bir tahmin oluşturmaktır. Gösterge herhangi bir zaman diliminde ve herhangi bir döviz çiftinde kullanılabilir. Ayarların yardımıyla, tahminin istenen kalitesini elde edebilirsiniz. Tahmin derinliği - istenen tahmin derinliğini çubuklar halinde ayarlar. Bu parametrenin 18-31 aralığında seçilmesi önerilir. Bu sınırların ötesine g
The indicator is designed to measure the price volatility. This allows determining the moments for opening or closing trade positions more accurately. High intensity of the market indicates the instability of its movement, but allows for better results. And, conversely, low intensity of the market indicates the stability of its movement. Parameters Bars to process - the number of bars to measure the price movements. A low value of this parameter allows determining the moments of rapid price mov
This indicator uses the Fibonacci p-numbers to smooth a price series. This allows combining the advantages of the simple and exponential moving averages. The smoothing coefficients depend on the level of the p-number, which is set in the indicator parameters. The higher the level, the greater the influence of the simple moving average and the less significant the exponential moving average. Parameters Fibonacci Numbers Order - order of the Fibonacci p-number, specified by trader. Valid values a
MinDeposit
Aleksej Poljakov
5 (1)
The script analyzes the history of quotes and gives recommendations on the minimum deposit. The calculations take into account the variability of prices and the standard deviation. Margin requirements for the instrument are also taken into account. The result of the script is the minimum recommended deposit for trading the given currency pair.
FREE
The indicator is based on the analysis of interaction of two filters. The first filter is the popular Moving Average. It helps to identify linear price movements and to smooth minor price fluctuations. The second filter is the Sliding Median. It is a non-linear filter. It allows to filter out noise and single spikes in the price movement. A predictive filter implemented in this indicator is based on the difference between these filters. The indicator is trained during operation and is therefore
This indicator studies the price action as a combination of micro-trends. All micro-trends are analyzed and averaged. Price movement is filtered based on this averaging. IP_High and IP_Low (blue and red dashed lines) show the instantaneous price movement. They display the forecast only for the current price values, taking into account only the number of bars defined by the 'Filter level' parameter. SP_High and SP_Low (blue and red solid lines) smooth the price movements with respect to history.
The script allows selecting the required 'Filter level' value of the AIS-MTF indicator. Run the script on the required chart and selected timeframe. Once its operation is complete, the HPS.csv file will be created in the Files folder. Open the file. You will see three columns. The 'Filter lvl' column represents the value of the 'Filter level' for the AIS-MTF indicator. Am. dev. - degree and direction of the indicator's deviation from the price level (sorted in ascending order). Negative values i
FREE
Bu gösterge, basit bir doğrusal yumuşatma işlemi uygular. Üstel yumuşatmanın dezavantajlarından biri, sinyalin hızlı bozulmasıdır. Bu, fiyat aralığındaki uzun vadeli eğilimleri tam olarak takip etmeyi imkansız hale getirir. Doğrusal yumuşatma, sinyal filtrelemeyi daha doğru ve ince bir şekilde ayarlamanıza olanak tanır. Gösterge, parametreler seçilerek yapılandırılır: LP - bu parametre, yumuşatma süresini seçmenize olanak tanır. Değeri ne kadar büyük olursa, gösterge o kadar uzun vadeli eğil
Этот индикатор представляет гибридный фильтр основанный на совместном использовании медианы и скользящей средней. Использование медианы позволяет отфильтровывать аномальные выбросы и случайные импульсы в значениях ценового ряда. При этом на трендовую составляющую медианный фильтр не действует, оставляя ее без изменений. Так как медианный фильтр является нелинейным, то для сглаживания его значений используется скользящая средняя. Такой подход позволяет более точно выделять не только тренд, но и п
This indicator is a combination of two modified Lanczos filters. The first filter serves to extrapolate the price. Based on past values, he predicts a possible price movement within the current bar. That is, it shows what the price would be if the past trends remained unchanged. The second filter for smoothing and averaging prices within the window, determined by the level of the filter. Thanks to the selection of weights, this filter is most actively responding to the periodic component that is
The script is based on the simulation of trade transactions using a random number generator. This allows you to get completely different results, even with the same input parameters. When you run the script, a dialog box opens in which you can set the desired values ​​for external variables. In the Trading options block, the basic parameters that are necessary for trading modeling are defined. Start Balance - sets the initial size of the trade balance. Number Trade - sets the number of trade tr
FREE
This script is designed so that the trader can determine the average duration of trade transactions, at which the ratio of possible profits and losses will be optimal. First, let's look at the general approach to determining the optimal duration of trade transactions. We introduce the following variables: R   - the result of the transaction; T   - the time during which the transaction was open; W - the time between the closing of the previous transaction and the opening of the next one. Every tr
FREE
Let's look at the nature of price changes in the Forex market, not paying attention to the reasons why these changes occur. This approach will allow us to identify the main factors affecting the price movement. For example, let's take the opening prices of bars on the EUR-USD currency pair and the H1 timeframe. For these prices, we construct the Lameray diagram (Figure 1). In this diagram, it can be seen that the price movement basically occurs according to a linear equation. To determine the pa
This indicator is more informative. His work is based on the assumption that the price movement in the market can be represented as noise of a particular color, which depends on the parameters of the distribution of price values. Thanks to this, it is possible to analyze the price change from different angles, and considering the price movement as noise of a particular color, one can get information about the current state of affairs in the market and make a forecast about the price behavior. W
Despite some drawbacks of the “ AIS Color Noise Filter ” indicator, the idea to use it to smooth the price series and forecast prices looks quite attractive. This is due to several reasons: first, taking into account several noise components allows building a forecast on factors independent of each other, which can improve the quality of forecasting; secondly, the noise characteristics of the price series behave quite stably throughout the entire history, which makes it possible to obtain stabl
Very often, in the study of financial series apply their smoothing. Using smoothing, you can remove high-frequency components - it is believed that they are caused by random factors and therefore irrelevant. Smoothing always includes some way of averaging the data, in which random changes in the time series mutually absorb each other. Most often, for this purpose, simple or weighted moving average methods are used, as well as exponential smoothing. Each of these methods has its advantages and d
One of the powerful methods of analysis is the modeling of financial series using Levy processes. The main advantage of these processes is that they can be used to model a huge number of phenomena - from the simplest to the most complex. Suffice it to say that the idea of ​​the fractal price movement in the market is only a special case of Levy processes. On the other hand, with proper selection of parameters, any Levy process can be represented as a simple moving average. Figure 1 shows an exa
Very often, the trader is faced with the task of determining the extent to which the price may change in the near future. For this purpose, you can use the Johnson distribution type SB. The main advantage of this distribution is that it can be used even with a small amount of accumulated data. The empirical approach used in determining the parameters of this distribution, allows you to accurately determine the maximum and minimum levels of the price channel. These values ​​can be used in differ
This indicator allows you to determine the likelihood that the price will reach one or another level. Its algorithm is quite simple and is based on the use of statistical data on the price levels of a particular currency pair. Thanks to the collected historical data, it is possible to determine the extent to which the price will change during the current bar. Despite its simplicity, this indicator can provide invaluable assistance in trading. So, with its help it is possible to determine TakePr
Stable distributions can be used to smooth financial series. Since a fairly deep history can be used to calculate the distribution parameters, such smoothing may in some cases be even more effective than other methods. The figure shows an example of the distribution of the opening prices of the currency pair " EUR-USD " on the time frame H1 for ten years (figure 1). Looks fascinating, doesn't it? The main idea behind this indicator is to determine the parameters of a stable distribution based
Filtrele:
alfy87
1140
alfy87 2023.01.12 21:49 
 

Kullanıcı değerlendirmeye herhangi bir yorum bırakmadı

sunnychow
9043
sunnychow 2019.07.10 15:02 
 

Kullanıcı değerlendirmeye herhangi bir yorum bırakmadı

Değerlendirmeye yanıt