AIS Fibonacci P Numbers

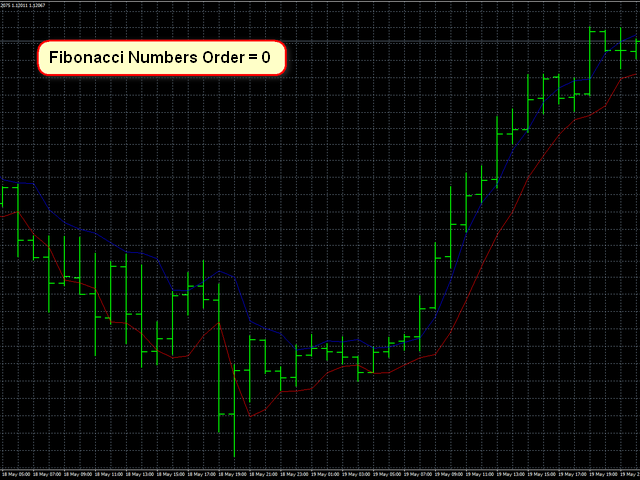
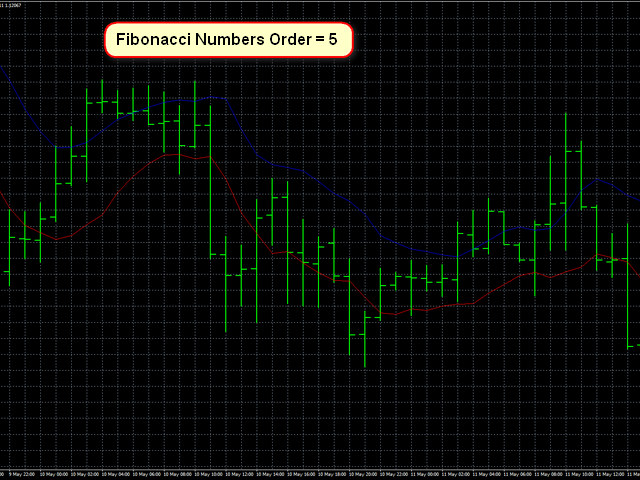
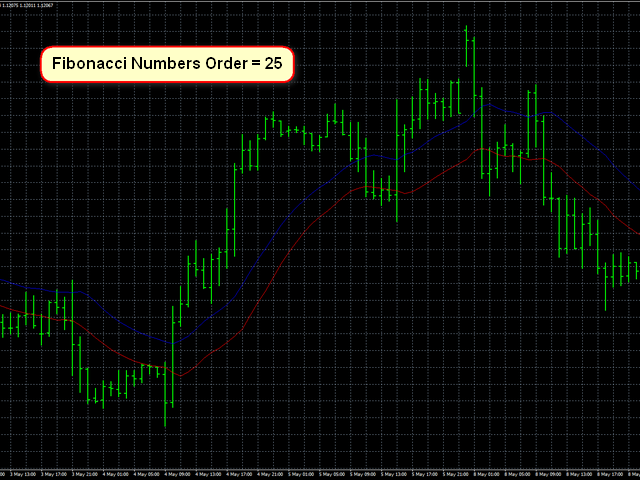
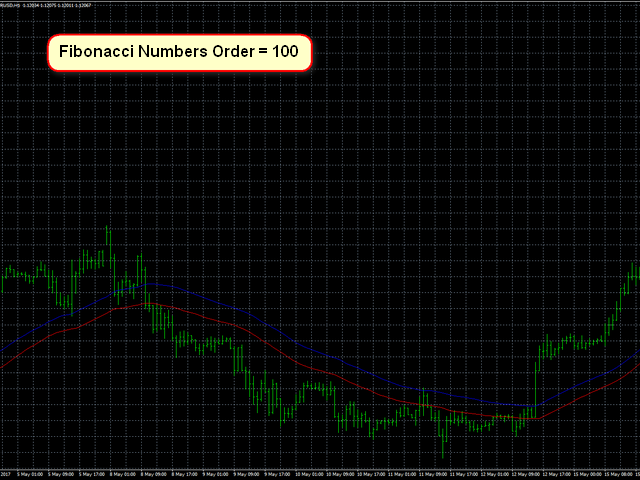
This indicator uses the Fibonacci p-numbers to smooth a price series. This allows combining the advantages of the simple and exponential moving averages.

The smoothing coefficients depend on the level of the p-number, which is set in the indicator parameters. The higher the level, the greater the influence of the simple moving average and the less significant the exponential moving average.


Parameters

  • Fibonacci Numbers Order - order of the Fibonacci p-number, specified by trader. Valid values are in the range of 0 - 255.

After the indicator is launched, the "Fibonacci p-number level" and the length of the series used to calculate the indicator values ("Length of a number series") are displayed in the Experts tab. The length of the calculated series depends on the number of decimal places in the quotes of the currencies. For 5-digit quotes, the accuracy of calculations is higher, so the length of the series will be greater.

Önerilen ürünler
This indicator works on MT4 and is very easy to use. When you receive a signal from it, you wait for that candle with the signal to close and you enter your trade at the beginning of the next new candle . A red arrow means sell and a green arrow means buy. All arrows comes with Alert  like for easy identification of trade signal. Are you okay with that? 1 minute candle 1 minute expire
Range Filtered AlgoAlpha, piyasa oynaklığını analiz ederek potansiyel işlem fırsatlarını belirlemek için tasarlanmış bir teknik analiz aracıdır. AlgoAlpha'nın orijinal TradingView göstergesinin MetaTrader uyarlaması olan bu araç, görsel piyasa değerlendirmeleri sağlamak için çeşitli analitik yöntemleri birleştirir. Teknik Özellikler Fiyat düzleştirme için Kalman Filtreleme (Kalman Filtering) kullanır Oynaklık ölçümü için ATR tabanlı bantlar (ATR-based Bands) içerir Trend analizi için Süpertrend
The trader uses the Trend for Neuro indicator to determine the market situation. This is a trending algorithm that is convenient to download, install and use. The algorithm with acceptable accuracy generates input signals and output levels. Strategy for trend trading, filtering and all the necessary functions built into one tool! By launching the indicator, the user will see only two types of arrows that can change color to blue during an uptrend, to red during a downtrend there is no uncertaint
The Best Choice compra y venta
Sandro Israel Hernandez Zamora
¿Has escuchado decir que la tendencia es tu amiga? pues nada es mas cierto en el mundo del trading. Este indicador analiza las tendencias y su fuerza para que puedas aprovecharlas y utilizamos un conjunto de indicadores como RSI, %W, MACD y EMAS para analizar el mercado y sus movimientos, por lo que podrás mantener tu gráfico limpio sabiendo que todos estos indicadores los tienes en uno solo. Este, como cualquier indicador, no representa una certeza de compra o venta definitiva, por lo siempre r
Bu gösterge, pratik ticaret için mükemmel olan otomatik dalga analizine yönelik bir göstergedir! Dava... Not:   Dalga sınıflandırması için Batılı isimleri kullanmaya alışkın değilim. Tang Lun'un (Tang Zhong Shuo Zen) adlandırma kuralının etkisiyle, temel dalgayı   kalem   , ikincil dalga bandını ise   segment   olarak adlandırdım. aynı zamanda segmentin trend yönü vardır. Adlandırma   esas olarak trend segmentidir   (bu adlandırma yöntemi gelecekteki notlarda kullanılacaktır, öncelikle söyleyey
Global Trend
Vitalii Zakharuk
Global Trend Indicator, shows the signals for entry. Displays both entry points and the trend itself. Shows statistically calculated moments for entering the market with arrows. When using the indicator, the risk factor can be optimally distributed. Settings: Uses all one parameter for settings. Choosing a parameter, it is necessary to visually resemble it so that the appropriate graph has a projection of extremes. Parameters: Length - the number of bars for calculating the indicator. Use
No idea why demo is not working. you can check the GIF to see how it works. Features With this scanner you can detect Candles which are below/above yesterday high/low lines. A pair's rectangle turns RED in dashboard if it is above the yesterday high, and rectangle turns GREEN in dashboard if it is below the yesterday low. It gives alerts in every 15m candle close. Contains a Dashboard which will help you to see all market pair's. It is possible to disable this sorting through to make it easier
The indicator is the advanced form of the MetaTrader 4 standard Fibonacci tool. It is unique and very reasonable for serious Fibonacci traders. Key Features Drawing of Fibonacci retracement and expansion levels in a few seconds by using hotkeys. Auto adjusting of retracement levels once the market makes new highs/lows. Ability to edit/remove any retracement & expansion levels on chart. Auto snap to exact high and low of bars while plotting on chart. Getting very clear charts even though many ret
Trend Chase is an indicator that generates trade arrows. It generates trade arrows with its own algorithm. These arrows give buying and selling signals. The indicator certainly does not repaint. The point at which the signal is given does not change. You can use it in all graphics. You can use it in all pairs. This indicator shows the input and output signals as arrows and alert. When sl_tp is set to true, the indicator will send you the close long and close short warnings. It tells you that you
Indicator for binary options arrow is easy to use and does not require configuration works on all currency pairs, cryptocurrencies buy signal blue up arrow sell signal red down arrow tips do not trade during news and 15-30 minutes before their release, as the market is too volatile and there is a lot of noise it is worth entering trades one or two candles from the current period (recommended for 1 candle) timeframe up to m 15 recommended money management fixed lot or fixed percentage of the depo
Ortalama geri dönüş ticareti için profesyonel ve nicel bir yaklaşım uygulayan benzersiz gösterge. Fiyatın tahmin edilebilir ve ölçülebilir bir şekilde ortalamaya döndüğü ve yön değiştirdiği gerçeğinden yararlanır, bu da nicel olmayan ticaret stratejilerinden büyük ölçüde daha iyi performans gösteren net giriş ve çıkış kurallarına izin verir. [ Installation Guide | Update Guide | Troubleshooting | FAQ | All Products ] Ticaret sinyallerini temizle Ticaret yapmak inanılmaz derecede kolay Özelleşt
Binary Options Support Resistance Indicator This indicator is designed for binary options trading and effectively shows retracements from support and resistance levels. Signals appear on the current candle. A red arrow pointing downwards indicates a potential selling opportunity, while a blue arrow pointing upwards suggests buying opportunities. All that needs adjustment is the color of the signal arrows. It is recommended to use it on the M1-M5 timeframes as signals are frequent on these timef
Some informations on the chart with the single attachment. RangeBorder Buy Sell (RBBS) Non Repaint Indicator will provide trend line, buy sell arrows,reversal arrows, range channel, order exit area,high average price line and low average price line.All arrows and lines don't repaint and not lagging. Once candle closed it won't  repaint. Reading Indicator: 1. Small Stars , Indicates oversold and overbought with certain logic and price may reverse when this small star triggers. Useful to identify
Premium Smart Money Concepts (SMC) Indicator – BOS | CHoCH | FVG | OB | Liquidity Zones - Break of Structure (BOS) and Change of Character (CHoCH)   - Fair Value Gaps (FVG) with auto zones   - Order Blocks (OB) detection   - Liquidity zones and inducement markers   - Alerts for key SMC signals   - Clean chart visuals – customizable and beginner-friendly   - Works on any pair, any timeframe - Trusted SMC logic built for MetaTrader 4   - Real-time signals, no lag or repainting   - Improves decis
First time on MetaTrader, introducing IQ Star Lines - an original Vedic Astrology based indicator. "Millionaires don't use astrology, billionaires do" . - J.P. Morgan, Legendary American financier and banker. IQ Star Lines, an unique astrological indicator purely based on   Vedic astrology   calculations, published for the   first time on Metatrader.  This unique tool plots dynamic planetary grid lines based on real-time stars, constellations, and celestial movements, which allows you to plot t
The Channel Trade System indicator is an indicator designed to trade with channels. Only by this indicator can be done beautifully by itself. This indicator is composed of moving average and some algorithms. Features and Suggestions The display has 4 channels. There is one main trend line. The signal line is the thick channel with magenta color. To trade, it is advisable to start with the channel line which is magenta color. A channel calculation setting of 3 to 5 is recommended. the different
-   Real price is 90$   - 50% Discount ( It is 45$ now ) Contact me for instruction, any questions! Introduction V Bottoms and Tops (or Fibonacci Retracement) are popular   chart patterns   among traders due to their potential for identifying trend reversals. These patterns are characterized by sharp and sudden price movements, creating a V-shaped or inverted V-shaped formation on the   chart . By recognizing these patterns, traders can anticipate potential shifts in market direction and posi
Sinus wave
Guner Koca
5 (1)
Sinus wave  indicator is a extra ordinary oscillator.to find divergency. it works all pairs and all timeframes. suitable for experienced and beginner traders.. indicator works on toward of the prices... while sinus wave go up side that means prices will up. and while sinus wave go down that means prices is going down. it gives divegency when trend reversals. It also gives sell divergency on bear markets there is wave to set default 500. It can be increase depends to charts bars numbers on pictur
JapaneseBreakout
Ahmet Metin Yilmaz
Instructions Attach the indicator to any chart (advised H4) Use input tabs (defaults are 5 and false ) Press ok and continue trading. Description The indicator uses a kind of pattern breakout strategy to help your trading strategy. I am using this strategy on H4 charts for many of pairs with a trailing stop and default indicator settings. Better results are shown on USDJPY, EURJPY, CADJPY, EURGBP, EURUSD, USDCAD, USDCHF, NZDUSD and GBPUSD. Trailing stops should be different for each pair. The b
Quantum Entry is a powerful price action trading system built on one of the most popular and widely known strategies among traders: the Breakout Strategy! This indicator produces crystal clear buy and sell signals based on breakouts of key support and resistance zones. Unlike typical breakout indicators, it uses advanced calculations to accurately confirm the breakout! When a breakout occurs, you receive instant alerts. No lag and no repaint :  All signals are delivered in real-time, with no lag
Over Trend MT4
Mansour Babasafary
Trend based indicator Identify trends with this indicator A simple-to-use trend indicator No complicated settings Attributes: Can be used in all symbols Can be used in all time frames Relatively high signals No complicated settings Specific to the trend Lifetime support Settings: Alarm Show Alert: By activating these settings, after receiving the signal, you will receive an alarm in Metatrader Alarm Show Notification: By activating these settings, after receiving the signal, you will receive a
Scanner and Dashboard for Money Flow Index for MT4 The Money Flow Index (MFI) is a technical oscillator that uses price and volume data for identifying overbought or oversold signals in an asset. It can also be used to spot divergences which warn of a trend change in price. The oscillator moves between 0 and 100. Advantages of the Scanner: - Full Alert Options. - Multi Timefrare  - Works for all instruments including Currencies, Indices, Commodities, Cryptocurrencies and Stocks. - Fully customis
You don't know what to trade? This is the one for you. Currency Strength (ROC Base) is the easiest way to identify strong and weak currencies. This indicator is a custom-made indicator you can use to determine the currency pairs that are currently trading strongly and the ones that are trading weakly. This indicator shows the relative strength of 8 major currencies such as AUD, CAD, CHF, EUR, GBP, JPY, NZD, USD. I used a method call " Rate Of Change (ROC) " for calculate all currency in percent
"Dinamik Scalping Osilatörü" - gelişmiş, özel bir Kripto-Forex göstergesi - MT4 için verimli bir işlem aracı! - Yeni nesil Osilatörler - nasıl kullanılacağını görmek için resimlere bakın. - Dinamik Scalping Osilatörü, uyarlanabilir Aşırı Satış/Aşırı Alım bölgelerine sahiptir. - Osilatör, dinamik Aşırı Satış/Aşırı Alım bölgelerinden kesin giriş noktalarını bulmak için yardımcı bir araçtır. - Aşırı Satış değerleri: Yeşil çizginin altında, Aşırı Alım değerleri: Turuncu çizginin üzerinde. - Bu gös
Stronger Trend is an indicator that generates trend signal. It generates trend signal with its own algorithm. These arrows give buying and selling signals. The indicator certainly does not repaint. Can be used in all pairs. Sends a signal to the user with the alert feature. Trade rules Enter the signal when the buy and sell signal arrives. Processing should only be initiated when signal warnings are received. It is absolutely necessary to close the operation when an opposite signal is received.
Standart Sapma Kanalının çoklu para birimi ve çoklu zaman çerçevesi göstergesi. Piyasanın mevcut yönünü görüntüler. Panelde, doğrusal regresyon kanalının seviyelerindeki kırılmaları ve dokunuşları (fiyata göre) görebilirsiniz. Parametrelerde istediğiniz para birimini ve zaman dilimini belirtebilirsiniz. Ayrıca gösterge, seviyelere dokunulduğunda bildirim gönderebilir. Bir hücreye tıkladığınızda bu simge ve nokta açılacaktır. Bu MTF Tarayıcıdır. Kontrol panelini grafikten gizlemenin anahtarı va
FiboZag
Andriy Sydoruk
Indicator FiboZag - transfer the indicator to the chart and the Fibonacci levels will be built automatically on the last ZigZag turn. The main advantage lies in the correct construction of Fibonacci levels and markup of price levels. Simple, visual and effective use. The indicator is not redrawn and does not lag. Works on all currency pairs and on all timeframes.
Smart Liquidity Levels
Suvashish Halder
3.5 (2)
Smart Liquidity Levels is a valuable tool for identifying optimal liquidity levels, enabling retail traders like us to strategically set our stop-loss orders. T he essential tool for traders seeking to maximize their trading success.  The liquidity level is a critical component of inner circle trading (ICT). It assists us in determining when and how we should enter the market. Watch the video for detailed instructions. Here's why understanding liquidity levels is crucial in trading and how our
Super MA Trend indicator is an indicator designed to find trends. It uses a moving average, a set of candle combinations and High/Low levels to find trends. This indicator is a complete trading system. You can trade with this indicator as you like. Features and Recommendations You can use this indicator on all pairs except for the volatile pairs. It is recommended to use it on M15 and over graphics. The most important element in this indicator are alerts. Do not open orders unless you receive a
PTW NON REPAINT TRADING SYSTEM + HISTOGRAM Non-Repainting ,   Non-Redrawing   and   Non-Lagging  Trading System. Does the following: - Gives Accurate Entry and Exit Points - Scalping, Day and Swing Trading  - 95% Accuracy  - Targets, where to take profits. - Shows Trends, Support and resistance levels - Works on All Brokers - Works on All Currencies, CFDs and Stocks - It does not place trades for you, it only shows you what trades to place. - It works on All Timeframes - It is for Trend or ran
Bu ürünün alıcıları ayrıca şunları da satın alıyor
Gann Made Easy
Oleg Rodin
4.83 (153)
Gann Made Easy , bay teorisini kullanarak ticaretin en iyi ilkelerine dayanan, profesyonel ve kullanımı kolay bir Forex ticaret sistemidir. WD Gann. Gösterge, Zararı Durdur ve Kâr Al Seviyeleri dahil olmak üzere doğru SATIN AL ve SAT sinyalleri sağlar. PUSH bildirimlerini kullanarak hareket halindeyken bile işlem yapabilirsiniz. LÜTFEN ÜCRETSİZ OLARAK TİCARET İPUÇLARI, BONUSLAR VE GANN MADE EA ASİSTANI ALMAK İÇİN SATIN ALIMDAN SONRA BENİMLE İLETİŞİME GEÇİN! Muhtemelen Gann ticaret yöntemlerini b
Pulse Scalping Line - an indicator for identifying potential pivot points. Based on this indicator, you can build an effective Martingale system. According to our statistics, the indicator gives a maximum of 4 erroneous pivot points in a series. On average, these are 2 pivot points. That is, the indicator shows a reversal, it is erroneous. This means that the second signal of the indicator will be highly accurate. Based on this information, you can build a trading system based on the Martingale
Gold Signal Pro
Mohamed Hassan
5 (1)
First 25 copies at $80, after that price becomes $149 (3 copies left) Gold Signal Pro is a powerful MT4 indicator designed to help traders spot strong price reactions in the market. It focuses on clear wick rejections , showing when price strongly rejects a level and often continues in the same direction. Gold Signal Pro is mainly built for scalping gold (XAUUSD) and works best on lower timeframes like M5 and M15 , where timing matters most. That said, it can also be used on any forex pair, a
Smc Blast Signal
Mohit Dhariwal
5 (3)
NEW YEAR 2026 SALE OFFER PRICE AT JUST 75 DOLLARS FEW COPIES ONLY AT This price From 28th Jan -31th Jan MIDNIGHT Final offer GRAB YOUR COPY ON THIS New Year EVE last offer GRAB IT! Prices will be increased to 150 after the offer period ends Full Fledged EA and Alert plus for alerts will also be provided in this offer along with the purchase of Indicator. Limited copies only at this price and Ea too. Grab your copy soon Alert plus for indicator with set file is kept in comment section with the im
Trend indicator AI
Ramil Minniakhmetov
4.9 (77)
Trend Ai göstergesi, trend tanımlamasını işlem yapılabilir giriş noktaları ve geri dönüş uyarılarıyla birleştirerek bir yatırımcının piyasa analizini geliştirecek harika bir araçtır. Bu gösterge, kullanıcıların forex piyasasının karmaşıklıklarında güvenle ve hassasiyetle yol almalarını sağlar. Birincil sinyallerin ötesinde, Trend Ai göstergesi geri çekilmeler veya düzeltmeler sırasında ortaya çıkan ikincil giriş noktalarını belirleyerek, yatırımcıların belirlenen trend içindeki fiyat düzeltmele
Apollo SR Master , Destek/Direnç bölgelerinde alım satımı daha kolay ve güvenilir hale getiren özelliklere sahip bir Destek/Direnç göstergesidir. Gösterge, yerel fiyat zirvelerini ve diplerini tespit ederek Destek/Direnç bölgelerini herhangi bir gecikme olmadan gerçek zamanlı olarak hesaplar. Ardından, yeni oluşan Destek/Direnç bölgesini doğrulamak için, Destek/Direnç bölgesinin dikkate alınabileceğini ve gerçek bir SAT veya AL sinyali olarak kullanılabileceğini gösteren özel bir sinyal gösterir
Şu anda %20 İNDİRİMLİ! Herhangi bir Acemi veya Uzman Tüccar için En İyi Çözüm! Bu gösterge paneli yazılımı 28 döviz çifti üzerinde çalışıyor. Ana göstergelerimizden 2'sine (Gelişmiş Para Birimi Gücü 28 ve Gelişmiş Para Birimi Dürtüsü) dayanmaktadır. Tüm Forex piyasasına harika bir genel bakış sağlar. Gelişmiş Para Birimi Gücü değerlerini, para birimi hareket hızını ve tüm (9) zaman dilimlerinde 28 Forex çifti için sinyalleri gösterir. Trendleri ve / veya scalping fırsatlarını belirlemek için
Atomic Analyst
Issam Kassas
5 (3)
Öncelikle belirtmek gerekir ki bu Ticaret Göstergesi Yeniden Çizim Yapmaz, Gecikmez ve Gecikme Göstermez, bu da hem manuel hem de robot ticareti için ideal hale getirir. Kullanıcı kılavuzu: ayarlar, girişler ve strateji. Atom Analisti, Piyasada Daha İyi Bir Avantaj Bulmak İçin Fiyatın Gücünü ve Momentumunu Kullanan PA Fiyat Hareketi Göstergesidir. Gürültüleri ve Yanlış Sinyalleri Kaldırmaya ve Ticaret Potansiyelini Artırmaya Yardımcı Olan Gelişmiş Filtrelerle Donatılmıştır. Birden fazla katman
M1 Sniper
Oleg Rodin
4.89 (18)
M1 SNIPER kullanımı kolay bir işlem göstergesi sistemidir. M1 zaman dilimi için tasarlanmış bir ok göstergesidir. Gösterge, M1 zaman diliminde scalping için bağımsız bir sistem olarak kullanılabilir ve mevcut işlem sisteminizin bir parçası olarak kullanılabilir. Bu işlem sistemi özellikle M1'de işlem yapmak için tasarlanmış olsa da, diğer zaman dilimleriyle de kullanılabilir. Başlangıçta bu yöntemi XAUUSD ve BTCUSD ticareti için tasarladım. Ancak bu yöntemi diğer piyasalarda işlem yaparken de ya
Game Changer Indicator
Vasiliy Strukov
4.47 (15)
Game Changer, metatrader'ınızı güçlü bir trend analiz aracına dönüştürmek için herhangi bir finansal enstrümanda kullanılmak üzere tasarlanmış devrim niteliğinde bir trend göstergesidir. Gösterge, yeniden çizim yapmaz ve gecikmez. Herhangi bir zaman diliminde çalışır ve trend tanımlamasına yardımcı olur, olası geri dönüşleri işaret eder, takip eden bir durdurma mekanizması görevi görür ve anında piyasa tepkileri için gerçek zamanlı uyarılar sağlar. İster deneyimli, ister profesyonel, ister avant
GOLD Impulse with Alert
Bernhard Schweigert
4.64 (11)
Bu gösterge, 2 ürünümüz Advanced Currency IMPULSE with ALERT  +   Currency Strength Exotics  'in süper bir kombinasyonudur. Tüm zaman dilimleri için çalışır ve 8 ana para birimi artı bir Sembol için grafiksel olarak güç veya zayıflık dürtüsünü gösterir! Bu Gösterge, Altın, Egzotik Çiftler, Emtialar, Endeksler veya Vadeli İşlemler gibi herhangi bir sembol için para birimi gücü ivmesini göstermek için uzmanlaşmıştır. Türünün ilk örneğidir, Altın, Gümüş, Petrol, DAX, US30, MXN, TRY, CNH vb. içi
Volatility Trend System - girişler için sinyaller veren bir ticaret sistemi. Oynaklık sistemi, trend yönünde doğrusal ve noktasal sinyaller ve ayrıca yeniden çizme ve gecikme olmaksızın trendden çıkmak için sinyaller verir. Trend göstergesi, orta vadeli trendin yönünü izler, yönünü ve değişimini gösterir. Sinyal göstergesi volatilitedeki değişikliklere dayalıdır ve piyasa girişlerini gösterir. Gösterge, çeşitli uyarı türleri ile donatılmıştır. Çeşitli alım satım araçlarına ve zaman dilimlerine
Scalper Inside PRO
Alexey Minkov
4.74 (69)
An exclusive indicator that utilizes an innovative algorithm to swiftly and accurately determine the market trend. The indicator automatically calculates opening, closing, and profit levels, providing detailed trading statistics. With these features, you can choose the most appropriate trading instrument for the current market conditions. Additionally, you can easily integrate your own arrow indicators into Scalper Inside Pro to quickly evaluate their statistics and profitability. Scalper Inside
Currency Strength Wizard , başarılı ticaret için size hepsi bir arada çözüm sağlayan çok güçlü bir göstergedir. Gösterge, birden çok zaman dilimindeki tüm para birimlerinin verilerini kullanarak şu veya bu forex çiftinin gücünü hesaplar. Bu veriler, şu veya bu para biriminin gücünü görmek için kullanabileceğiniz, kullanımı kolay para birimi endeksi ve para birimi güç hatları biçiminde temsil edilir. İhtiyacınız olan tek şey, işlem yapmak istediğiniz tabloya göstergeyi eklemektir ve gösterge size
Önceden gösterge   Piyasa dönüş seviyelerini ve bölgelerini belirler , fiyatın seviyeye geri dönmesini beklemenize ve yeni bir trendin başlangıcında, sonunda değil, işleme girmenize olanak tanır. Gösteriyor   tersine çevirme seviyeleri       Piyasanın yön değişikliğini teyit ettiği ve daha fazla hareket oluşturduğu yer. Bu gösterge yeniden çizim gerektirmeden çalışır, her türlü enstrüman için optimize edilmiştir ve en yüksek potansiyelini bir enstrümanla birlikte kullanıldığında ortaya koyar.
Miraculous Göstergesi – Gann Dokuz Kareye Dayalı %100 Tekrarlamayan Forex ve İkili Araç Bu video, Forex ve İkili Opsiyon traderları için özel olarak geliştirilmiş son derece doğru ve güçlü bir ticaret aracı olan Miraculous Göstergesi 'ni tanıtıyor. Bu göstergeyi benzersiz kılan, efsanevi Gann Dokuz Karesi ve Gann Titreşim Yasası 'na dayanmasıdır; bu da onu modern ticarette mevcut en hassas tahmin araçlarından biri yapmaktadır. Miraculous Göstergesi tamamen tekrarlamaz ; yani mum kapandıktan son
Currency Strength Exotics
Bernhard Schweigert
4.88 (33)
ŞU ANDA %20 INDIRIMLI! Herhangi bir Acemi veya Uzman Tüccar için En İyi Çözüm! Bu Gösterge, Egzotik Çiftler Emtialar, Endeksler veya Vadeli İşlemler gibi herhangi bir sembol için para birimi gücünü göstermek için uzmanlaşmıştır. Türünün ilk örneğidir, Altın, Gümüş, Petrol, DAX, US30, MXN, TRY, CNH vb. gerçek para birimi gücünü göstermek için 9. satıra herhangi bir sembol eklenebilir. Bu benzersiz, yüksek kaliteli ve uygun fiyatlı bir ticaret aracıdır çünkü bir dizi tescilli özelliği ve yeni b
Bu indikatörü satın alırsanız, Profesyonel Trade Manager’ımı  + EA   ÜCRETSİZ olarak alacaksınız. Öncelikle, bu Ticaret Sistemi'nin Non-Repainting, Non-Redrawing ve Non-Lagging Göstergesi olduğunu vurgulamak önemlidir, bu da hem manuel hem de robot ticareti için ideal hale getirir. Online kurs, kılavuz ve ön ayarları indir. "Smart Trend Trading System MT5", yeni ve deneyimli tüccarlar için özelleştirilmiş kapsamlı bir ticaret çözümüdür. 10'dan fazla premium göstergeyi birleştiriyor ve 7'den faz
Presenting one-of-a-kind Gann Indicator for XAUUSD IQ Gold Gann Levels is a non-repainting, precision tool designed exclusively for XAUUSD/Gold intraday trading. It uses W.D. Gann’s square root method to plot real-time support and resistance levels, helping traders spot high-probability entries with confidence and clarity. William Delbert Gann (W.D. Gann) was an exceptional market analyst whose trading technique was based on a complex blend of mathematics, geometry, astrology, and ancient calcul
Advanced Supply Demand
Bernhard Schweigert
4.91 (296)
New Year Trading Special – 50% OFF Best Solution for any Newbie or Expert Trader! This indicator is a unique, high quality and affordable trading tool because we have incorporated a number of proprietary features and a new formula. With this update, you will be able to show double timeframe zones. You will not only be able to show a higher TF but to show both, the chart TF, PLUS the higher TF: SHOWING NESTED ZONES. All Supply Demand traders will love it. :) Important Information Revealed Maximiz
Bu gösterge paneli, seçilen semboller için mevcut en son harmonik kalıpları gösterir, böylece zamandan tasarruf edersiniz ve daha verimli olursunuz / MT5 sürümü . Ücretsiz Gösterge: Basic Harmonic Pattern Gösterge sütunları Symbol : seçilen semboller görünecektir Trend: yükseliş veya düşüş Pattern : desen türü (gartley, kelebek, yarasa, yengeç, köpekbalığı, cypher veya ABCD) Entry : giriş fiyatı SL: zararı durdur fiyatı TP1: 1. kar alma fiyatı TP2: 2. kar alma fiyatı TP3: 3. kar alma fiyatı
Dynamic Forex28 Navigator
Bernhard Schweigert
4.43 (7)
Dynamic Forex28 Navigator - Yeni Nesil Forex Ticaret Aracı. ŞU ANDA %49 İNDİRİM. Dynamic Forex28 Navigator, uzun zamandır popüler olan göstergelerimizin evrimidir ve üçünün gücünü tek bir göstergede birleştirir: Gelişmiş Döviz Gücü28 Göstergesi (695 inceleme) + Gelişmiş Döviz İMPULS ve UYARI (520 inceleme) + CS28 Kombo Sinyalleri (Bonus). Gösterge hakkında ayrıntılar https://www.mql5.com/en/blogs/post/758844 Yeni Nesil Güç Göstergesi Ne Sunuyor?  Orijinallerde sevdiğiniz her şey, şimdi yeni
ŞU ANDA %26 INDIRIMLI !!! Bu gösterge, her iki ana göstergemizin ( Advanced Currency Strength 28  &   Advanced Currency IMPULSE with ALERT )  süper bir kombinasyonudur. TICK-UNITS için Para Birimi Gücü değerlerini ve 28 Forex çifti için uyarı sinyallerini gösterir. 11 farklı Tick-Unit kullanılabilir. Bunlar 1, 2, 3, 4, 5, 6, 10, 12, 15, 20 ve 30 Saniyedir. Alt penceredeki Tick-Unit çubuğu, saniyenin zamanlayıcısı içinde en az 1 tik olduğunda gösterilecek ve sola kaydırılacaktır.  Yalnızca BİR
Easy Breakout
Mohamed Hassan
4.71 (14)
After your purchase, feel free to contact me for more details on how to receive a bonus indicator called VFI, which pairs perfectly with Easy Breakout for enhanced confluence!    Easy Breakout is a powerful price action trading system built on one of the most popular and widely trusted strategies among traders: the Breakout strategy ! This indicator delivers crystal-clear Buy and Sell signals based on breakouts from key support and resistance zones. Unlike typical breakout indicators, it levera
F-16 Uçak Göstergesini tanıtıyoruz, ticaret deneyiminizi devrimleştirmek için tasarlanmış son teknoloji bir MT4 aracı. F-16 savaş uçağının eşsiz hızı ve hassasiyetinden ilham alan bu gösterge, finansal piyasalarda eşi benzeri olmayan performans sunmak için ileri algoritmalar ve son teknoloji teknolojileri bir araya getirir. F-16 Uçak Göstergesi ile gerçek zamanlı analiz sunarak yüksek doğruluklu ticaret sinyalleri üretirken rekabetin üzerine çıkacaksınız. Dinamik özellikleri, farklı varlık sınıf
FX Volume
Daniel Stein
4.63 (38)
FX Volume: Bir Broker’ın Perspektifinden Gerçek Piyasa Duyarlılığını Deneyimleyin Kısa Özet Trading yaklaşımınızı bir adım öteye taşımak ister misiniz? FX Volume , perakende traderlar ile brokerların nasıl konumlandığını gerçek zamanlı olarak sunar—COT gibi gecikmeli raporlardan çok daha önce. İster istikrarlı kazançları hedefliyor olun, ister piyasada daha güçlü bir avantaj arayın, FX Volume önemli dengesizlikleri belirlemenize, kırılmaları (breakout) doğrulamanıza ve risk yönetiminizi iyileş
MT5 Versiyonu Burada Mevcut: https://www.mql5.com/en/market/product/50048 Telegram Kanalı ve Grubu: https://t.me/bluedigitsfx V.I.P Grup Erişimi: Ücretli ürünlerimizden herhangi birinin ödeme kanıtını özel mesaj ile gönderin Önerilen Broker: https://bit.ly/BlueDigitsFxStarTrader BlueDigitsFx Easy 123 System — MT4 için Güçlü Tersine Dönüş ve Kopuş Tespiti Piyasa yapısındaki değişimleri, kopuşları ve trend dönüşlerini kolayca tespit etmek için tasarlanmış, baştan sona non-repaint (yeniden çiz
FX Power MT4 NG
Daniel Stein
4.95 (20)
FX Power: Daha Akıllı Ticaret Kararları için Para Birimlerinin Gücünü Analiz Edin Genel Bakış FX Power , her piyasa koşulunda başlıca para birimlerinin ve altının gerçek gücünü anlamak için vazgeçilmez bir araçtır. Güçlü para birimlerini alıp zayıf olanları satarak, FX Power ticaret kararlarınızı basitleştirir ve yüksek olasılıklı fırsatları ortaya çıkarır. İster trendlere sadık kalın ister Delta'nın aşırı değerlerini kullanarak tersine dönüşleri öngörün, bu araç ticaret tarzınıza mükemmel bir
Day Trader Master , günlük tüccarlar için eksiksiz bir ticaret sistemidir. Sistem iki göstergeden oluşmaktadır. Bir gösterge, satın almak ve satmak için bir ok işaretidir. Aldığınız ok göstergesidir. Size ikinci göstergeyi ücretsiz olarak sağlayacağım. İkinci gösterge, bu oklarla birlikte kullanılmak üzere özel olarak tasarlanmış bir trend göstergesidir. GÖSTERGELER TEKRARLAMAYIN VE GEÇ KALMAYIN! Bu sistemi kullanmak çok basittir. İki renkli bir çizgi olarak görüntülenen mevcut trend yönündeki o
ŞU ANDA %31 INDIRIMLI !!! Yeni Başlayanlar veya Uzman Tüccarlar için En İyi Çözüm! Bu gösterge benzersiz, yüksek kaliteli ve uygun fiyatlı bir ticaret aracıdır çünkü bir dizi tescilli özellik ve gizli bir formül ekledik. Yalnızca BİR grafikle 28 döviz çiftinin tümü için Uyarılar verir. Yeni bir trendin veya scalping fırsatının tam tetik noktasını belirleyebildiğiniz için ticaretinizin nasıl gelişeceğini hayal edin! Yeni temel algoritmalar üzerine inşa edilen bu sistem, potansiyel işlemlerin
Yazarın diğer ürünleri
The script is based on the simulation of trade transactions using a random number generator. This allows you to get completely different results, even with the same input parameters. When you run the script, a dialog box opens in which you can set the desired values ​​for external variables. In the  Trading options  block, the basic parameters that are necessary for trading modeling are defined. Start Balance  - sets the initial size of the trade balance. Number Trade  - sets the number of trad
FREE
This script is designed so that the trader can determine the average duration of trade transactions, at which the ratio of possible profits and losses will be optimal. First, let's look at the general approach to determining the optimal duration of trade transactions. We introduce the following variables: R   - the result of the transaction; T   - the time during which the transaction was open; W - the time between the closing of the previous transaction and the opening of the next one. Every tr
FREE
Choosing the levels of StopLoss and TakeProfit can have a very strong impact on the overall performance of trading. In addition to the obvious parameters of a trade transaction - the size of a possible win or probable loss - the levels of StopLoss and TakeProfit also affect the expected duration of the transaction, and the profitability of trading in general. If you have already determined the optimal transaction duration using the “ AIS-ODT ” script, then you can begin to determine the paramete
FREE
This script is designed so that the trader can determine the average duration of trade transactions, at which the ratio of possible profits and losses will be optimal. First, let's look at the general approach to determining the optimal duration of trade transactions. We introduce the following variables: R   - the result of the transaction; T   - the time during which the transaction was open; W  - the time between the closing of the previous transaction and the opening of the next one. Every t
FREE
The script allows selecting the required 'Filter level' value of the AIS-MTF MT5 indicator. Run the script on the required chart and selected timeframe. Once its operation is complete, the HPS.csv file will be created in the Files folder. Open the file. You will see three columns. The 'Filter lvl' column represents the value of the 'Filter level' for the AIS-MTF indicator. Am. dev. - degree and direction of the indicator's deviation from the price level (sorted in ascending order). Negative valu
FREE
This script allows selecting the TakeProfit and StopLoss levels. It analyzes the history data, and then calculates the probability of reaching a given price level. How the script works Suppose you have a trading strategy and you want to select the TakeProfit and StopLoss levels. Run the script and set the parameter: Number of Bars - the average position holding time in bars. Once the script operation is complete, the AIS-PPL.csv file will be created in the Files folder in the terminal data cata
FREE
The script analyzes the history of quotes and gives recommendations on the minimum deposit. The calculations take into account the variability of prices and the standard deviation. Margin requirements for the instrument are also taken into account. The result of the script is the minimum recommended deposit for trading the given currency pair.
FREE
MinDeposit
Aleksej Poljakov
5 (1)
The script analyzes the history of quotes and gives recommendations on the minimum deposit. The calculations take into account the variability of prices and the standard deviation. Margin requirements for the instrument are also taken into account. The result of the script is the minimum recommended deposit for trading the given currency pair.
FREE
Choosing the levels of StopLoss and TakeProfit can have a very strong impact on the overall performance of trading. In addition to the obvious parameters of a trade transaction - the size of a possible win or probable loss - the levels of StopLoss and TakeProfit also affect the expected duration of the transaction, and the profitability of trading in general. If you have already determined the optimal transaction duration using the “ AIS-ODT ” script, then you can begin to determine the paramete
FREE
The script is based on the simulation of trade transactions using a random number generator. This allows you to get completely different results, even with the same input parameters. When you run the script, a dialog box opens in which you can set the desired values ​​for external variables. In the Trading options block, the basic parameters that are necessary for trading modeling are defined. Start Balance - sets the initial size of the trade balance. Number Trade - sets the number of trade tr
FREE
The script allows selecting the required 'Filter level' value of the AIS-MTF indicator. Run the script on the required chart and selected timeframe. Once its operation is complete, the HPS.csv file will be created in the Files folder. Open the file. You will see three columns. The 'Filter lvl' column represents the value of the 'Filter level' for the AIS-MTF indicator. Am. dev. - degree and direction of the indicator's deviation from the price level (sorted in ascending order). Negative values i
FREE
AIS Doğru Ortalamalar göstergesi, piyasadaki bir trend hareketinin başlangıcını belirlemenizi sağlar. Göstergenin bir diğer önemli kalitesi, trendin sonunun açık bir işaretidir. Gösterge yeniden çizilmez veya yeniden hesaplanmaz. Görüntülenen Değerler h_AE - AE kanalının üst sınırı l_AE - AE kanalının alt sınırı h_EC - Mevcut çubuk için yüksek tahmin edilen değer l_EC - Mevcut çubuk için düşük tahmin edilen değer Gösterge ile çalışırken sinyaller Ana sinyal, AE ve EC kanallarının kesişimid
AIS Ağırlıklı Hareketli Ortalama göstergesi, ağırlıklı bir hareketli ortalama hesaplar ve trend olan bir piyasa hareketinin başlangıcını belirlemenize olanak tanır. Ağırlık katsayıları, her bir çubuğun belirli özellikleri dikkate alınarak hesaplanır. Bu, rastgele piyasa hareketlerini filtrelemenize olanak tanır. Bir trendin başladığını teyit eden ana sinyal, gösterge çizgilerinin yönündeki bir değişiklik ve gösterge çizgilerini geçen fiyattır. WH (mavi çizgi), Yüksek fiyatların ağırlıklı ort
AIS Advanced Grade Fizibilite göstergesi, fiyatın gelecekte ulaşabileceği seviyeleri tahmin etmek için tasarlanmıştır. Görevi, son üç çubuğu analiz etmek ve buna dayalı bir tahmin oluşturmaktır. Gösterge herhangi bir zaman diliminde ve herhangi bir döviz çiftinde kullanılabilir. Ayarların yardımıyla, tahminin istenen kalitesini elde edebilirsiniz. Tahmin derinliği - istenen tahmin derinliğini çubuklar halinde ayarlar. Bu parametrenin 18-31 aralığında seçilmesi önerilir. Bu sınırların ötesine g
The indicator is designed to measure the price volatility. This allows determining the moments for opening or closing trade positions more accurately. High intensity of the market indicates the instability of its movement, but allows for better results. And, conversely, low intensity of the market indicates the stability of its movement. Parameters Bars to process - the number of bars to measure the price movements. A low value of this parameter allows determining the moments of rapid price mov
The indicator is based on the analysis of interaction of two filters. The first filter is the popular Moving Average. It helps to identify linear price movements and to smooth minor price fluctuations. The second filter is the Sliding Median. It is a non-linear filter. It allows to filter out noise and single spikes in the price movement. A predictive filter implemented in this indicator is based on the difference between these filters. The indicator is trained during operation and is therefore
This indicator studies the price action as a combination of micro-trends. All micro-trends are analyzed and averaged. Price movement is filtered based on this averaging. IP_High and IP_Low (blue and red dashed lines) show the instantaneous price movement. They display the forecast only for the current price values, taking into account only the number of bars defined by the 'Filter level' parameter. SP_High and SP_Low (blue and red solid lines) smooth the price movements with respect to history.
Bu gösterge, basit bir doğrusal yumuşatma işlemi uygular. Üstel yumuşatmanın dezavantajlarından biri, sinyalin hızlı bozulmasıdır. Bu, fiyat aralığındaki uzun vadeli eğilimleri tam olarak takip etmeyi imkansız hale getirir. Doğrusal yumuşatma, sinyal filtrelemeyi daha doğru ve ince bir şekilde ayarlamanıza olanak tanır. Gösterge, parametreler seçilerek yapılandırılır: LP - bu parametre, yumuşatma süresini seçmenize olanak tanır. Değeri ne kadar büyük olursa, gösterge o kadar uzun vadeli eğil
This script allows selecting the TakeProfit and StopLoss levels. It analyzes the history data, and then calculates the probability of reaching a given price level. How the script works Suppose you have a trading strategy and you want to select the TakeProfit and StopLoss levels. Run the script and set the parameter: Number of Bars - the average position holding time in bars. Once the script operation is complete, the AIS-PPL.csv file will be created in the Files folder in the terminal data cata
FREE
Этот индикатор представляет гибридный фильтр основанный на совместном использовании медианы и скользящей средней. Использование медианы позволяет отфильтровывать аномальные выбросы и случайные импульсы в значениях ценового ряда. При этом на трендовую составляющую медианный фильтр не действует, оставляя ее без изменений. Так как медианный фильтр является нелинейным, то для сглаживания его значений используется скользящая средняя. Такой подход позволяет более точно выделять не только тренд, но и п
This indicator is a combination of two modified Lanczos filters. The first filter serves to extrapolate the price. Based on past values, he predicts a possible price movement within the current bar. That is, it shows what the price would be if the past trends remained unchanged. The second filter for smoothing and averaging prices within the window, determined by the level of the filter. Thanks to the selection of weights, this filter is most actively responding to the periodic component that is
Let's look at the nature of price changes in the Forex market, not paying attention to the reasons why these changes occur. This approach will allow us to identify the main factors affecting the price movement. For example, let's take the opening prices of bars on the EUR-USD currency pair and the H1 timeframe. For these prices, we construct the Lameray diagram (Figure 1). In this diagram, it can be seen that the price movement basically occurs according to a linear equation. To determine the pa
This indicator is more informative. His work is based on the assumption that the price movement in the market can be represented as noise of a particular color, which depends on the parameters of the distribution of price values. Thanks to this, it is possible to analyze the price change from different angles, and considering the price movement as noise of a particular color, one can get information about the current state of affairs in the market and make a forecast about the price behavior. W
Despite some drawbacks of the “ AIS Color Noise Filter ” indicator, the idea to use it to smooth the price series and forecast prices looks quite attractive. This is due to several reasons: first, taking into account several noise components allows building a forecast on factors independent of each other, which can improve the quality of forecasting; secondly, the noise characteristics of the price series behave quite stably throughout the entire history, which makes it possible to obtain stabl
Very often, in the study of financial series apply their smoothing. Using smoothing, you can remove high-frequency components - it is believed that they are caused by random factors and therefore irrelevant. Smoothing always includes some way of averaging the data, in which random changes in the time series mutually absorb each other. Most often, for this purpose, simple or weighted moving average methods are used, as well as exponential smoothing. Each of these methods has its advantages and d
In order to isolate long-term and non-random components, it is necessary to know not only how much the price has changed, but also how these changes occurred. In other words - we are interested not only in the values ​​of price levels, but also in the order in which these levels replace each other. Through this approach, one can find long-term and stable factors that influence (or may influence) the price change at a given point in time. And knowledge of these factors allows you to make a more
One of the powerful methods of analysis is the modeling of financial series using Levy processes. The main advantage of these processes is that they can be used to model a huge number of phenomena - from the simplest to the most complex. Suffice it to say that the idea of ​​the fractal price movement in the market is only a special case of Levy processes. On the other hand, with proper selection of parameters, any Levy process can be represented as a simple moving average. Figure 1 shows an exa
Very often, the trader is faced with the task of determining the extent to which the price may change in the near future. For this purpose, you can use the Johnson distribution type SB. The main advantage of this distribution is that it can be used even with a small amount of accumulated data. The empirical approach used in determining the parameters of this distribution, allows you to accurately determine the maximum and minimum levels of the price channel. These values ​​can be used in differ
This indicator allows you to determine the likelihood that the price will reach one or another level. Its algorithm is quite simple and is based on the use of statistical data on the price levels of a particular currency pair. Thanks to the collected historical data, it is possible to determine the extent to which the price will change during the current bar. Despite its simplicity, this indicator can provide invaluable assistance in trading. So, with its help it is possible to determine TakePr
Stable distributions can be used to smooth financial series. Since a fairly deep history can be used to calculate the distribution parameters, such smoothing may in some cases be even more effective than other methods. The figure shows an example of the distribution of the opening prices of the currency pair " EUR-USD " on the time frame H1 for ten years (figure 1). Looks fascinating, doesn't it? The main idea behind this indicator is to determine the parameters of a stable distribution based
Filtrele:
İnceleme yok
İncelemeye yanıt