Master Volume Profiler

KenKem Master Volume Profiler - Brief Introduction

A Display-only volume-profile cockpit for XAUUSD, BTCUSD and other liquid symbols. Draws profile structure, multi-timeframe flow, EMA trend and study-only setup markers. Places no orders. Not a signal service. It maps where the market has actually traded and reads recent order flow, so you can see structure and lean at a glance. 

What it shows:

  • Master and local volume profiles (POC and value-area high/low) - the price shelves that matter.

  • A live telemetry panel: multi-timeframe buy/sell lean, volatility and POC drift, bias, and a spread / tape execution-health check.

  • A near-price verdict tag (net / over / under) summarizing flow around current price.

  • An EMA trend overlay (25 / 75 / 100 / 200) with an optional alignment ribbon.

  • Optional historical setup markers (E / SL / TP1 / TP2, tagged WON / LOST / BE) - a study aid showing how past breakout-style setups resolved, not live signals.

Tuned for XAUUSD M5; also runs on BTCUSD and other liquid symbols on M3 and M5. A ready-made .set preset is included - load it from the Inputs tab.

Important: markers and readings are historical or descriptive and are not predictive. Nothing here is financial advice or a promise of results. Trading leveraged products carries a high risk of loss. Use at your own risk.

Full description (for the main 32000-char description field)

KK-MasterVP Profiler - Volume-Profile Cockpit for Gold, Bitcoin and more

A display-only chart indicator that turns raw candles into readable structure. It draws the volume-profile shelves where activity has concentrated, reads how recent order flow leans, and overlays trend context - all without placing a single order.

It is the visual twin of the KK-MasterVP study: the same structure the strategy reasons about, shown on your chart so you can follow along.

What it draws

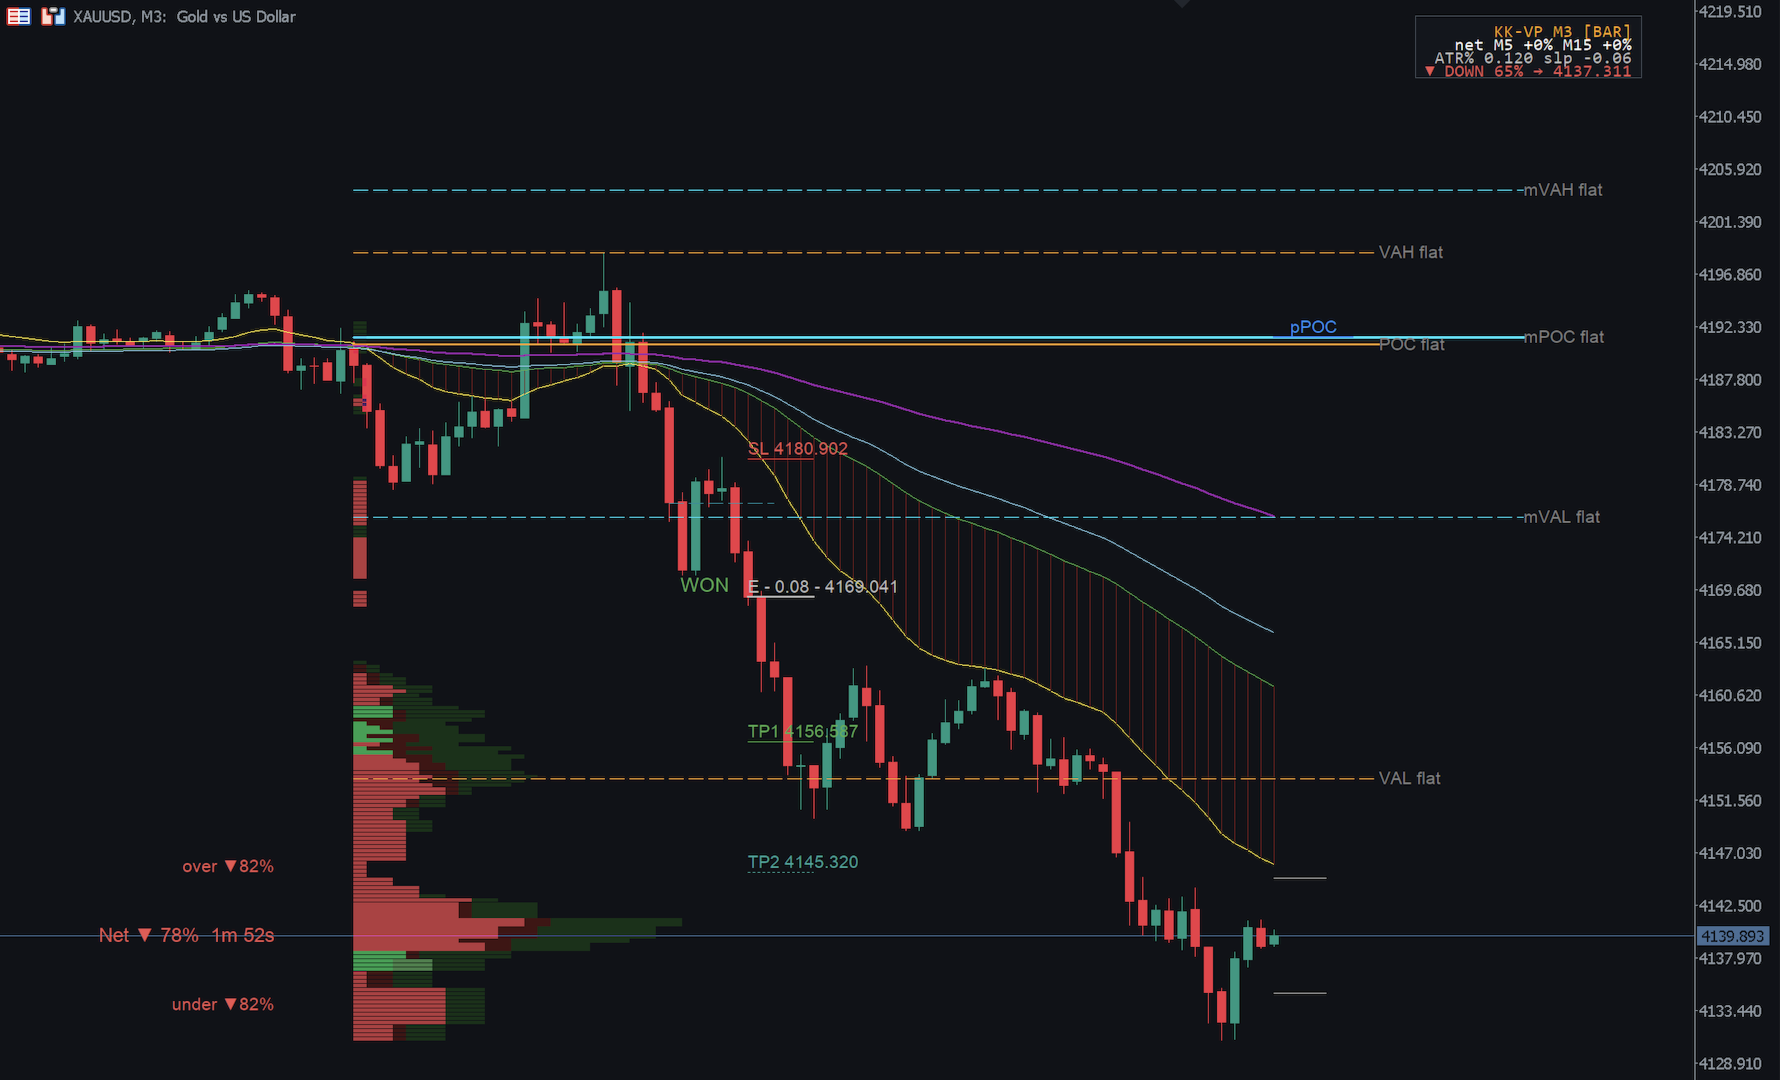
  • Master and local volume profiles - POC (the busiest price) plus the value-area high/low that bound the bulk of activity.

  • A predicted-POC line previewing where the center of activity may drift.

  • A side histogram of activity by price, with a recent buy/sell color lean.

What it reads (always-on telemetry panel)

  • Multi-timeframe net buy/sell lean, as plus/minus percentages.

  • Volatility and POC drift - how active the market is and which way structure is sliding.

  • POC stability (stable vs rotation) and a one-line bias summary.

  • Execution health - spread and tape speed versus their own recent norms, with ! / !! warnings when conditions are rough.

  • A near-price verdict tag (net / over / under) right beside live price.

Trend context

  • Four-EMA overlay (25 / 75 / 100 / 200) with an optional ribbon that shades when the stack is cleanly aligned.

Study-only setup markers (optional)

  • E / SL / TP1 / TP2 lines for breakout-style setups found in historical bars, each tagged WON, LOST, or BE.

  • These are a learning aid only. They are not live signals, not advice, and not a prediction that the next one behaves the same way.

Setup

  • Tuned for XAUUSD on M5. Also runs on BTCUSD and other liquid symbols on M3 and M5; elsewhere, read it as approximate.

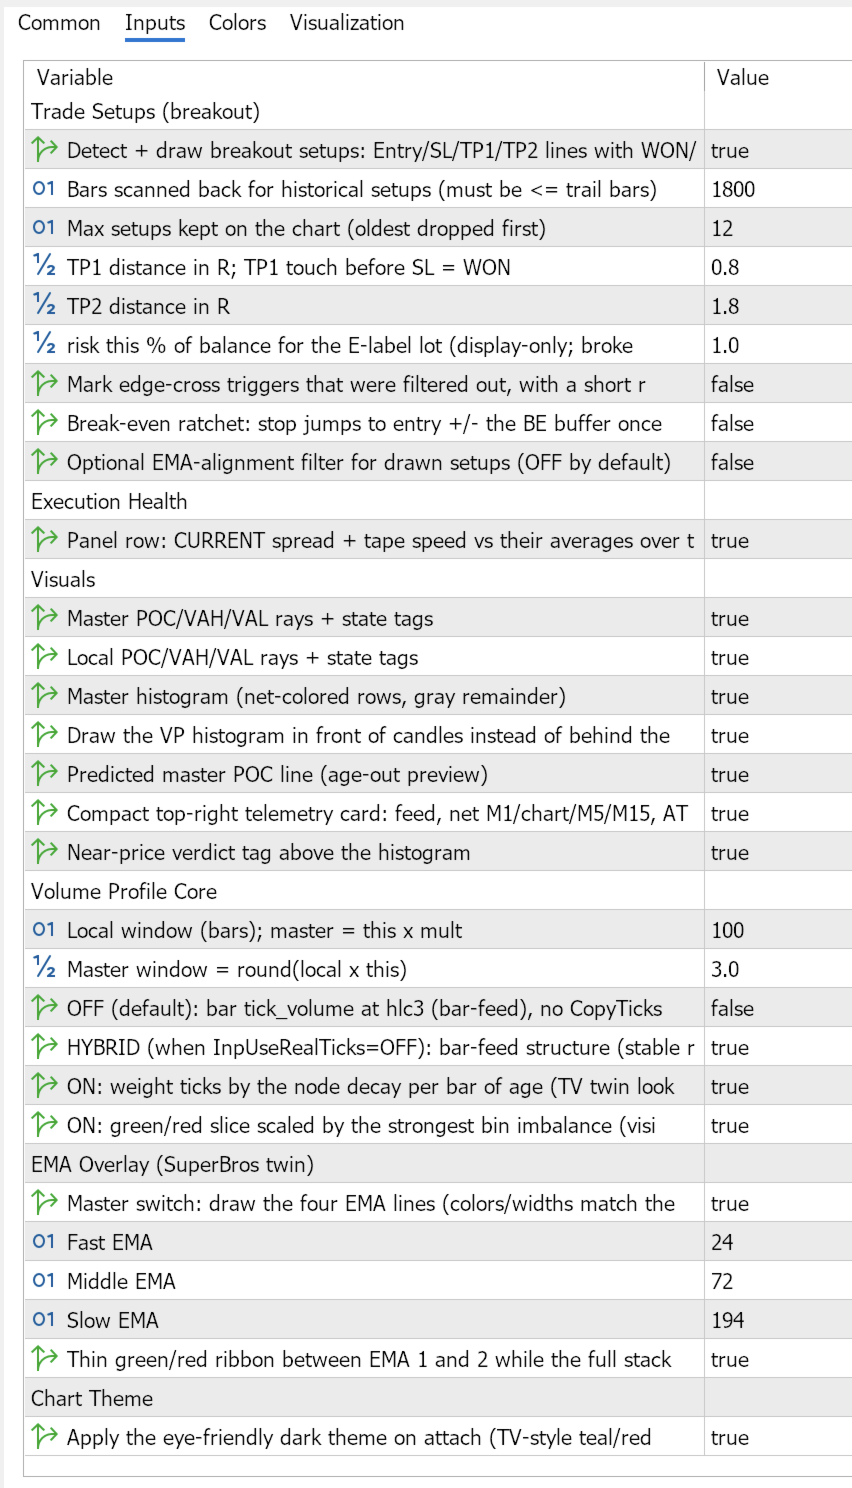
  • A ready-made .set preset ships with it - load it from the Inputs tab for a sensible one-click configuration.

  • A clean dark theme is applied by default and can be turned off.

What it is not

  • Not an autotrader. Not a signal service. Not a promise of future results. It places, modifies, and closes nothing.

Note

Every marker and reading is historical or descriptive - it describes what has happened, not what will happen. Markets change, and a run of WON tags is not a guarantee. Nothing here is financial, investment, legal, or tax advice, and no outcome is promised. Trading leveraged products such as Gold and cryptocurrencies carries a high risk of loss - you may lose more than you can afford. You alone are responsible for your decisions. Consider consulting an independent, appropriately licensed professional.

Tags: volume profile, POC, value area, order flow, XAUUSD, gold, BTCUSD, bitcoin, EMA, trend, indicator, display only.
Önerilen ürünler
Fabii Half Trend Baseline
Fabien Georges Andre Guillemaud
Üst zaman diliminin trendine karşı işlem yapmayı bırakın. İki baseline, tek grafik. Repaint yok. Her parite, her zaman dilimi. 2 dakikada grafiğinizde. Strategy Tester içinde ücretsiz demo. Get more indicators here Baselines, volatility filters and oscillators. No repaint. Neden ihtiyacınız var Grafiğinizde bir çizgi yeşile döndüğü için işleme girersiniz. Sonra üst zaman dilimini açarsınız ve daha büyük trendin ters yönde olduğunu görürsünüz. Sinyal gerçekti. Ama arkasındaki trend sizin taraf
RBreaker
Zhong Long Wu
RBreaker Gold Indicators is a short-term intraday trading strategy for gold futures that combines trend following and intraday reversal approaches. It not only captures profits during trending markets but also enables timely profit-taking and counter-trend trading during market reversals. This strategy has been ranked among the top ten most profitable trading strategies by the American magazine   Futures Truth   for 15 consecutive years. It boasts a long lifecycle and remains widely used and st
Premium seviye, %80'den fazla doğru tahmin doğruluğuna sahip benzersiz bir göstergedir! Bu gösterge en iyi Ticaret Uzmanları tarafından iki aydan uzun süredir test edilmiştir! Yazarın göstergesini başka hiçbir yerde bulamazsınız! Ekran görüntülerinden bu aracın doğruluğunu kendiniz görebilirsiniz! 1, sona erme süresi 1 mum olan ikili opsiyon ticareti için harikadır. 2 tüm döviz çiftleri, hisse senetleri, emtialar, kripto para birimleri üzerinde çalışır Talimatlar: Kırmızı ok göründüğü an
CosmiCLab SMC FIBO CosmiCLab SMC FIBO is a professional trading indicator designed for traders who use Smart Money Concepts (SMC), market structure analysis and Fibonacci retracement levels. The indicator automatically detects market swings and builds Fibonacci levels based on the latest impulse movement. It also identifies market structure changes such as BOS (Break of Structure) and CHOCH (Change of Character), helping traders understand the current market direction. CosmiCLab SMC FIBO also pr
Noize Absorption Index - is the manual trading system that measures the difference of pressure between bears forces and bulls forces. Green line - is a noize free index that showing curent situation. Zero value of index shows totally choppy/flat market.Values above zero level shows how powerfull bullish wave is and values below zero measures bearish forces.Up arrow appears on bearish market when it's ready to reverse, dn arrow appears on weak bullish market, as a result of reverse expectation.
Price Magnet — Price Density and Attraction Levels Indicator Price Magnet is a professional analytical tool designed to identify key support and resistance levels based on statistical Price Density. The indicator analyzes a specified historical period and detects price levels where the market spent the most time. These zones act as “magnets,” attracting price action or forming a structural base for potential reversals. Unlike traditional Volume Profile tools, Price Magnet focuses on price-time d
DAILY OH/OL SDEV QUANT MODEL - STATISTICAL TRADING WITH PRECISION RISK MANAGEMENT TRADE WITH MATHEMATICAL CERTAINTY - KNOW YOUR EXACT STOP-LOSS AND TAKE-PROFIT BEFORE YOU ENTER This indicator analyzes 5,000+ days of price history to give you: Exact entry levels (sigma bands locked at daily open) Exact stop-loss distance (from M
ONNYX INDICATOR sürüm 1.14 MetaTrader 5 için onaylanmış ve yeniden boyanmayan sinyallere sahip arz-talep göstergesidir. Onaylı salınımları belirler, bölge genişliğini ATR ile ayarlar, kaliteyi yüzde olarak gösterir ve kapanmış mumlarda BUY/SELL okları çizer. TEMEL ÖZELLİKLER - Bölge içinde yüzde kalite puanı bulunan arz-talep bölgeleri. - Mum kapanışından sonra büyütülmüş BUY/SELL okları. - İsteğe bağlı EMA trend filtresi ve mum reddi onayı. - Trend, fiyat seviyeleri ve piyasa bağlamı paneli. -
Heiken_Ashi_Bars - MT5 için Gelişmiş Trend Görselleştirici Genel Bakış Heiken_Ashi_Bars , piyasa gürültüsünü filtrelemek ve temel trendi vurgulamak için tasarlanmış güçlü, görsel olarak sezgisel bir özel göstergedir (indicator). Geleneksel mum grafikler genellikle düzensiz olabilir. Bu gösterge fiyat verilerinin ortalamasını alarak fiyat hareketini pürüzsüzleştirir, böylece trend devamlılıklarını, geri dönüşleri ve karlı giriş bölgelerini tespit etmeyi çok daha kolay hale getirir. Temel Özellikl
Was: $249  Now: $99   Market Profile defines a number of day types that can help the trader to determine market behaviour. A key feature is the Value Area, representing the range of price action where 70% of trading took place. Understanding the Value Area can give traders valuable insight into market direction and establish the higher odds trade. It is an excellent addition to any system you may be using. Inspired by Jim Dalton’s book “Mind Over Markets”, this indicator is designed to suit the
Your Trend Friend
Luigi Nunes Labigalini
5 (1)
The trend is your friend! Look at the color of the indicator and trade on that direction. It does not  repaint. After each candle is closed, that's the color of the trend. You can focus on shorter faster trends or major trends, just test what's most suitable for the symbol and timeframe you trade. Simply change the "Length" parameter and the indicator will automatically adapt. You can also change the color, thickness and style of the lines. Download and give it a try! There are big movements w
Auto-levels trading robot: key levels & risk manager Short Description: Automatically plots dynamic weekly support and resistance zones with real-time risk tracking. Full Description: Elevate your chart analysis with a dynamic tool designed to map the market structure effortlessly. This indicator automatically calculates and plots critical support and resistance levels based on weekly price action, updating every new week to align seamlessly with current market dynamics. By projecting precise pe
Cumulative Volume Delta MA-X MTF (Gradient Momentum ile) Bu indikatör, MetaTrader 5 için çoklu zaman dilimi (MTF) Kümülatif Hacim Deltası (CVD) analizi gerçekleştirir. Tick veya gerçek hacim verilerini analiz ederek alış ve satış baskısı arasındaki net farkı hesaplar ve emir akışı duyarlılığının görsel bir temsilini sunar. İndikatör Mantığı ve Özellikleri İndikatör, hacim analizi için matematiksel bir yaklaşım kullanır: Veri Kaynağı: Hem Gerçek Hacim (Borsa varlıkları için Real Volume ) hem de
STRICTLY FOR BOOM INDEX ONLY!!!!! Here I bring the Maximum Trend Arrows OT1.0 MT5 indicator. This indicator is made up of a combination of different trend indicators for entries and exits, for entries an orange arrow will paint on the chart below the current market and a red flag for closing of trades and it produces buy arrows only. When the orange arrow appears, it will appear along with it's sound to notify you. The 1H timeframe is recommended, don't use it anywhere else than on the 1H timefr

Binary Rise Fall
Israr Hussain Shah
Here   our more valuable tools SMC Trend Trading   ,  Easy SMC Trading  ,  Institutional SMC Architect Volume Analysis Tools  ,  Volume flow Profile  ,  Market volume profile  , FVG with Volume  , Liquidity Heatmap Profile  ,  Volume Spread Analysis The Fractals_Price indicator is a technical analysis tool that identifies fractal patterns on price charts. Fractals are recurring patterns that signal potential trend reversals or continuation points. This indicator marks both upward and downward
SMART ATR GRID PRO++ – Adaptive Grid Intelligence Suite is a next-generation, institutional-grade grid trading indicator engineered for traders who demand precision, adaptability, and comprehensive market structure analysis. By seamlessly integrating   Adaptive Volatility Grid System ,   KAMA Candle Trend Filtering ,   Multi-Factor Trend Detection (ADX + EMA20/50) ,   Dynamic Heatmap Zone Engine , and   Real-Time Market Regime Classification , this indicator delivers a complete decision-making
What Is Trend Master Pro? Trend Master Pro   is a professional-grade trend trading indicator built for MetaTrader 5. It was designed with one goal in mind — to keep you on the right side of the market at all times by combining three powerful technical tools into a single, clean, easy-to-read display directly on your price chart. Instead of cluttering your screen with multiple separate indicators, Trend Master Pro fuses an   EMA Ribbon trend filter , a   ZigZag swing point engine , and a   breako
Smart Support And Resistance Indicator See the Market Levels That Matter. Make your chart clearer and your technical analysis more organized with Smart Support And Resistance Indicator — a powerful trading tool designed to help traders identify important support and resistance levels directly on their MetaTrader 5 charts. Whether you trade Forex, Gold, Indices, or other available markets, this indicator helps you focus on key price areas, monitor potential market reactions, and analyze price act
LT Rainbow Trend
Thiago Duarte
5 (1)
== LT RAINBOW TREND - 36 HAREKETLİ ORTALAMALI TREND İNDİKATÖRÜ == GENEL BAKIŞ LT Rainbow Trend, akıllı bir renk sistemi (Rainbow/Gökkuşağı) ile çalışan ve aynı anda 36 Hareketli Ortalamayı (Moving Average) kullanan gelişmiş bir teknik trend analizi indikatörüdür. Ana trend yönünde maksimum görsel netlikle işlem yapmak isteyen yatırımcılar için geliştirilen bu indikatör, çoklu zaman dilimi (multi-timeframe) analizinin karmaşıklığını basit, renkli ve son derece sezgisel bir görünüme dönüştürür.
Structure King AI Signal Structure King AI Signal is a professional MetaTrader 5 trading indicator designed to help traders analyze market structure, trend direction, multi-timeframe confirmation and trade management from one clean dashboard. Key Features • Market Structure & Trend Analysis • BUY / SELL Signals • Multi-Timeframe (HTF) Confirmation • Entry Price Levels • Dynamic Stop Loss (SL) • TP1 / TP2 / TP3 Levels • ATR Volatility Analysis • ADX Trend Strength Filter • Adaptive Market Filter
Passband Filter Pro Passband Filter Pro is a trend and cycle oscillator for MetaTrader 5. It is built on the Ehlers Super Passband Filter, a band pass filter that removes long term trend drift and short term noise so that only the dominant market cycle remains. The result is a clean oscillator with a color cloud that shows overbought and oversold conditions, cycle turns, and momentum on forex, gold, indices, stocks and crypto. Most traders enter too early or too late. Simple moving averages la
Gösterge, tarihsel olanlarla karşılaştırılabilecek güncel teklifler oluşturur ve bu temelde bir fiyat hareketi tahmini yapar. Gösterge, istenen tarihe hızlı navigasyon için bir metin alanına sahiptir. Seçenekler: Sembol - göstergenin göstereceği sembolün seçimi; SymbolPeriod - göstergenin veri alacağı dönemin seçimi; GöstergeRenk - gösterge rengi; Ters - doğru tırnakları tersine çevirir, yanlış - orijinal görünüm; Sonraki, tarihi girebileceğiniz ve 'enter' tuşuna basarak hemen atlayab
Advanced Volume Profile Analysis Tool for MetaTrader 5 The Kecia Volume Profile Order Finder provides traders with volume profile analysis capabilities. This MT5 indicator combines volume profile visualization with statistical calculations to help identify potential trading opportunities and suggests entry, stop loss, and take profit levels based on market structure. Market Profile Visualization Transform your chart with customizable volume profile visualizations: Multiple visualization options
Unlock key market insights with automated support and resistance lines Tired of plotting support and resistance lines? This is a multi-timeframe indicator that detects and plots supports and resistance lines in the chart with the same precision as a human eye would. As price levels are tested over time and its importance increases, the lines become thicker and darker, making price leves easy to glance and evaluate. [ Installation Guide | Update Guide | Troubleshooting | FAQ | All Products  ] Boo
Supply demand arrows
Smaylle Rafael Coelho Mariano
The   "Supply Demand Arrows"   indicator for MetaTrader 5 (MT5) is a powerful trading tool designed to help traders identify critical supply and demand zones in the market. By visually marking these zones with arrows, the indicator enhances trading precision and decision-making. Key Features Identification of Supply and Demand Zones : The indicator effectively highlights key supply and demand zones on the price chart, allowing traders to see where significant buying or selling pressure exists. T
FREE
# DRAWDOWN INDICATOR V4.0 - The Essential Tool to Master Your Trading ## Transform Your Trading with a Complete Real-Time Performance Overview In the demanding world of Forex and CFD trading, **knowing your real-time performance** isn't a luxury—it's an **absolute necessity**. The **Drawdown Indicator V4.0** is much more than a simple indicator: it's your **professional dashboard** that gives you a clear, precise, and instant view of your trading account status. --- ## Why This Indicator
VWAP Analytics Advanced Suite for MetaTrader 5 Gain institutional-grade market insight with the VWAP Analytics Advanced Suite , a professional Volume Weighted Average Price indicator built exclusively for MetaTrader 5. This tool goes beyond a simple VWAP line; it is a complete analytical ecosystem designed to identify trend bias, measure market deviation, and provide high-probability entry and exit signals with precision timing. Whether you are a day trader, scalper, or swing trader, this su
HAS RSI Signal — Otomatik SL/TP Hesaplamalı Profesyonel Trend Göstergesi HAS RSI Signal , kanıtlanmış klasik yöntemleri modern gürültü filtreleme algoritmalarıyla birleştiren güçlü bir ticaret aracıdır. Gösterge, piyasayı Heiken Ashi Smoothed (HAS) mumları ve RSI osilatörü merceğinden analiz ederek, trend dönüşlerinde veya aşırı alım/satım bölgelerinden çıkışlarda yatırımcıya net giriş sinyalleri sağlar. Temel Avantajlar: Çift Filtreleme: Heiken Ashi Smoothed kullanımı piyasadaki "gürültüyü" ort
HMA Trend Professional MT5
Pavel Zamoshnikov
4.25 (4)
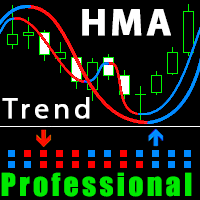
Improved version of the free HMA Trend indicator (for MetaTrader 4) with statistical analysis. HMA Trend is a trend indicator based on the Hull Moving Average (HMA) with two periods. HMA with a slow period identifies the trend, while HMA with a fast period determines the short-term movements and signals in the trend direction. The main differences from the free version: Ability to predict the probability of a trend reversal using analysis of history data. Plotting statistical charts for analyzi
Here   our more valuable tools SMC Trend Trading   ,  Easy SMC Trading  ,  Institutional SMC Architect Volume Analysis Tools  ,  Volume flow Profile  ,  Market volume profile  , FVG with Volume  , Liquidity Heatmap Profile  ,  Volume Spread Analysis The    Liquidity Heatmap   is a sophisticated institutional trading tool designed to reveal where over-leveraged traders are trapped. By calculating estimated liquidation levels based on volume spikes and leverage, this indicator draws a dynamic "h
Bu ürünün alıcıları ayrıca şunları da satın alıyor
ARIPoint
Temirlan Kdyrkhan
1 (4)
ARIPoint is a powerful trading companion designed to generate high-probability entry signals with dynamic TP/SL/DP levels based on volatility. Built-in performance tracking shows win/loss stats, PP1/PP2 hits, and success rates all updated live. Key Features: Buy/Sell signals with adaptive volatility bands Real-time TP/SL/DP levels based on ATR Built-in MA Filter with optional ATR/StdDev volatility Performance stats panel (Success, Profit/Loss, PP1/PP2) Alerts via popup, sound, push, or email Cu
TrendMaestro5
Stefano Frisetti
note: this indicator is for METATRADER4, if you want the version for METATRADER5 this is the link:  https://www.mql5.com/it/market/product/108106 TRENDMAESTRO ver 2.5 TRENDMAESTRO recognizes a new TREND from the start, he never makes mistakes. The certainty of identifying a new TREND is priceless. DESCRIPTION TRENDMAESTRO identifies a new TREND in the bud, this indicator examines the volatility, volumes and momentum to identify the moment in which there is an explosion of one or more of these da
AriX
Temirlan Kdyrkhan
1 (4)
AriX Indicator for MT5 A powerful trend-following and signal-evaluation tool AriX is a custom MT5 indicator that combines Moving Averages and ATR-based risk/reward logic to generate clear buy/sell signals. It visualizes dynamic SL/TP levels, evaluates past trade outcomes, and displays win/loss statistics in a clean on-chart panel. Key features include: Buy/Sell signals based on MA crossovers ATR-based SL/TP1/TP2/TP3 levels with visual lines and labels Signal outcome tracking with real-time stat
Meravith Scanner
Ivan Stefanov
5 (3)
MERAVITH SCANNER, MetaTrader 5 için profesyonel bir finansal piyasa göstergesidir ve birden fazla analiz aracını tek bir entegre sistemde birleştirir. Tüm hesaplamaları, özel hacim ağırlıklı ortalama fiyat (VWAP) metodolojisini kullanarak otomatik olarak gerçekleştirir ve subjektif yorumları tamamen ortadan kaldırır. Bu gösterge, tüm varlık sınıflarında (Forex, Hisseler, Endeksler, Emtialar, Kripto Paralar) ve M1’den Aylık’a kadar tüm zaman dilimlerinde çalışır. Temel prensip, fiyatın hacmi taki
Kısa ve öz Bu gösterge, iki uzmanı – RSI ve MACD'yi – tek bir sistemde birleştirir . İki ayrı grafiğe bakıp tahmin yürütmek yerine, kararı sizin için verir: Her iki gösterge de aynı fikirde olduğunda bir ok çizer (al veya sat). En önemlisi: Oklar yeniden çizilmez . Bir kere belirdi mi, olduğu yerde kalır. Backtest yapabilir ve canlı işlemlerinize güvenebilirsiniz. "Combo" ne anlama geliyor? Normalde bir trader, RSI'ye (hareketin gücü) ve MACD'ye (trend yönü) ayrı ayrı bakar. Burada ikisi takım h
Volume Arrow Signal Product Description Volume Arrow Signal is a smart trading indicator designed to help traders identify potential buy and sell opportunities using price action, volume behavior, and directional arrow signals. The indicator places clear arrows directly on the chart, making it easy to spot possible market reversals, trend continuations, and entry opportunities without spending hours analyzing charts manually. Whether you are trading Gold (XAUUSD) , Forex pairs, Indices, or Crypt
MasterTrend
Temirlan Kdyrkhan
MasterTrend Indicator for MT5 A powerful trend-following and signal-evaluation tool MasterTrend   is a custom MT5 indicator that combines Moving Averages and ATR-based risk/reward logic to generate clear buy/sell signals. It visualizes dynamic SL/TP levels, evaluates past trade outcomes, and displays win/loss statistics in a clean on-chart panel. Key features include: Buy/Sell signals based on MA crossovers ATR-based SL/TP1/TP2/TP3 levels with visual lines and labels Signal outcome tracking wit
SMC Sweep Fvg MT5
Daniil Sleptsov
5 (1)
SMC Sweep Fvg MT5 — piyasayı smart money gibi görün, doğrudan grafiğinizde O duyguyu bilirsiniz: fiyat stopunuzu alır, döner ve tam beklediğiniz yöne gider. Yön konusunda haklıydınız. Yanıldığınız tek şey girişti. Bu indikatör, bunun daha az yaşanması için var. Analizin en ağır kısmını — grafiği işaretlemeyi — üstlenir ve asıl önemli olanı size bırakır: kararı. Grafikte ne görürsünüz Piyasa yapısı — HH / HL / LH / LL etiketleri ve seviye çizgileriyle gerçek yapısal tepeler ve dipler. Trend a
The Expert Advisor and the video are attached in the Discussion tab . The robot applies only one order and strictly follows the signals to evaluate the indicator efficiency. Pan PrizMA CD Phase is an option based on the Pan PrizMA indicator. Details (in Russian). Averaging by a quadric-quartic polynomial increases the smoothness of lines, adds momentum and rhythm. Extrapolation by the sinusoid function near a constant allows adjusting the delay or lead of signals. The value of the phase - wave s
Классификатор силы тренда. Показания на истории не меняет. Изменяется классификация только незакрытого бара. По идее подобен полной системе ASCTrend, сигнальный модуль которой, точнее его аппроксимация в несколько "урезанном" виде, есть в свободном доступе, а также в терминале как сигнальный индикатор SilverTrend . Точной копией системы ASCTrend не является. Работает на всех инструментах и всех временных диапазонах. Индикатор использует несколько некоррелируемых между собой алгоритмов для класси
FFx Universal Strength Meter PRO is more than a basic strength meter. Instead of limiting the calculation to price, it can be based on any of the 19 integrated strength modes + 9 timeframes. With the FFx USM, you are able to define any period for any combination of timeframes. For example, you can set the dashboard for the last 10 candles for M15-H1-H4… Full flexibility! Very easy to interpret... It gives a great idea about which currency is weak and which is strong, so you can find the best pai
The FFx Universal MTF alerter shows on a single chart all the timeframes (M1 to Monthly) with their own status for the chosen indicator. 9 indicators mode (MACD-RSI-Stochastic-MA-ADX-Ichimoku-Candles-CCI-PSAR). Each can be applied multiple times on the same chart with different settings. Very easy to interpret. Confirm your BUY entries when most of the timeframes are showing green color. And confirm your SELL entries when most of the timeframes are showing red color. 2 Alert Options : input to s
The FFx Watcher PRO is a dashboard displaying on a single chart the current direction of up to 15 standard indicators and up to 21 timeframes. It has 2 different modes: Watcher mode: Multi Indicators User is able to select up to 15 indicators to be displayed User is able to select up to 21 timeframes to be displayed Watcher mode: Multi Pairs User is able to select any number of pairs/symbols User is able to select up to 21 timeframes to be displayed This mode uses one of the standard indicators
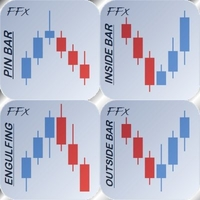
FFx Patterns Alerter gives trade suggestions with Entry, Target 1, Target 2 and StopLoss .... for any of the selected patterns (PinBar, Engulfing, InsideBar, OutsideBar) Below are the different options available: Multiple instances can be applied on the same chart to monitor different patterns Entry suggestion - pips to be added over the break for the entry 3 different options to calculate the SL - by pips, by ATR multiplier or at the pattern High/Low 3 different options to calculate the 2 TPs -
MetaTrader 4 version available here : https://www.mql5.com/en/market/product/24881 FFx Basket Scanner is a global tool scanning all pairs and all timeframes over up to five indicators among the 16 available. You will clearly see which currencies to avoid trading and which ones to focus on. Once a currency goes into an extreme zone (e.g. 20/80%), you can trade the whole basket with great confidence. Another way to use it is to look at two currencies (weak vs strong) to find the best single pairs
MetaTrader 4 version available here: https://www.mql5.com/en/market/product/25793 FFx Pivot SR Suite PRO is a complete suite for support and resistance levels. Support and Resistance are the most used levels in all kinds of trading. Can be used to find reversal trend, to set targets and stop, etc. The indicator is fully flexible directly from the chart 4 periods to choose for the calculation: 4Hours, Daily, Weekly and Monthly 4 formulas to choose for the calculation: Classic, Camarilla, Fibonac
ClassicSBA
Umri Azkia Zulkarnaen
this indicator very simple and easy if you understand and agree with setup and rule basic teknical sba you can cek in link : please cek my youtube channel for detail chanel : an for detail info  contact me  basicly setup buy (long) for this indicator is Magenta- blue and green candle or magenta - green  and green candlestik and for setup sell (short) is Black - yellow - and red candle or black - red  and red candlestik
WanaScalper
Isaac Wanasolo
1 (1)
A scalping indicator based on mathematical patterns, which on average gives signals with relatively small SL, and also occasionally helps to catch big moves in the markets (more information in the video) This indicator has three main types of notifications: The first type warns of a possible/upcoming signal on the next bar The second type indicates the presence of a ready signal to enter the market/open a position The third type is for SL and TP levels - you will be notified every time price re
Recommended TimeFrame >= H1. 100% Non Repainted at any moment.  Use it carefully, only with Trend Direction. Trading Usage: 2 Variants: as Range System or as BreakOut System (Both Only With Trend Direction)::: (Always use StopLoss for minimise Risk); [1] as Range System: (Recommended) in UP TREND:  - BUY in Blue Line , then if price goes down by 50 points (on H1) open Second BUY.   Close in any Profit you wish: TrailingStop(45 points) or Close when Price touches upper Gold Line. in DOWN TREND
Spike Detector
Tete Adate Adjete
this indicator is a Spike detector indicator, it is specially designed to trade Boom 1000, Boom 500, Crash 1000 and Crash 500 We recommend using it on Deriv Boom and Crash indices only Its setting is intuitive, familiar, easy to use it has notification functions; audible notifications and push notifications. this tool is simple to use, easy to handle This update is based on different strategies for spikes
Limitless MT5
Dmitriy Kashevich
Limitless MT5 is a universal indicator suitable for every beginner and experienced trader. works on all currency pairs, cryptocurrencies, raw stocks Limitless MT5 - already configured and does not require additional configuration And now the main thing Why Limitless MT5? 1 complete lack of redrawing 2 two years of testing by the best specialists in trading 3 the accuracy of correct signals exceeds 80% 4 performed well in trading during news releases Trading rules 1 buy signal - the ap
QuantXSTocks Trading Range Indicator for MT5: INSTRUCTIONS TO USE OUR INDICATOR:- User needs to take trade on Arrow or after an Arrow CandleStick, You can achieve up-to 35-125 pips target by this Indicator. Best Timeframes for Stocks and Indices are M30 and H1: AMAZON M30 (50 pips) TESLA M30 (50 pips) APPLE M30 (50 pips) ADOBE M30 (50 pips) NASDAQ100 H1 (125 pips) The above are the approximate amount of pips you can achieve by this Indicator, Green arrow appears to be buy arrow while the Red ar
Trend and Signals MT5  indicator scans  30 trading Instruments (Forex, Metals and Indices).     It uses special algorithm on the  current market   based on   Pure Price Action   and display the overall trend and signal on the dashboard. When signals are produced the indicator sends alert and notification. Strategy for Signals This indicator uses the daily timeframe to determine the direction of the trend. The hourly timeframe is used to identify possible entries. Main trend and is determined by
This indicator is based on a mathematical formula and an ANN combined, designed to make a model(using previous prices) of the most recent market condition (any chart*) in order to use the model as a forecasting tool. *This indicator can operate on any chart/timeframe, but it's suggested you use multiple timeframes for each trade because this method relies solely on the time factor, you can not use this indicator to predict price volatility, but if it's fit correctly it will show you when the nex
This indicator is based on the crossing of two Moving Average with the RSI It is intended for scalpers Specially designed for Boom and Crash syhtetic indices from Binary.com/Deriv.com It is easy to use and intuitive. We recommend its use on M1 and is equipped with three types of notification Email alert Sound notification Push notification these parameters can be activated and deactivated.
IVISTscalp5
Vadym Zhukovskyi
5 (6)
[iVISTscalp5]: Zaman Üzerinden Piyasa Davranışını Araştırma Laboratuvarı TLV Framework | Liquidity Activation Points ⸻ Genel Açıklama iVISTscalp5, VISTmany projesi kapsamında geliştirilen çok katmanlı bir zamanlama ve fiyat yapısı göstergesidir. Sistem, Liquidity Activation Points (timings) aracılığıyla: hareket zamanı yön hareket aralığını tahmin eder. iVISTscalp5 göstergesi, varsayılan parametrelerle herhangi bir finansal enstrümanda kullanılabilir. ⸻ Pratik Değer iVISTsca
Use with JUMP 25. However it can can with the volatility indices as well because it is a modified version. It is advisable to use create a healthy account management. Measure your risk and happy trading. Other experts to be loaded soon. These are modified in order to optimise profits. Ideal candidates are high risk, high returns individuals who hold trades at a maximum of 1 - 2 hours
This indicator is a scalping indicator intended solely for the Boom and Crash indices of the Deriv Limited market It supports Boom 500, Boom 1000, Crash 500 and Crash 1000 Not repaint and no bug The settings are intuitive and easy to use The product activation number is 20 The Time Frame used depends on the user If you are an aggressive scalper then just use M1 For long trades use M15 If you are conservative use M5 Please contact me for more details of its use
EQ Cutrim Theory
Marco Aurelio Santos Costa
Ronal Cutrim has been a dedicated mathematician for 14 years and has more than 10 years of experience in the financial market. The concept of the theory is simple, find imbalance between buyers and sellers. Which makes a lot of sense, because nothing goes up forever, nothing falls forever.   When you find an asset with a mathematical probability of unbalanced equilibrium, it is a great way to get into trading:  TUTORIAL: Turn on the subtitles, the video is subtitled
Aliens dougkang de moviles
Cesar Juan Flores Navarro
Tomamos 5 medios móviles las unimos en una la cual suavizamos y volvemos a suavizar, resultando un mega suavizador de medios móviles suavizadas. Indicador de mql5 funciona en cualquier broker y para todos los tiempos, siendo el mas optimo el de 5, 15 a mas. Funciona mejor en grupo consigo misma osea poner uno de 14 y otro de 50 y 400,, así se observa mejor su desempeño.
Yazarın diğer ürünleri
Genel Bakis KenKem Gold Scalper, MetaTrader 5'te XAUUSD (Altin) scalping icin ozel olarak tasarlanmis bir Expert Advisor'dur. Birden fazla giris stratejisini cok katmanli risk yonetimiyle birlestirerek, siki sermaye koruma protokollerini korurken degisen piyasa kosullarina uyum saglar. EA, her biri farkli piyasa fazlari icin optimize edilmis dort farkli giris stratejisi ile coklu zaman cercevesi analizi yaklasimi kullanir. Tum ticaret kararlari, net giris ve cikis kurallari ile teknik analize da
KenKem - Master Volume Sniper A clean, fully-automated volume-profile breakout strategy - tuned out of the box, with a deliberately small set of controls so you manage risk while the EA handles the strategy. KenKem Master Volume Sniper maps where the market has actually traded - the busy price shelves and the quiet edges - and acts when price breaks decisively out of that structure with the trend behind it. It enters, places a measured stop, optionally banks a partial, moves to break-even, and t
Filtrele:
Değerlendirme yok
Değerlendirmeye yanıt