Cumulative Delta NG

Cumulative delta indicator

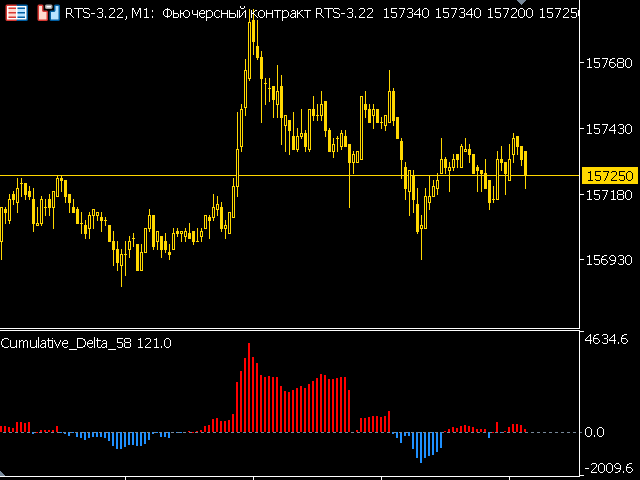
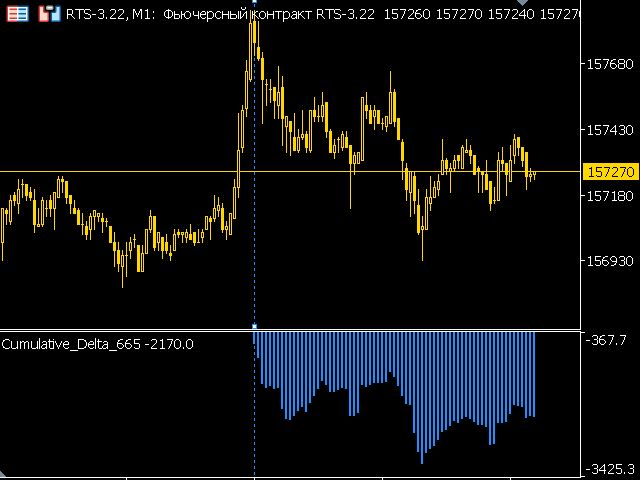
As most traders believe, the price moves under the pressure of market buying or selling. When someone redeems an offer standing in the cup, the deal is a "buy". If someone pours into the bid standing in the cup - the deal goes with the direction of "sale". The delta is the difference between purchases and sales. A cumulative delta - the difference between the cumulative sum of purchases and sales for a certain period of time. It allows you to see who is currently controlling the market. Obviously, the positive delta shows the superiority of active buyers on the market. And vice versa.

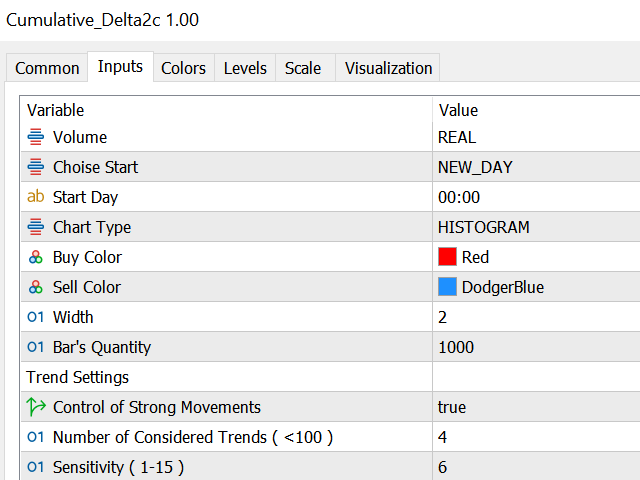
This product is a unique development, because it provides the user with features that are absent in the analogues. For example, selecting the starting point for calculating the cumulative delta. Do you want to see the delta of a certain movement and detect the divergence with the price? You are welcome. Specify the start point at the beginning of the movement and that's it. The second unique feature is the automatic selection of the start. Usually cumulative deltas have a periodization of one day. But we have gone further. The script automatically determines the current market trends and uses them to calculate the delta accumulation start points.

Attention!

  • The indicator will only work if the broker provides tick data (las/volume ticks) with direction flags. You can check the possibility through the test ordering of tick history in the Symbols menu. If you, not having carried out such check, bought the indicator and as a result cannot use it, it is not the reason for return.
  • A delay is allowed when placing the indicator on the chart. It is associated with ordering, receipt of ticks and their subsequent calculation.
  • The indicator placed on the chart will not be displayed when MT5 is turned on when the market is not working, because there is no broadcasting of ticks. To display the indicator, you need to change any parameter once/twice through the settings. For example, increase the Bar's Quantity parameter by one.


Önerilen ürünler
CosmiCLab SMC FIBO CosmiCLab SMC FIBO is a professional trading indicator designed for traders who use Smart Money Concepts (SMC), market structure analysis and Fibonacci retracement levels. The indicator automatically detects market swings and builds Fibonacci levels based on the latest impulse movement. It also identifies market structure changes such as BOS (Break of Structure) and CHOCH (Change of Character), helping traders understand the current market direction. CosmiCLab SMC FIBO also pr
Trade smarter, not harder: Empower your trading with Harmonacci Patterns This is arguably the most complete harmonic price formation auto-recognition indicator you can find for the MetaTrader Platform. It detects 19 different patterns, takes fibonacci projections as seriously as you do, displays the Potential Reversal Zone (PRZ) and finds suitable stop-loss and take-profit levels. [ Installation Guide | Update Guide | Troubleshooting | FAQ | All Products   |  Get Help ] It detects 19 differen
L'indicatore SMC Venom Model BPR è uno strumento professionale per i trader che operano nell'ambito del concetto di Smart Money (SMC). Identifica automaticamente due modelli chiave sul grafico dei prezzi: FVG   (Fair Value Gap) è una combinazione di tre candele, in cui c'è un gap tra la prima e la terza candela. Forma una zona tra livelli in cui non c'è supporto di volume, il che spesso porta a una correzione dei prezzi. BPR   (Balanced Price Range) è una combinazione di due modelli FVG che for
Volume Profile V6
Andrey Kolesnik
4.67 (3)
Piyasa Hacim Profili Göstergesi + Akıllı Osilatör. Döviz çiftleri, hisse senetleri, vadeli işlemler, kripto paralar gibi hemen hemen tüm enstrümanlarda hem gerçek hacimler hem de tick hacimleri üzerinde çalışır. Profil oluşturma aralığını otomatik olarak (örneğin bir haftalık veya bir aylık vb.) belirleyebileceğiniz gibi, sınırları (kırmızı ve mavi iki dikey çizgi) hareket ettirerek aralığı manuel olarak da ayarlayabilirsiniz. Histogram şeklinde görüntülenir. Belirli bir seviyedeki histogram gen
Was: $249  Now: $99   Market Profile defines a number of day types that can help the trader to determine market behaviour. A key feature is the Value Area, representing the range of price action where 70% of trading took place. Understanding the Value Area can give traders valuable insight into market direction and establish the higher odds trade. It is an excellent addition to any system you may be using. Inspired by Jim Dalton’s book “Mind Over Markets”, this indicator is designed to suit the
Overview Harmonic Patterns MT5 is a technical analysis indicator designed for the MetaTrader 5 platform. It identifies and displays harmonic price patterns, such as Butterfly, Cypher, Crab, Bat, Shark, and Gartley, in both bullish and bearish directions. The indicator calculates key price levels, including entry, stop loss, and three take-profit levels, to assist traders in analyzing market movements. Visual elements and customizable alerts enhance usability on the chart. Features Detects six ha
RBreaker
Zhong Long Wu
RBreaker Gold Indicators is a short-term intraday trading strategy for gold futures that combines trend following and intraday reversal approaches. It not only captures profits during trending markets but also enables timely profit-taking and counter-trend trading during market reversals. This strategy has been ranked among the top ten most profitable trading strategies by the American magazine   Futures Truth   for 15 consecutive years. It boasts a long lifecycle and remains widely used and st
Premium seviye, %80'den fazla doğru tahmin doğruluğuna sahip benzersiz bir göstergedir! Bu gösterge en iyi Ticaret Uzmanları tarafından iki aydan uzun süredir test edilmiştir! Yazarın göstergesini başka hiçbir yerde bulamazsınız! Ekran görüntülerinden bu aracın doğruluğunu kendiniz görebilirsiniz! 1, sona erme süresi 1 mum olan ikili opsiyon ticareti için harikadır. 2 tüm döviz çiftleri, hisse senetleri, emtialar, kripto para birimleri üzerinde çalışır Talimatlar: Kırmızı ok göründüğü an
Noize Absorption Index - is the manual trading system that measures the difference of pressure between bears forces and bulls forces. Green line - is a noize free index that showing curent situation. Zero value of index shows totally choppy/flat market.Values above zero level shows how powerfull bullish wave is and values below zero measures bearish forces.Up arrow appears on bearish market when it's ready to reverse, dn arrow appears on weak bullish market, as a result of reverse expectation.
WaveTrend Oscillator MT5 güçlü bir ticaret göstergesidir ve momentum değişimlerini ve potansiyel trend dönüşlerini belirleyerek piyasa analizinizi geliştirmek için tasarlanmıştır. Her seviyeden trader için ideal olan bu araç, forex, kripto paralar ve emtialar dahil olmak üzere çeşitli piyasalarda aşırı alım ve aşırı satım koşulları hakkında değerli bilgiler sunar. Doğru alım ve satım sinyalleri üretebilme yeteneği ile WaveTrend Oscillator MT5, trader'ların bilinçli kararlar almasını sağlar ve he
Öncelikle, bu Ticaret Aracının Non-Repainting, Non-Redrawing ve Non-Lagging Gösterge olduğunu vurgulamakta fayda var, bu da onu profesyonel ticaret için ideal hale getiriyor. Çevrimiçi kurs, kullanıcı kılavuzu ve demo. Akıllı Fiyat Hareketi Kavramları Göstergesi, hem yeni hem de deneyimli tüccarlar için çok güçlü bir araçtır. İleri ticaret fikirlerini, Inner Circle Trader Analizi ve Smart Money Concepts Ticaret Stratejileri gibi 20'den fazla kullanışlı göstergeyi bir araya getirerek bir araya
Unlock key market insights with automated support and resistance lines Tired of plotting support and resistance lines? This is a multi-timeframe indicator that detects and plots supports and resistance lines in the chart with the same precision as a human eye would. As price levels are tested over time and its importance increases, the lines become thicker and darker, making price leves easy to glance and evaluate. [ Installation Guide | Update Guide | Troubleshooting | FAQ | All Products  | 
An indicator of pattern #31 ("Long Island") from Encyclopedia of Chart Patterns by Thomas N. Bulkowski. The second gap is in the opposite direction. Parameters: Alerts - show alert when an arrow appears   Push - send a push notification when an arrow appears (requires configuration in the terminal) GapSize - minimum gap size in points ArrowType - a symbol from 1 to 17 ArrowVShift - vertical shift of arrows in points   ShowLevels - show levels ColUp - color of an upward line ColDn - color of a d
# DRAWDOWN INDICATOR V4.0 - The Essential Tool to Master Your Trading ## Transform Your Trading with a Complete Real-Time Performance Overview In the demanding world of Forex and CFD trading, **knowing your real-time performance** isn't a luxury—it's an **absolute necessity**. The **Drawdown Indicator V4.0** is much more than a simple indicator: it's your **professional dashboard** that gives you a clear, precise, and instant view of your trading account status. --- ## Why This Indicator
Price Magnet — Price Density and Attraction Levels Indicator Price Magnet is a professional analytical tool designed to identify key support and resistance levels based on statistical Price Density. The indicator analyzes a specified historical period and detects price levels where the market spent the most time. These zones act as “magnets,” attracting price action or forming a structural base for potential reversals. Unlike traditional Volume Profile tools, Price Magnet focuses on price-time d
Laguerre SuperTrend Clouds   adds an Adaptive Laguerre averaging algorithm and alerts to the widely popular SuperTrend indicator. As the name suggests,   Laguerre SuperTrend Clouds (LSC)   is a trending indicator which works best in trendy (not choppy) markets. The SuperTrend is an extremely popular indicator for intraday and daily trading, and can be used on any timeframe. Incorporating Laguerre's equation to this can facilitate more robust trend detection and smoother filters. The LSC uses the
TRI Visualizer
Yoshimi Mon 三 Ura
TRI Visualizer MT5 – Thermodynamic Market Analysis Overview The TRI (Thermal Range Indicator) Visualizer Enhanced is a rare market analysis indicator that goes beyond conventional technical analysis, applying principles of thermodynamics from physics. It interprets market price fluctuations as “thermodynamic energy,” enabling the highly accurate detection of subtle market changes that are often overlooked. Innovative Mechanisms 1. Dual Calculation Engines Classic TRI Mode Formula: |Close
Rainbow EA MT5
Jamal El Alama
Description : Rainbow EA MT5 is a simple Expert advisor based on   Rainbow MT5 indicator witch is based on Moving average with period 34. The indicator is incorporated in the EA, therefore, it is not required for the EA to operate, but if you wish, you can download it from   my product page . The Expert Advisor settings are as follows : Suitable for Timeframes up to H1 The parameters below can be set according to your trading rules. StopLoss ( Stop Loss in pips) TakeProfit ( Take Profit in pips
"Impulses and Corrections 5" is created to help traders navigate the market situation. The indicator shows multi-time frame upward and downward "Impulses" of price movements. These impulses are the basis for determining the "Base" , which is composed of zones of corrections of price movements, as well as "Potential" zones for possible scenarios of price movement. Up and down impulses are determined based on a modified formula of Bill Williams' "Fractals" indicator. The last impulse is always "U
The Trend Duration Forecast MT5 indicator is designed to estimate the probable lifespan of a bullish or bearish trend. Using a Hull Moving Average (HMA) to detect directional shifts, it tracks the duration of each historical trend and calculates an average to forecast how long the current trend is statistically likely to continue. This allows traders to visualize both real-time trend strength and potential exhaustion zones with exceptional clarity. KEY FEATURES Dynamic Trend Detection:   Utiliz
Crash 1000 Scalping Indicator for the Crash 1000 Deriv Synthetic Index. Introduction The Crash 1000 Scalping Indicator is a specialized tool designed for the Crash 1000 index on the Deriv Synthetic market. This indicator is particularly useful for scalping on the M1 timeframe, helping traders to identify precise entry and exit points for buy positions. It is designed to be non-repainting, providing clear signals with audible alerts and push notifications, and is compatible with mobile devices th
**   All Symbols   x   All Timeframes   scan just by pressing scanner button ** Discount: The price is $50$, But now it is just $39, Limited time offer is active. *** Contact me  to send you instruction and add you in "Trend Reversal group" for sharing or seeing experiences with other users. Introduction: Trendlines are the most famous technical analysis in trading . Trendlines continually form on the charts of markets across all the different timeframes providing huge opportunities for traders
Advanced Volume Profile Analysis Tool for MetaTrader 5 The Kecia Volume Profile Order Finder provides traders with volume profile analysis capabilities. This MT5 indicator combines volume profile visualization with statistical calculations to help identify potential trading opportunities and suggests entry, stop loss, and take profit levels based on market structure. Market Profile Visualization Transform your chart with customizable volume profile visualizations: Multiple visualization options
Max Min Delta Indicator - Market Volume Imbalance Analysis Gain Deeper Insights into Market Volume Imbalance with Delta Analysis What is the Max Min Delta Indicator? The Max Min Delta Indicator is a powerful market volume analysis tool that visually represents maximum and minimum delta values using a histogram. It helps traders identify market strength, weakness, absorption, and aggressive buying/selling activity with precision. Key Features Histogram Visualization: Displays Max Delta (Green) an
##   ONLY GOLD ##   Тiльки Золото ## **Mercaria Professional Trading Zones - Complete Guide** ## **Mercaria Professional Trading Zones - Повний посібник** ### **How Mercaria Zones Work / Як працюють зони Mercaria** **English:** Mercaria Zones is an advanced trading indicator that identifies high-probability support and resistance areas using ZigZag extremes combined with mathematical zone calculations. The indicator works on multiple timeframes simultaneously, providing a comprehensive view
Fibo Channels
Jeffrey Quiatchon
Fibo Daily Channel Indicator The  Indicator is a powerful tool for traders, providing precise daily support and resistance levels based on Fibonacci retracement and extension calculations. This indicator automatically draws key pivot points (PP, R1, R2, S1, S2) as well as additional extension levels (R3, R4, S3, S4), helping traders identify potential reversal and breakout zones with ease. It includes customizable alerts and push notifications, allowing traders to receive updates whenever the pr
Prime Power ML , sinyalleri görüntülemeden önce kazanma olasılığına göre filtreleyen iki ONNX sinir ağı modeli ile geliştirilmiş gelişmiş bir Currency Strength Meter'dır. Dövizler arasındaki her ayrışmayı gösteren geleneksel CSM göstergelerinin aksine, Prime Power ML yalnızca AI'nin istatistiksel bir avantaj onayladığı sinyalleri öne çıkarır. Nasıl çalışır Gösterge, tüm 28 döviz çifti üzerinde RSI skorlaması kullanarak 8 ana dövizin (USD, EUR, GBP, JPY, AUD, CAD, CHF, NZD) gerçek zamanlı gücünü
PrimeTrend ML , XAUUSD (Altın) M15 zaman dilimi için özel olarak geliştirilmiş, tescilli çoklu zaman dilimi trend belirleme algoritması ile iki özel ONNX makine öğrenimi modelini (biri alış, diğeri satış kurulumları için) birleştiren bir sinyal göstergesidir. Temel Mantık Çoğu gösterge her barda sinyal verir. PrimeTrend ML farklı çalışır. Dahili trend motoru, önce dört farklı zaman diliminde piyasa yönündeki yapısal kaymayı eşzamanlı olarak tanımlar. Yalnızca bu çoklu zaman dilimi onayı sağlandı
Auto Optimized RSI , doğru alım ve satım sinyalleri vermek için tasarlanmış, kullanımı kolay ve akıllı bir ok göstergesidir. Geçmiş verilere dayalı işlem simülasyonları kullanarak, her enstrüman ve zaman dilimi için en etkili RSI seviyelerini otomatik olarak belirler. Bu gösterge, bağımsız bir işlem sistemi olarak veya mevcut stratejinize entegre edilerek kullanılabilir ve özellikle kısa vadeli işlem yapanlar için faydalıdır. Geleneksel RSI’nin sabit seviyeleri (örneğin 70/30) yerine,   Auto Opt
The Super Arrow Indicator provides non-repainting buy and sell signals with exceptional accuracy. Key Features No repainting – confirmed signals remain fixed Clear visual arrows: green for buy, red for sell Real-time alerts via pop-up, sound, and optional email Clean chart view with no unnecessary clutter Works on all markets: Forex, gold, oil, indices, crypto Adjustable Parameters TimeFrame Default:   "current time frame" Function:   Sets the time frame for indicator calculation Options:   Can
Bu ürünün alıcıları ayrıca şunları da satın alıyor
ARIPoint
Temirlan Kdyrkhan
ARIPoint is a powerful trading companion designed to generate high-probability entry signals with dynamic TP/SL/DP levels based on volatility. Built-in performance tracking shows win/loss stats, PP1/PP2 hits, and success rates all updated live. Key Features: Buy/Sell signals with adaptive volatility bands Real-time TP/SL/DP levels based on ATR Built-in MA Filter with optional ATR/StdDev volatility Performance stats panel (Success, Profit/Loss, PP1/PP2) Alerts via popup, sound, push, or email Cu
SuperScalp Pro
Van Minh Nguyen
4.57 (21)
SuperScalp Pro – Gelişmiş Çoklu Filtre Scalping Gösterge Sistemi SuperScalp Pro, işlem fırsatlarını belirlemeye yardımcı olmak için klasik Supertrend ile birden fazla akıllı onay filtresini birleştiren gelişmiş bir scalping göstergesidir. M1’den H4’e kadar farklı zaman dilimlerinde verimli şekilde çalışır ve XAUUSD, BTCUSD ile majör Forex pariteleri için optimize edilmiştir. Gösterge, net Al ve Sat sinyalleri sunar ve ATR tabanlı otomatik giriş fiyatı, stop loss ve take profit seviyeleri hesapla
Divergence Bomber
Ihor Otkydach
4.9 (87)
Bu göstergeyi satın alan herkese aşağıdaki ekstra içerikler ücretsiz olarak sunulmaktadır: Her işlemi otomatik olarak yöneten, Stop Loss ve Take Profit seviyelerini ayarlayan ve işlemleri strateji kurallarına göre kapatan özel yardımcı araç: "Bomber Utility" Göstergenin farklı varlıklar üzerinde kullanılmasına yönelik ayar dosyaları (set dosyaları) Bomber Utility için 3 farklı modda kullanım sunan ayar dosyaları: "Minimum Risk", "Dengeli Risk" ve "Bekle-Gör Stratejisi" Bu ticaret stratejisini hı
Entry In The Zone and SMC Multi Timeframe is a real-time 2-in-1 market analysis tool that combines market structure analysis and a No Repaint BUY / SELL signal system into a single indicator, built on Smart Money Concepts (SMC) — a widely adopted framework used by professional traders to understand market structure. This indicator helps you see the market more clearly, make decisions based on structure rather than guesswork, and focus on high-probability zones where price is more likely to react
Power Candles MT5
Daniel Stein
4.75 (8)
Power Candles V3 - İlk Kendi Kendini Optimize Eden Güç Göstergesi Power Candles V3 , güç analizini doğrudan işlem yapılabilir bir sisteme dönüştürür. Gösterge artık grafiğinizi yalnızca piyasa gücüne göre renklendirmekle kalmaz; arka planda canlı bir otomatik optimizasyon çalıştırır ve sembolünüz için en iyi Stop Loss, Take Profit ve sinyal eşiğini size sunar. Tek tıklama ile bu ayar canlı işlem için devreye girer. Bu araç Stein Investments ekosisteminin bir parçasıdır.  18 aracın tümünü keşfed
Grabber System MT5
Ihor Otkydach
4.83 (23)
Size mükemmel bir teknik gösterge olan Grabber’ı tanıtıyorum. Bu araç, kullanıma hazır bir “her şey dahil” işlem stratejisi olarak çalışır. Tek bir yazılım kodu içinde güçlü piyasa teknik analiz araçları, işlem sinyalleri (oklar), uyarı işlevleri ve push bildirimleri entegre edilmiştir. Bu göstergeyi satın alan herkes aşağıdaki hediyeleri ücretsiz olarak alır: Açık emirleri otomatik yönetmek için Grabber Yardımcı Aracı Kurulum, yapılandırma ve nasıl işlem yapılacağını adım adım anlatan video kıl
Bu indikatörü satın alırsanız, Profesyonel Trade Manager’ımı  + EA ÜCRETSİZ olarak alacaksınız. Öncelikle, bu Ticaret Sistemi'nin Non-Repainting, Non-Redrawing ve Non-Lagging Göstergesi olduğunu vurgulamak önemlidir, bu da hem manuel hem de robot ticareti için ideal hale getirir. Online kurs, kılavuz ve ön ayarları indir. "Smart Trend Trading System MT5", yeni ve deneyimli tüccarlar için özelleştirilmiş kapsamlı bir ticaret çözümüdür. 10'dan fazla premium göstergeyi birleştiriyor ve 7'den fazla
Quantum TrendPulse
Bogdan Ion Puscasu
5 (23)
SuperTrend   ,   RSI   ve   Stochastic'in   gücünü tek bir kapsamlı göstergede birleştirerek işlem potansiyelinizi en üst düzeye çıkaran nihai işlem aracı olan   Quantum TrendPulse'u   tanıtıyoruz. Hassasiyet ve verimlilik arayan yatırımcılar için tasarlanan bu gösterge, piyasa trendlerini, momentum değişimlerini ve en uygun giriş ve çıkış noktalarını güvenle belirlemenize yardımcı olur. Temel Özellikler: SuperTrend Entegrasyonu:   Güncel piyasa trendlerini kolayca takip edin ve karlılık dalgası
Azimuth Pro
Ottaviano De Cicco
5 (7)
Azimuth Pro V2: Synthetic Fractal Structure and Confirmed Entries for MT5 Overview Azimuth Pro is a multi-level swing structure indicator by Merkava Labs . Four nested swing layers, swing-anchored VWAP, ABC pattern detection, three-timeframe structural filtering, and closed-bar confirmed entries — one chart, one workflow from micro-swings to macro-cycles. This is not a blind signal product. It is a structure-first workflow for traders who care about location, context, and timing. V2 Launch Offe
FX Trend MT5 NG
Daniel Stein
5 (4)
FX Trend NG: Yeni Nesil Çoklu Piyasa Trend Zekâsı Genel Bakış FX Trend NG , çoklu zaman dilimlerinde çalışan profesyonel bir trend analiz ve piyasa izleme aracıdır. Piyasanın yapısını saniyeler içinde anlamanızı sağlar. Birden fazla grafik arasında geçiş yapmak yerine, hangi enstrümanların trendde olduğunu, momentumun nerede zayıfladığını ve hangi zaman dilimlerinin uyumlu olduğunu anında görebilirsiniz. Lansman Teklifi – FX Trend NG sadece $30 (6 Ay) veya $80 Ömür Boyu Lisans ile edinin. Zate
SignalTech MT5 is a trading system for EURUSD, USDCHF, USDJPY, AUDUSD, NZDUSD, EURJPY, AUDJPY, NZDJPY, CADJPY H2 and H3 Timeframe.  It can generate signals with Buy/Sell Arrows and Pop-Up/Sound Alerts. Each signal has clear Entry and Stop Loss levels, which should be automatically flagged on the chart, as well as potential Targets 1, 2, and 3. The Entry and TP levels are fixed after the trade is taken. The exit level is dynamic. If there are signs of a potential short-term trend reversal, the
Gann Made Easy , bay teorisini kullanarak ticaretin en iyi ilkelerine dayanan, profesyonel ve kullanımı kolay bir Forex ticaret sistemidir. WD Gann. Gösterge, Zararı Durdur ve Kâr Al Seviyeleri dahil olmak üzere doğru SATIN AL ve SAT sinyalleri sağlar. PUSH bildirimlerini kullanarak hareket halindeyken bile işlem yapabilirsiniz. Satın alma işleminden sonra, alım satım talimatlarını ve harika ek göstergeleri ücretsiz olarak almak için lütfen benimle iletişime geçin! Muhtemelen Gann ticaret yöntem
Meravith MT5
Ivan Stefanov
5 (1)
Göstergе, herhangi bir noktadan hacmi analiz eder ve bu hacim için piyasanın tükeniş seviyelerini hesaplar. Meravith’in ana çizgileri: Boğa hacim tükeniş çizgisi – hedef olarak kullanılır. Ayı hacim tükeniş çizgisi – hedef olarak kullanılır. Trend çizgisi – piyasa trendini gösterir. Piyasanın boğa mı ayı mı olduğuna bağlı olarak rengi değişir ve trend desteği görevi görür. Nasıl kullanılır: Mor dikey çizgiye çift tıklayın ve istediğiniz konuma taşıyın. Her şeyi analiz edebilirsiniz – trendleri v
Atomic Analyst MT5
Issam Kassas
3.94 (31)
Öncelikle belirtmek gerekir ki bu Ticaret Göstergesi Yeniden Çizim Yapmaz, Gecikmez ve Gecikme Göstermez, bu da hem manuel hem de robot ticareti için ideal hale getirir. Kullanıcı kılavuzu: ayarlar, girişler ve strateji. Atom Analisti, Piyasada Daha İyi Bir Avantaj Bulmak İçin Fiyatın Gücünü ve Momentumunu Kullanan PA Fiyat Hareketi Göstergesidir. Gürültüleri ve Yanlış Sinyalleri Kaldırmaya ve Ticaret Potansiyelini Artırmaya Yardımcı Olan Gelişmiş Filtrelerle Donatılmıştır. Birden fazla katmanl
Bill Williams Advanced
Siarhei Vashchylka
5 (11)
Bill Williams Advanced is designed for automatic chart analysis using Bill Williams' "Profitunity" system. The indicator analyzes four timeframes at once. Manual (Be sure to read before purchasing) Advantages 1. Analyzes the chart using Bill Williams' "Profitunity" system. Signals are displayed in a table in the corner of the screen and on the price chart. 2. Finds all known AO and AC signals, as well as zone signals. Equipped with a trend filter based on the Alligator. 3. Finds "Divergence Bar
Trend Screener Pro MT5
STE S.S.COMPANY
4.85 (104)
Trend Göstergesi, Trend Alım Satım ve Filtreleme için Çığır Açan Benzersiz Çözüm, Tüm Önemli Trend Özellikleriyle Tek Bir Araç İçinde Yerleştirildi! Forex, emtialar, kripto para birimleri, endeksler ve hisse senetleri gibi tüm sembollerde/araçlarda kullanılabilen %100 yeniden boyamayan çoklu zaman çerçevesi ve Çoklu para birimi göstergesidir. Trend Screener, grafikte noktalarla ok trend sinyalleri sağlayan etkili bir trend trend göstergesidir. Trend analizörü göstergesinde bulunan özellikler: 1.
Top indicator for MT5   providing accurate signals to enter a trade without repainting! It can be applied to any financial assets:   forex, cryptocurrencies, metals, stocks, indices .  Watch  the video  (6:22) with an example of processing only one signal that paid off the indicator! MT4 version is here It will provide pretty accurate trading signals and tell you when it's best to open a trade and close it. Most traders improve their trading results during the first trading week with the help of
Tanıtım       Quantum Breakout PRO   , Breakout Bölgeleri ile ticaret yapma şeklinizi değiştiren çığır açan MQL5 Göstergesi! 13 yılı aşkın ticaret tecrübesine sahip deneyimli tüccarlardan oluşan bir ekip tarafından geliştirilmiştir.       Kuantum Breakout PRO       yenilikçi ve dinamik koparma bölgesi stratejisiyle ticaret yolculuğunuzu yeni zirvelere taşımak için tasarlanmıştır. Kuantum Breakout Göstergesi, size 5 kar hedefi bölgesi ile kırılma bölgelerinde sinyal okları ve kırılma kutusuna da
Btmm state engine pro
Garry James Goodchild
5 (4)
BTMM State Engine Pro is a MetaTrader 5 indicator for traders who use the Beat The Market Maker approach: Asian session context, kill zone timing, level progression, peak formation detection, and a multi-pair scanner from a single chart. It combines cycle state logic with a built-in scanner dashboard so you do not need the same tool on many charts at once. What it does Draws the Asian session range; session times can follow broker server offset or be set in inputs. Tracks level progression (L
OmniSync Projection
Antonio-alin Teculescu
5 (1)
Chronos Fractal Engine is an innovative price projection indicator for MetaTrader 5, designed to transform your technical analysis by intelligently identifying and projecting historical price patterns. Built upon an advanced correlation algorithm and the fractal principles of the market, this powerful tool visualizes potential future price movements, giving you a unique edge in your trading decisions. What is Chronos Fractal Engine? At its core, the Chronos Fractal Engine employs a sophisticat
FX Power MT5 NG
Daniel Stein
5 (31)
FX Power: Daha Akıllı Ticaret Kararları için Para Birimlerinin Gücünü Analiz Edin Genel Bakış FX Power , her piyasa koşulunda başlıca para birimlerinin ve altının gerçek gücünü anlamak için vazgeçilmez bir araçtır. Güçlü para birimlerini alıp zayıf olanları satarak, FX Power ticaret kararlarınızı basitleştirir ve yüksek olasılıklı fırsatları ortaya çıkarır. İster trendlere sadık kalın ister Delta'nın aşırı değerlerini kullanarak tersine dönüşleri öngörün, bu araç ticaret tarzınıza mükemmel bir
Hangi stratejinin sizin sembolunuzde gercekten calistigini gorun - gercek paranizi riske atmadan once. Power Bar, herhangi bir sembol ve herhangi bir zaman diliminde asiri fiyat barlarini tespit eder, ardindan 3 farkli islem stratejisini aninda geriye donuk test eder. Boylece kazanma oranlarini, kar faktorlerini ve P&L'yi yan yana karsilastirabilirsiniz. Tek bir interaktif panelde. Tahmin yok. Esriye uydurma yok. Sadece veri. Power Bar'i benzersiz yapan nedir? Cogu indikator size bir sinyal ver
Berma Bands
Muhammad Elbermawi
5 (8)
Berma Bantları (BB'ler) göstergesi, piyasa trendlerini belirlemeyi ve bunlardan yararlanmayı amaçlayan yatırımcılar için değerli bir araçtır. Fiyat ile BB'ler arasındaki ilişkiyi analiz ederek, yatırımcılar bir piyasanın trend veya aralıklı fazda olup olmadığını ayırt edebilir. Daha fazla bilgi edinmek için [ Berma Home Blog ] adresini ziyaret edin. Berma Bantları üç belirgin çizgiden oluşur: Üst Berma Bandı, Orta Berma Bandı ve Alt Berma Bandı. Bu çizgiler fiyatın etrafına çizilir ve genel tren
Crystal Heikin Ashi Signals
Muhammad Jawad Shabir
5 (2)
Crystal Heikin Ashi Signals - Professional Trend & Signal Detection Indicator Advanced Heikin Ashi Visualization with Intelligent Signal System for Manual & Automated Trading Final Price: $149 ---------> Price goes up $10 after every 10 sales . Limited slots available — act fast . Overview Crystal Heikin Ashi Signals is a professional-grade MetaTrader 5 indicator that combines pure Heikin Ashi candle visualization with an advanced momentum-shift detection system. Designed for both manual traders
Gartley Hunter Multi
Siarhei Vashchylka
5 (11)
Gartley Hunter Multi - An indicator for searching for harmonic patterns simultaneously on dozens of trading instruments and on all possible timeframes. Manual (Be sure to read before purchasing) | Version for MT4 Advantages 1. Patterns: Gartley, Butterfly, Shark, Crab. Bat, Alternate Bat, Deep Crab, Cypher 2. Simultaneous search for patterns on dozens of trading instruments and on all possible timeframes 3. Search for patterns of all possible sizes. From the smallest to the largest 4. All fou
META Puanları PRO   — Piyasa hareketlerini takip eden ve alım satım işlemlerinde tahmini ortadan kaldıran, piyasanın kararını çoktan vermiş olduğu noktaları gösteren bir araçtır. Bu gösterge, trendlerin, eğilimlerin ve yapıların değiştiği kilit noktaları belirler ve fiyatın büyük oyuncuların pozisyon alması için geri döndüğü alanları vurgular. Sadece hareketi görmüyorsunuz, arkasındaki mantığı da anlıyorsunuz. Tüm sinyaller mum çubuğu kapandıktan sonra kaydedilir, yeniden çizilmez ve grafiğe kay
" Dynamic Scalper System MT5 " göstergesi, trend dalgaları içinde işlem yapmak için scalping yöntemi için tasarlanmıştır. Başlıca döviz çiftleri ve altın üzerinde test edilmiştir, diğer işlem araçlarıyla uyumluluğu mümkündür. Ek fiyat hareketi desteğiyle trend boyunca pozisyonların kısa vadeli açılması için sinyaller sağlar. Göstergenin prensibi. Büyük oklar trend yönünü belirler. Küçük oklar şeklinde scalping için sinyaller üreten bir algoritma trend dalgaları içinde çalışır. Kırmızı oklar yü
Meridian Pro
Ottaviano De Cicco
5 (1)
Meridian Pro: Professional Multi-Timeframe Trend Matrix for MT5 Overview Meridian Pro is a multi-timeframe trend matrix by Merkava Labs that compresses directional state, strength, momentum condition and matrix agreement into one compact panel. One adaptive engine, applied consistently from M1 to W1. No per-symbol tuning. No indicator stacking. One structured readout across every asset and every timeframe. Launch Offer — Get Meridian Pro for USD 99 (introductory). Regular price: USD 149. 1. Why
Trend indicator AI mt5
Ramil Minniakhmetov
5 (17)
Trend Ai göstergesi, trend tanımlamasını işlem yapılabilir giriş noktaları ve geri dönüş uyarılarıyla birleştirerek bir yatırımcının piyasa analizini geliştirecek harika bir araçtır. Bu gösterge, kullanıcıların forex piyasasının karmaşıklıklarında güvenle ve hassasiyetle yol almalarını sağlar. Birincil sinyallerin ötesinde, Trend Ai göstergesi geri çekilmeler veya düzeltmeler sırasında ortaya çıkan ikincil giriş noktalarını belirleyerek, yatırımcıların belirlenen trend içindeki fiyat düzeltmele
Auto Optimized Parabolic RSI: Gelişmiş 3D Momentum Motoru Çoğu perakende indikatörü, piyasa volatilitesi değiştiği an çöken statik girdilere dayandığı için başarısız olur. Auto Optimized Parabolic RSI, kendi matematiksel avantajını sürekli olarak yeniden hesaplayarak "indikatör körelmesi" (indicator decay) sorununu çözer ve kurumsal düzeyde kantitatif adaptasyonu doğrudan MT5 terminalinize getirir. Temel Avantaj: Özel Bellek İçi (In-Memory) 3D Optimizasyon Standart otomatik optimize ediciler, te
Yazarın diğer ürünleri
RENKO Reversal
Anton Polkovnikov
5 (3)
RENKO Reversal by StockGamblers Actually working RENKO in MT5. Uses "custom symbols" for drawing. You can apply any indicators with complete peace of mind. The movement of the last price is displayed in real during the formation of the "brick". Put the script in the MQL5/Experts folder. More precisely: C:\Users\user\AppData\Roaming\MetaQuotes\Terminal\terminal_number\MQL5\Experts Settings: ValuePerBar - height of the "brick" in points revCandle - multiplier for the height of the turning "brick".
FREE
The script removes all of the indicators on the chart with one movement of the hand. There are situations when there are too many indicators on the chart. And it is required to delete all of them without closing the tab. Unfortunately, the settings window doesn't allow us to select all indicators at once and we have to delete one by one. This script will solve this problem. Simply drag the script   from Navigator window onto the chart.
FREE
Anchored VWAP (with no Volume) A unique development of one of the most useful VWAP indicators. This product allows you to get away from using the basics of VWAP, namely the volume. Everything is calculated without it. In addition, a convenient system for selecting starting points has been developed - by moving the "starting field" you indicate to the script the area, in which the extremum, from which the calculation will start, should be searched for. The main advantages of this development: con
TrendMeasurer indicator manual / TMi manual The indicator is designed to help the user to find the end point of a strong trending price movement. Important - END. Not start. How the indicator works The first price impulse and its subsequent pullback form a certain "critical mass" which acts as "fuel" for further price movement. The production of this fuel indicates the potential end of the trend. Both volume and indicator calculated in a certain way from price data can be the fuel. The amount of
TrendMeasurer indicator / TMi The indicator is designed to help the user to find the end point of a strong trending price movement. Important - END. Not start. How the indicator works The first price impulse and its subsequent pullback form a certain "critical mass" which acts as "fuel" for further price movement. The production of this fuel indicates the potential end of the trend. Both volume and indicator calculated in a certain way from price data can be the fuel. The amount of "fuel" can be
VWAP Daily
Anton Polkovnikov
Weighted average price indicator or VWAP. The well-known standard VWAP with the beginning of the day is added with the function of selecting the periodization. It can be calculated both every day and on other periods. Also the indicator allows to exclude the volume from the calculation, which will allow using it on the cryptocurrencies and forex. There is an alert for a VWAP price crossing. There are 1 and 2 standard deviation. Settings: Volume: turning volume on and off in the calculation mecha
A huge number of traders use the VolumeProfile/MarketProfile analysis method. And I think there is no need to explain such concepts as POC and VAH/VAL. However, the standard VolumeProfile representation has a drawback - we only see the current picture of the market. We see the "convexity" of the volume distribution within the period. But we don't see the main thing - the "migration" of the POC level during the price movement. Our indicator is unique. It is dynamic. The first feature is that the
Non-lagging VOLATILITY indicator A radical modification of the ATR indicator, which corrected all of its shortcomings (the picture shows the difference with ATR). The indicator shows the swing size of the current market movement. Features: does not have a time window period, i.e. any subjective settings non-delayed, the extremums of the indicator always coincide with the extremum of the price (note the picture) is normalized by means of a color solution, i.e. it has the properties of an oscillat
MultiVWAP
Anton Polkovnikov
MultiVWAP A radical reworking of the well-known VWAP, which is in fact a completely new unique tool. It gives you the opportunity to put 5 types of different VWAPs on the chart: Volume - standard VWAP calculated based on volume No volume - no volume in calculations, which allows using the indicator on the charts, for which the broker does not supply volumetric data Volatility - new development, the calculation is based on unsteady volatility Buyer - VWAP calculation is based on current market bu
Seconds time frame In MT5 there are no second charts by default. Many of the presented options for creating such do not work fully - errors with extrema, inability to use indicators, etc. I present you a fully working variant. The script works as an Expert Advisor by creating a custom symbol. To work, the script is placed on the M1 chart of the instrument of interest, after which the window of the custom symbol will open automatically. The settings are minimal and intuitive - the timeframe inter
POC Auto
Anton Polkovnikov
Auto Point of Control Indicator for those who use the Market/Volume Profile in their trading, who are familiar with the concepts of POC and VAH/VAL. I often noticed that it is inconvenient to change the zone of POC level calculation. Also it is not always convenient to use periodic areas, such as Day, Hour, etc. So I decided to develop a fully automated POC, where the zones change each other through the algorithm in the script. How to use POC - everyone decides for himself. They can be stop-loss
PULLBACK HUNTER What is every trader's cherished dream? To see without delay the places where the reversal will happen. This, of course, is from the category of magic, though... nothing is impossible. But for now I've prepared for you an indicator that marks in real time the end of corrections to the current movement or in short - catches pullbacks.What is the main point? Many people practice rebounds when the price moves in the direction of the open position. And they do them on the formation o
Levels StopTP
Anton Polkovnikov
LEVELS (extremes, stops, takeprofits) The indicator visualizes the levels of recent price extremes. Such values are searched for by means of an internal algorithm. It does not redraw.  It is used to change stop order placement levels (done manually by the user, the indicator only visualizes the level). It can also be used for taking partial profits at opposite levels of the movement. The indicator will allow you to take most of the strong movements. You don't have to worry about exiting a positi
Filtrele:
Değerlendirme yok
Değerlendirmeye yanıt