ABC Indicator
- Göstergeler
- Sürüm: 1.2
- Etkinleştirmeler: 5

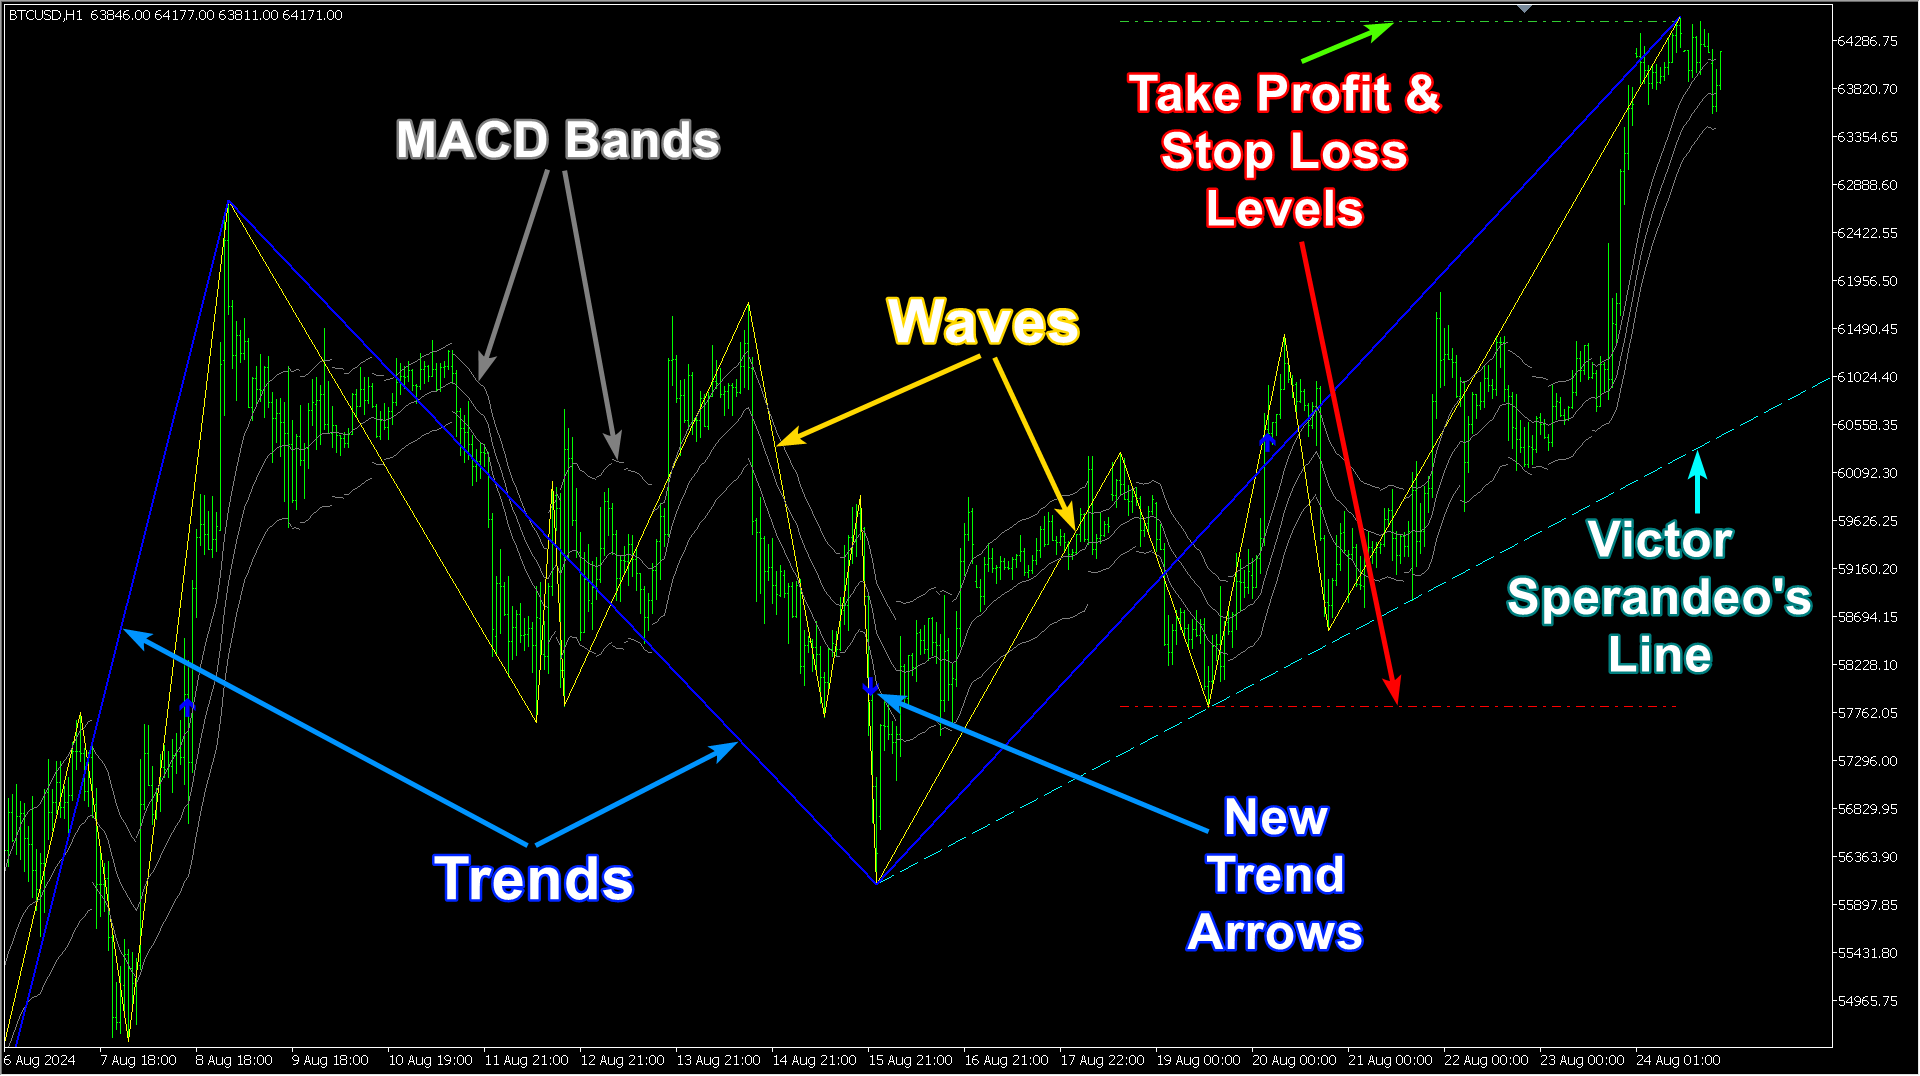
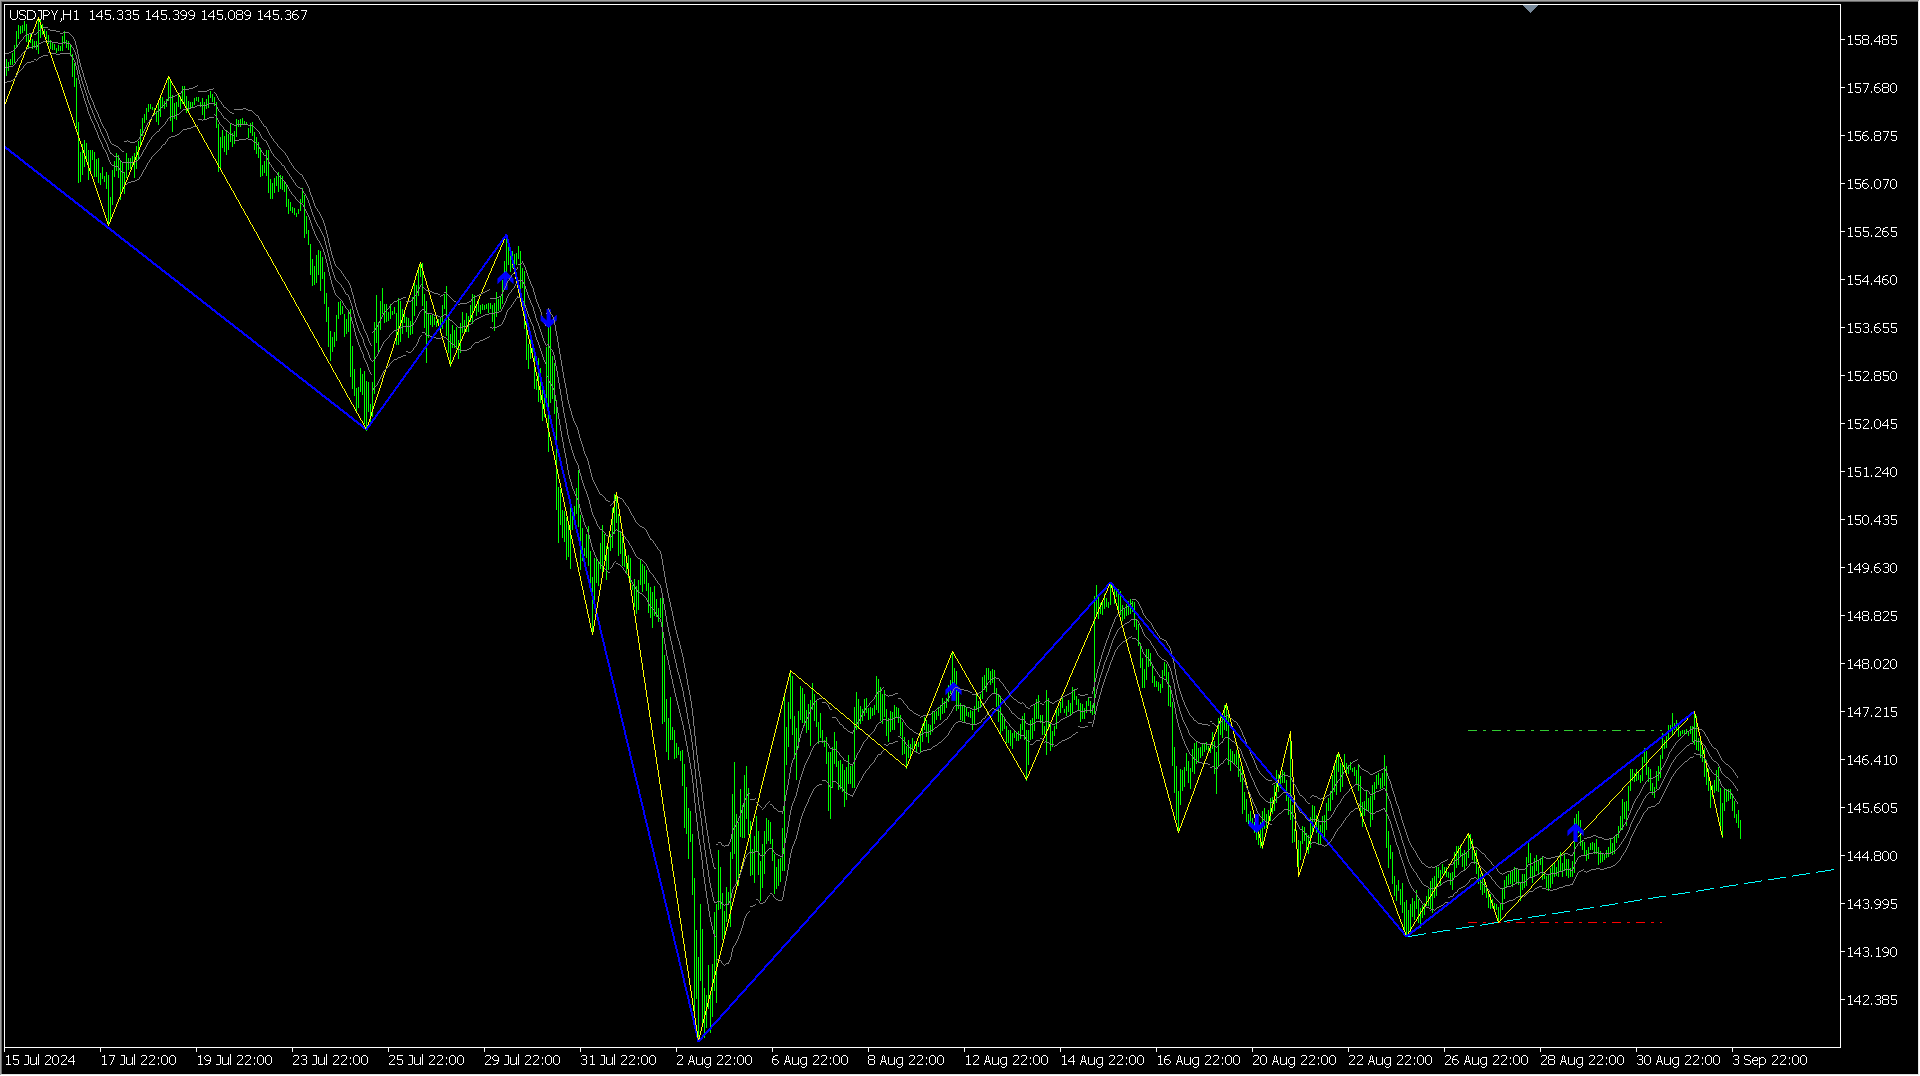
The ABC Indicator analyzes the market through waves, impulses, and trends, helping identify key reversal and trend-change points. It automatically detects waves A, B, and C, along with stop-loss and take-profit levels. A reliable tool to enhance the accuracy and efficiency of your trading.
This product is also available for MetaTrader 4 => https://www.mql5.com/en/market/product/128179
Key Features of the Indicator:
1. Wave and Trend Identification:
- Automatic detection of waves based on moving average (MA) crossings and ATR indicator values.
- Filtering out false signals by considering market movement ranges.
2. Trend Analysis:
- Determination of trend directions (uptrend or downtrend).
- Setting trend change points (g-points) and tracking their breakout to confirm trend reversals.
3. Impulses and Corrections:
- Automatic division of trend movements into impulses and corrections.
- Calculation of dynamic and fixed extremums for precise market structure tracking.
4. Turning Points (Turn Points):
- Establishing the turn point level within the range of a completed correction.
- Flexible settings to prevent the appearance of overly weak points.
5. Waves A, B, and C:
- Identification of wave A when the correction breaks the turn point.
- Identification of wave B considering counter-trends or alternative parameters.
6. Correction Boost:
- Calculation of correction boosts to determine their significance.
- Automatic update of turn points based on boosted corrections.
7. Vic Sperandeo’s Trendline:
- Construction of a trendline between the trend’s fixed extremum and the last correction’s extremum.
- Utilizing the Vic line as an additional condition for forming waves A and B.
8. Stop-Loss and Take-Profit Levels:
- Upon the appearance of a new trend, the indicator automatically plots potential stop-loss and take-profit levels.
- Levels are calculated based on the extremums of wave A or wave B (settable in the indicator’s input settings).
Advantages of Using the Indicator:
- Enhances the accuracy of market structure analysis.
- Reduces the impact of false signals by filtering market noise.
- Offers flexible parameter settings to adapt to your trading style.
- Clearly displays entry and exit points on the chart.
The ABC Indicator is ideal for both beginner and professional traders looking to improve their trading by leveraging clear market structures and key analysis points.
Additional Information:
For optimal performance, the indicator requires the user to input key parameters, including moving average lengths, ATR coefficient for wave identification, and levels for turn points and correction boosts. All settings can be adjusted to fit your trading preferences.
Input Parameters:
| === RATES HISTORY CALCULATIONS === | Settings for historical bar calculations. |
|---|---|
| Calculate History From Bar Shift | The bar number from which the indicator’s history calculation begins. |
| Calculate History From Bar DateTime | The date/time of the bar where the indicator’s history calculation starts. |
| === MACD INDICATOR === | MACD indicator settings. |
|---|---|
| Fast MA Period | The period for the fast moving average. |
| Slow MA Period | The period for the slow moving average. |
| Band Levels ATRs | Band levels as multiples of ATR values. |
| === ABC === | ABC settings. |
|---|---|
| Trend's Corrections Boost Expansion | The range of trend correction expansions to strengthen them. |
| Trend's Turn Point Correction Retracement | The retracement level of a correction to determine the trend’s turning point. |
| A-Wave Creation Type | A-wave creation method: Only Wave - Using only the wave; Break Turn Point - Using a breakout of the trend’s turning point. |
| B-Wave Creation Type | B-wave creation method: Only Wave - Using only the wave; Break Contra-Correction - Using a breakout of the trend’s counter-correction; Break Boosted Contra-Correction - Using a breakout of the enhanced counter-correction of the trend. |
| Use Vic Line To Set G-Point | Use Victor Sperandeo’s line to determine the G-point. |
| === TAKE-PROFIT & STOP-LOSS LEVELS === | Settings for take-profit and stop-loss levels. |
|---|---|
| Take-Profit Type | Method for constructing take-profit levels. |
| Take-Profit Level | The value used to define the take-profit level. |
| Stop-Loss Type | Method for constructing stop-loss levels. |
| Stop-Loss Level | The value used to define the stop-loss level. |
| === GRAPHICS === | Graphics settings. |
|---|
| --- MACD BANDS --- | Settings for MACD indicator bands. |
|---|---|
| Paint MACD Bands | Enable drawing MACD indicator bands. |
| MACD Bands Color | The color of MACD indicator band lines. |
| MACD Bands Width | The width of MACD indicator band lines. |
| MACD Bands Style | The style of MACD indicator band lines. |
| --- ABC WAVES --- | Settings for ABC wave graphics. |
|---|---|
| Paint ABC Waves | Enable drawing ABC waves. |
| ABC Waves Color | The color of ABC wave lines. |
| ABC Waves Width | The width of ABC wave lines. |
| ABC Waves Style | The style of ABC wave lines. |
| --- ABC TRENDS --- | Settings for ABC trend graphics. |
|---|---|
| Paint ABC Trends | Enable drawing ABC trends. |
| ABC Trends Color | The color of ABC trend lines. |
| ABC Trends Width | The width of ABC trend lines. |
| ABC Trends Style | The style of ABC trend lines. |
| --- ABC TRENDS VIC LINES --- | Settings for Victor Sperandeo’s ABC lines. |
|---|---|
| Paint ABC Trends Vic Lines | Enable drawing Victor Sperandeo’s ABC lines. |
| ABC Trends Vic Lines Color | The color of Victor Sperandeo’s ABC lines. |
| ABC Trends Vic Lines Width | The width of Victor Sperandeo’s ABC lines. |
| ABC Trends Vic Lines Style | The style of Victor Sperandeo’s ABC lines. |
| --- TP & SL LEVELS --- | Settings for take-profit and stop-loss levels. |
|---|---|
| Paint TP & SL Levels | Enable drawing take-profit and stop-loss levels. |
| TP Levels Color | The color of take-profit levels. |
| SL Levels Color | The color of stop-loss levels. |
| TP & SL Levels Width | The width of take-profit and stop-loss level lines. |
| TP & SL Levels Style | The style of take-profit and stop-loss level lines. |