Projection Indicator By BCB Elevate

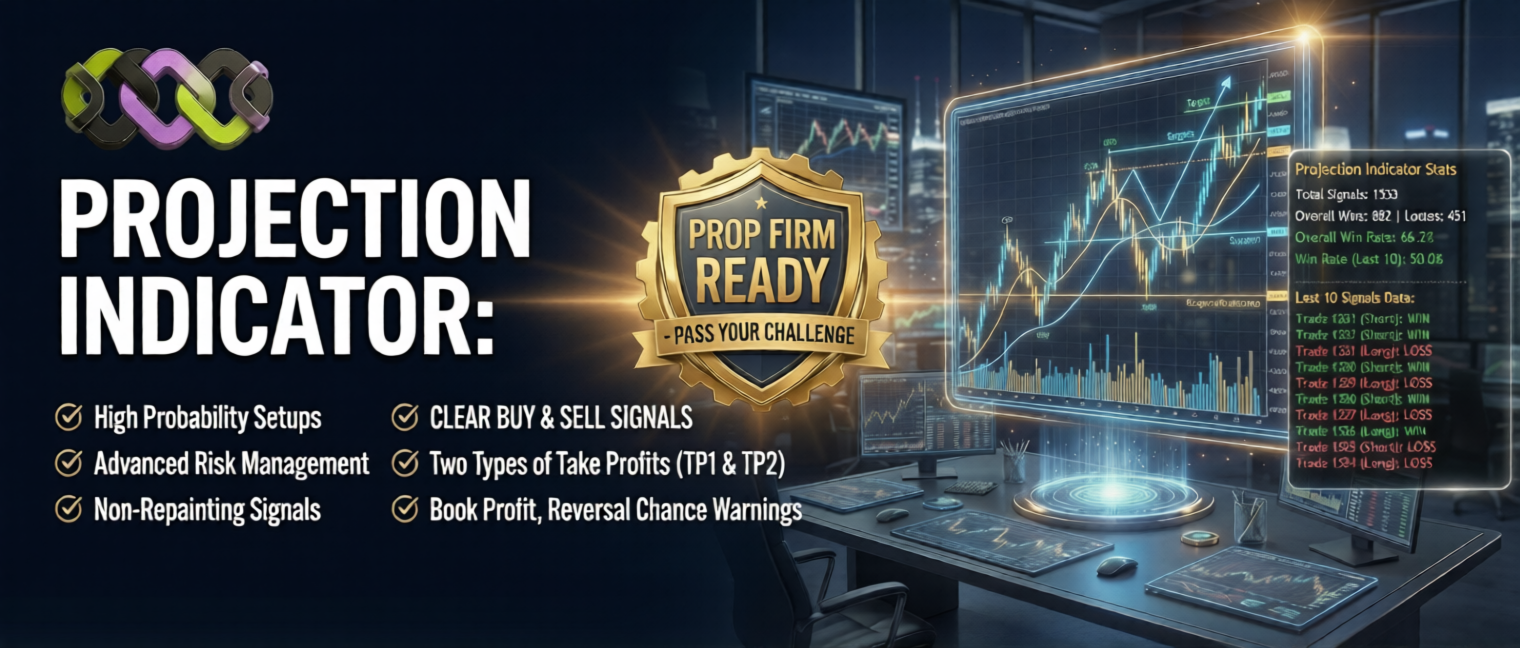
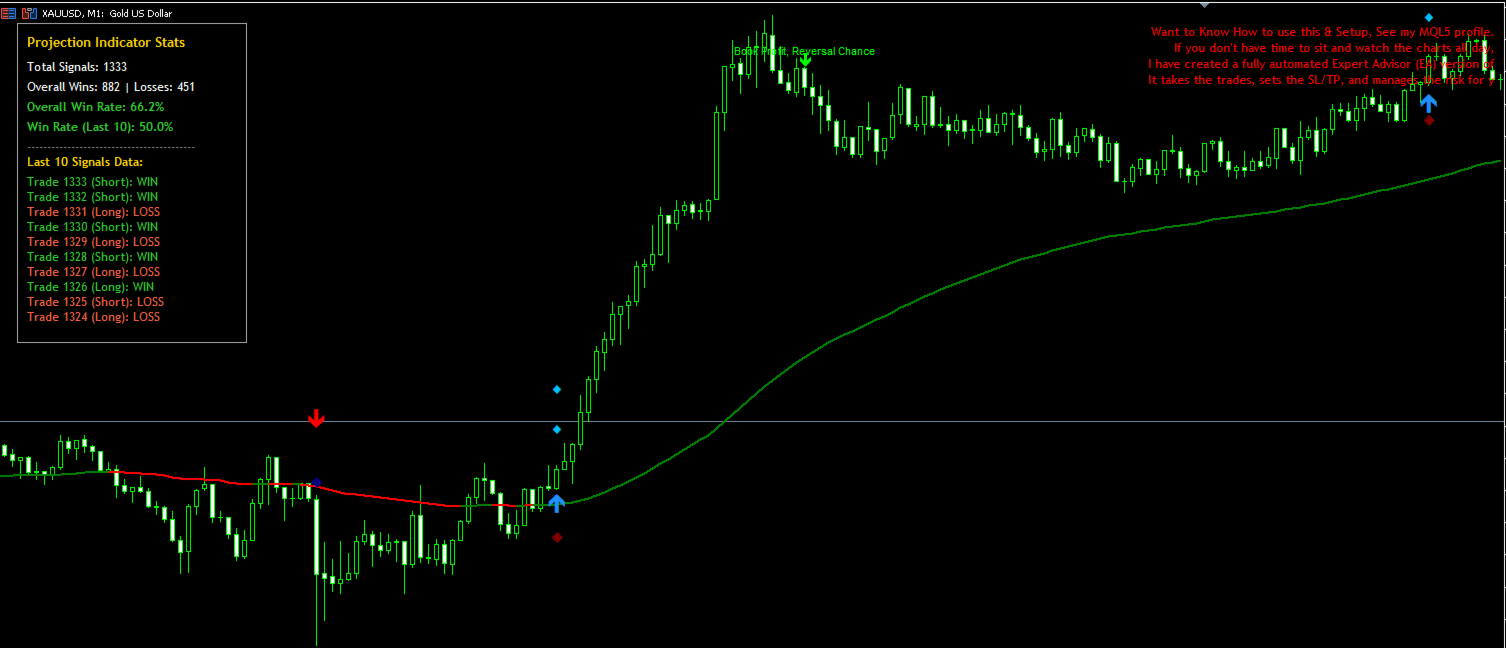
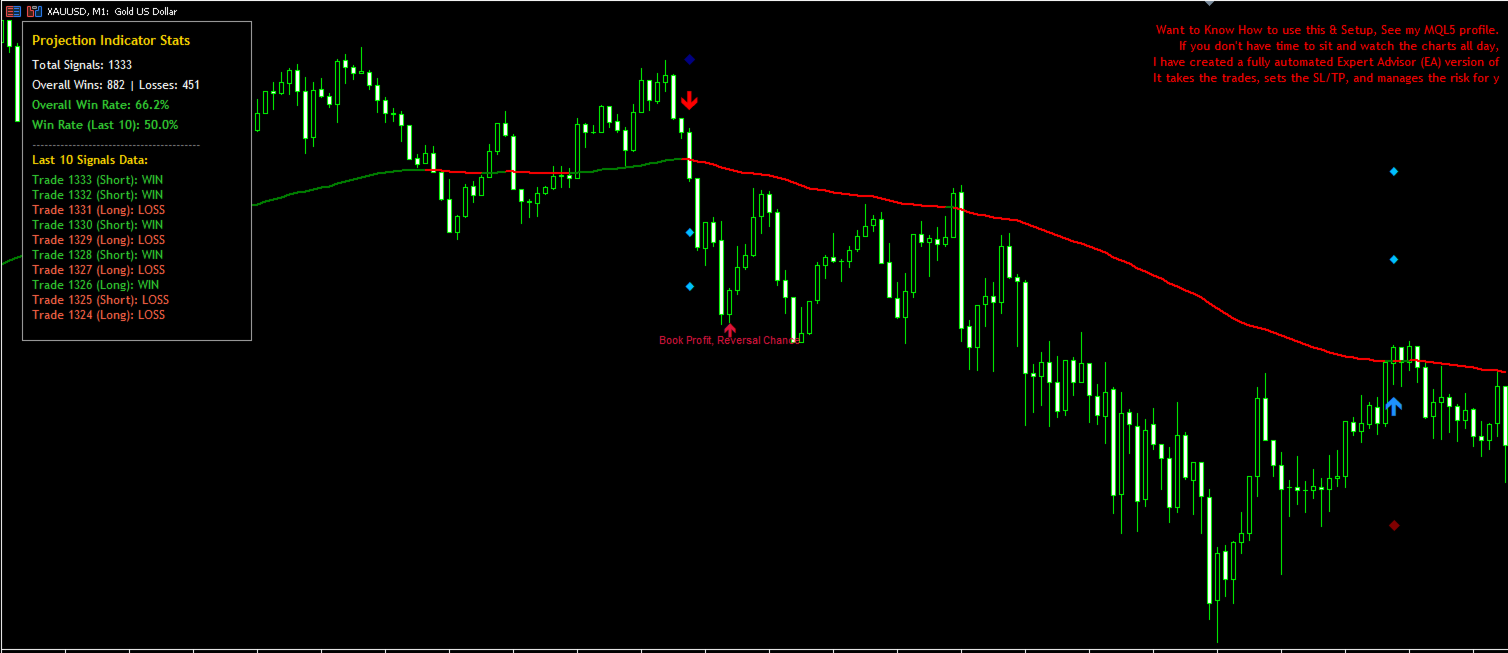
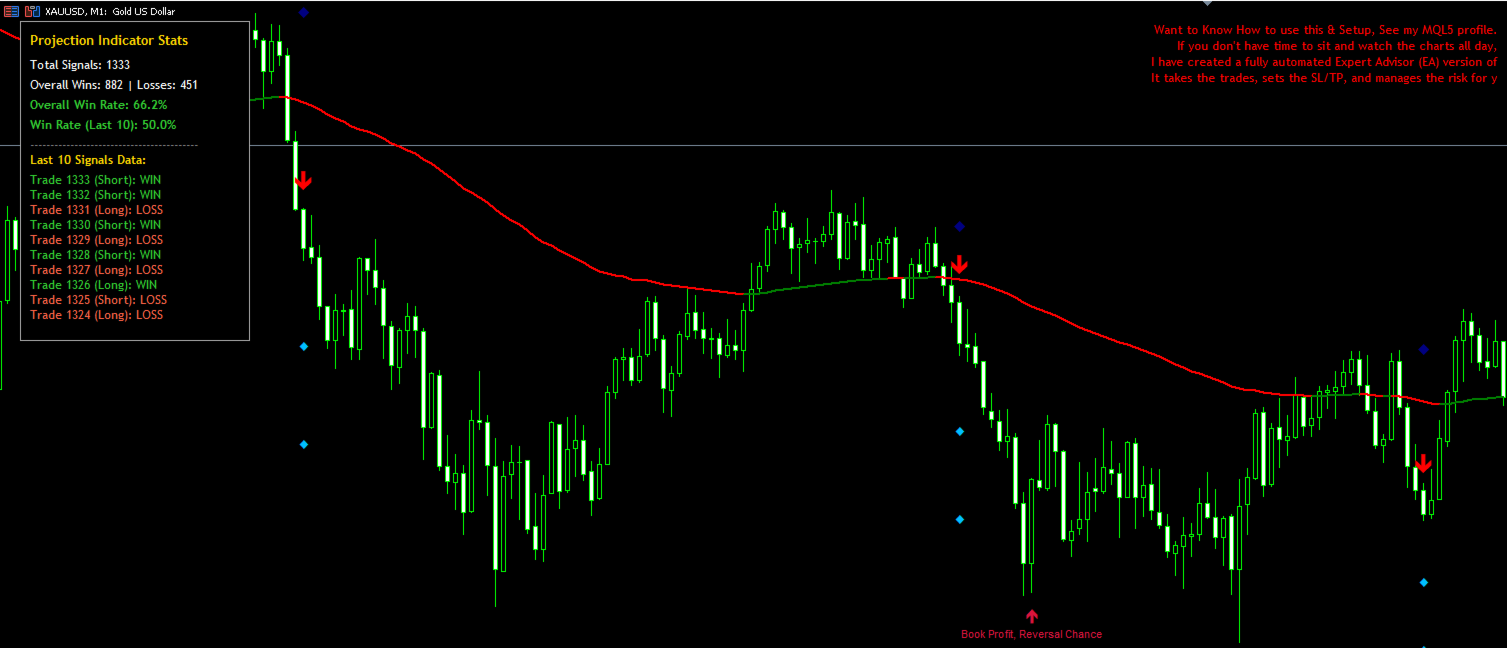
BCB Elevate tarafından geliştirilen Projection Göstergesi, eksiksiz, profesyonel düzeyde bir piyasa yapı ve trend takip aracıdır. Manuel trader'lar için tasarlanmıştır; makro trend filtresi (EMA 100), dinamik ATR takip stopları ve Swing High/Low pivot takibini birleştirerek son derece hassas grafik sinyalleri sunar.

Grafiğinizi yeniden çizmek veya karıştırmak yerine Projection Göstergesi, giriş oklarını, Stop Loss hedeflerini ve Take Profit seviyelerini çizmeden önce sıkı şartların hizalanmasını bekler.

Ana Özellikler:

  • Trend Tespiti: Gerçek piyasa trendini belirlemek için yapısal swing yüksek/düşüklerini kullanır.

  • Makro Filtre: Sadece baskın momentum ile işlem yapmanızı sağlamak için EMA 100'ü temel çizgi olarak kullanır.

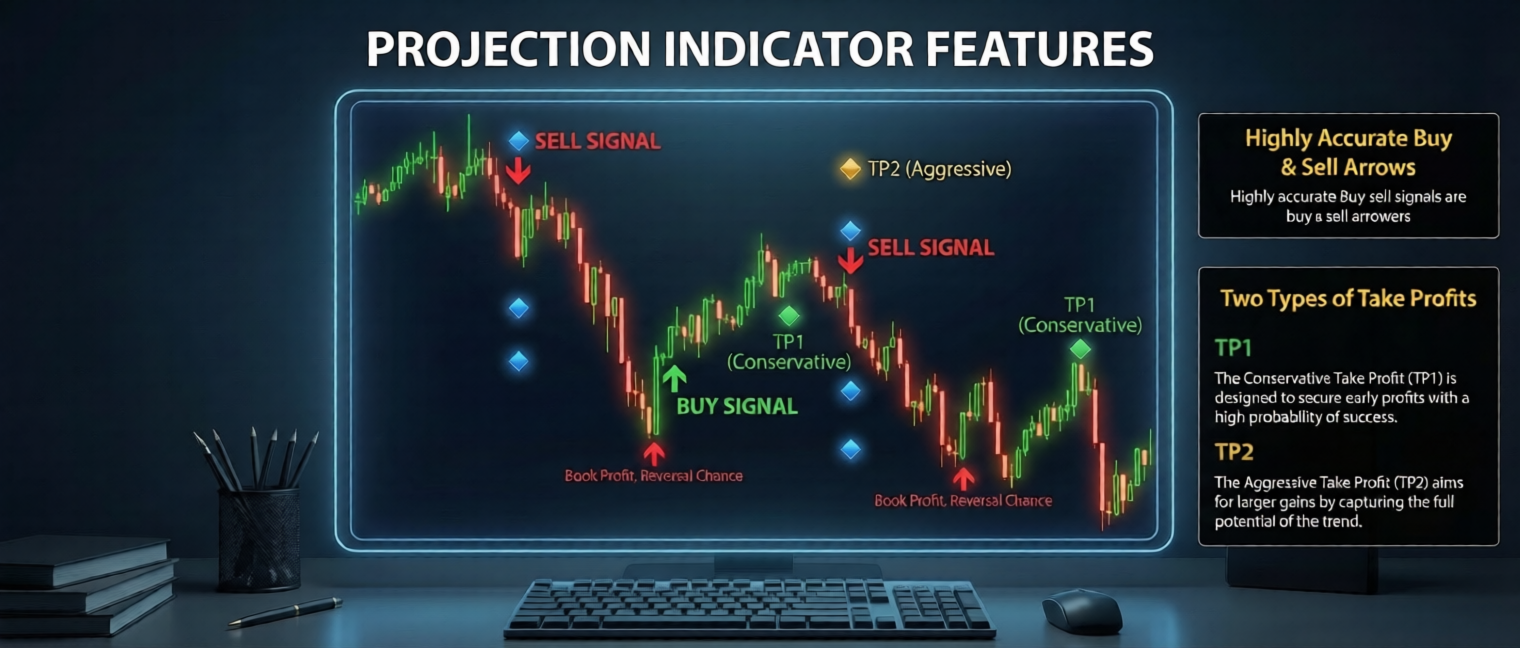
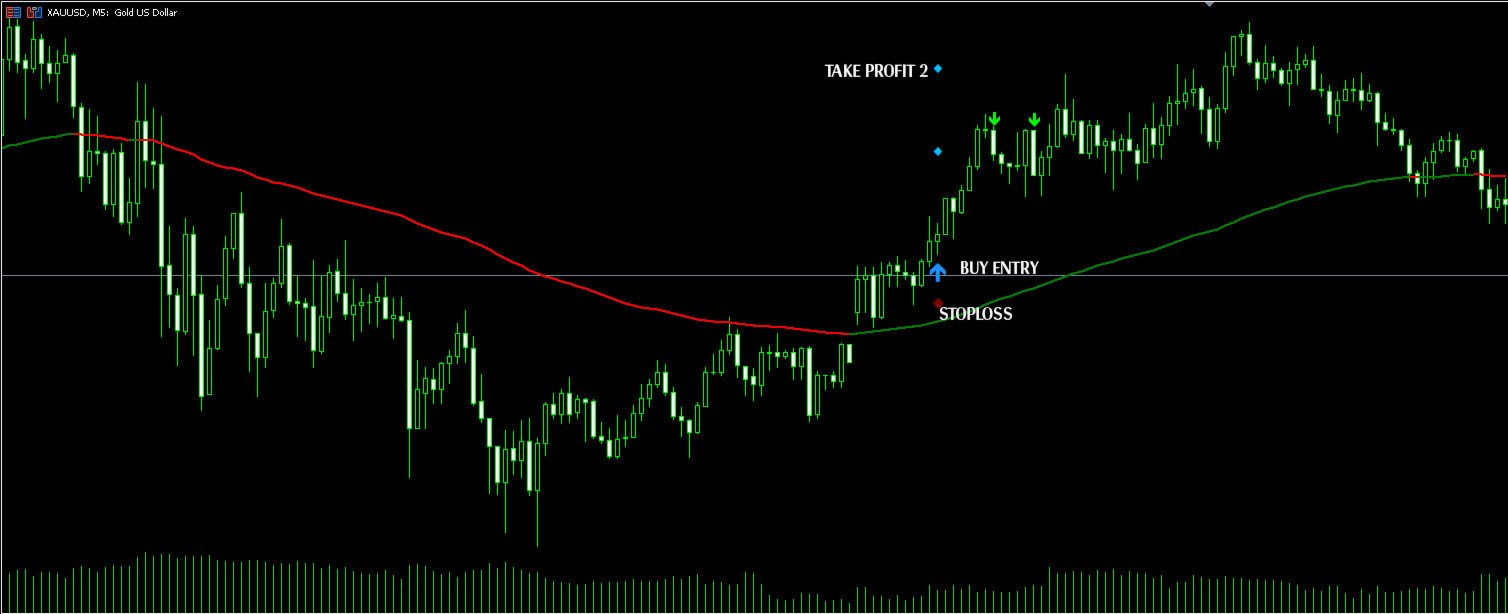
  • Dinamik ATR Stop'ları: Volatil stop-loss'ları ve çift take-profit (TP1 & TP2) bölgelerini otomatik olarak hesaplar.

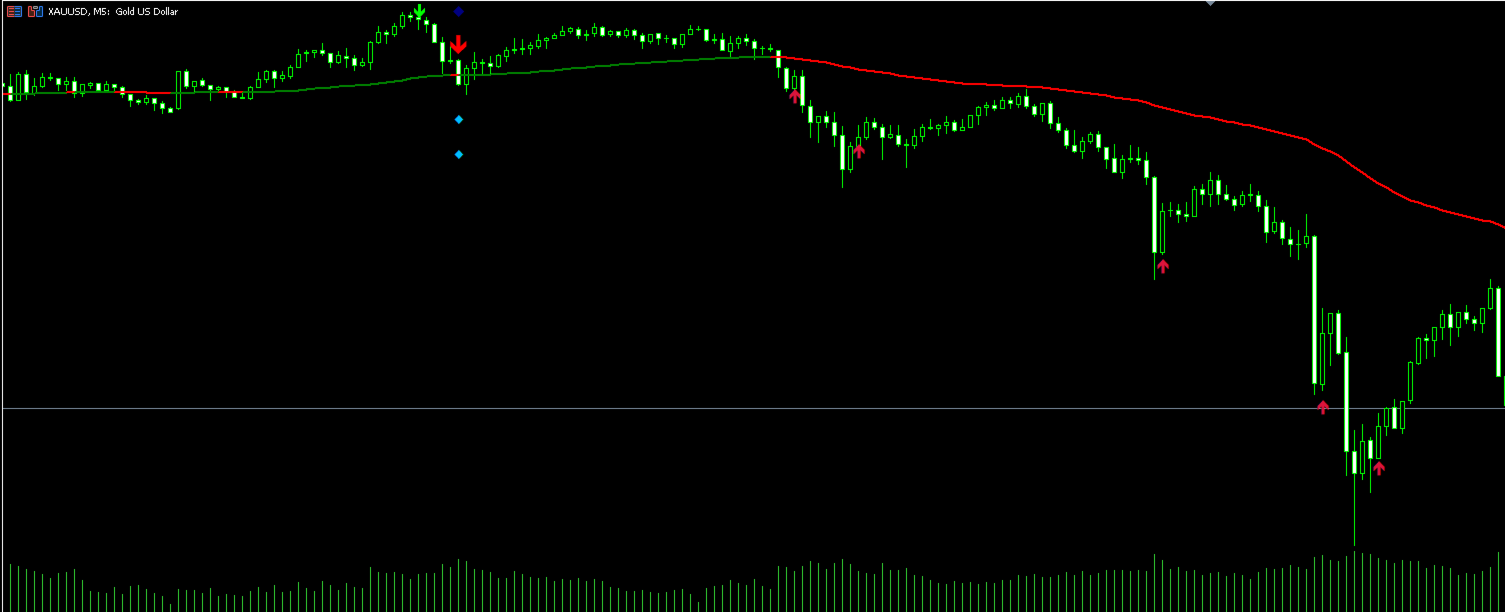
  • RSI Tepe Tespiti: RSI işlem sırasında aşırı alım/aşırı satım seviyelerine ulaştığında sizi uyarır, mükemmel çıkış fırsatları sağlar.

  • Tam Özelleştirilebilir: ATR tabanlı Stop Loss'lar veya Swing Pivot Stop Loss'lar arasında geçiş yapın.

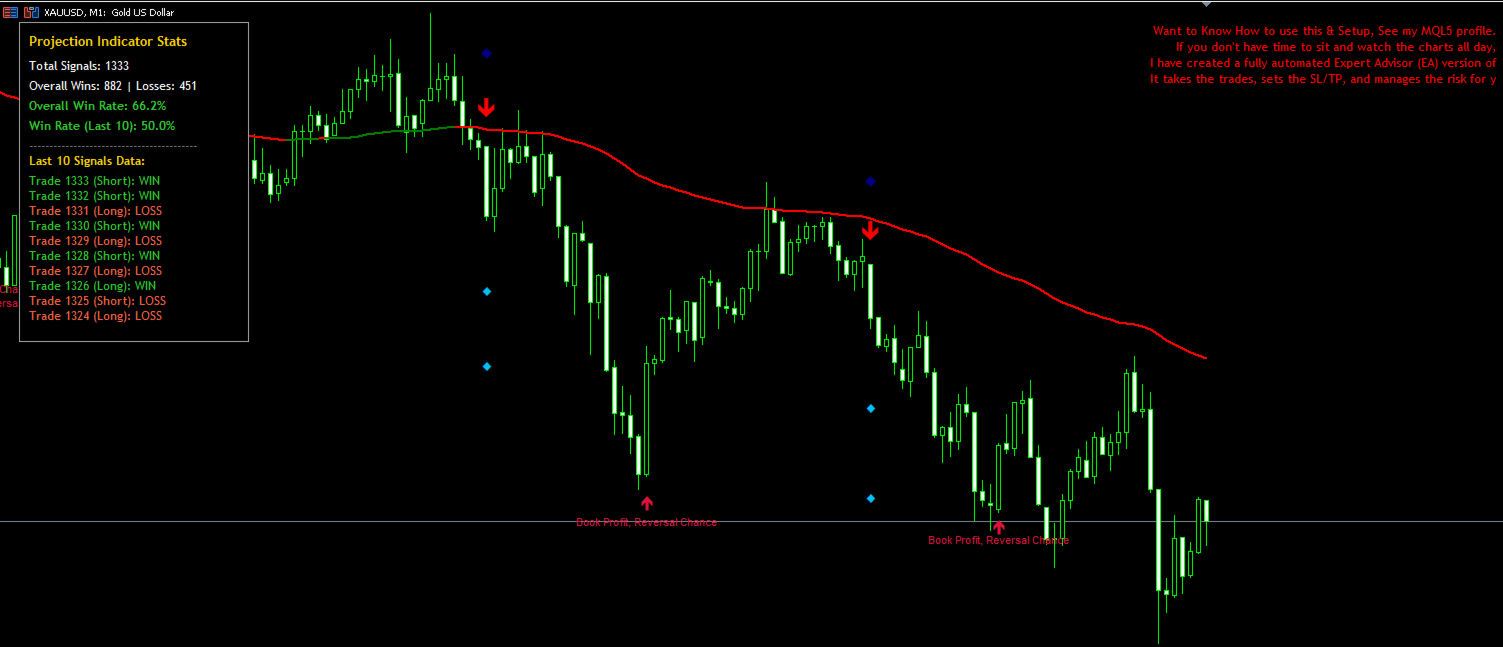
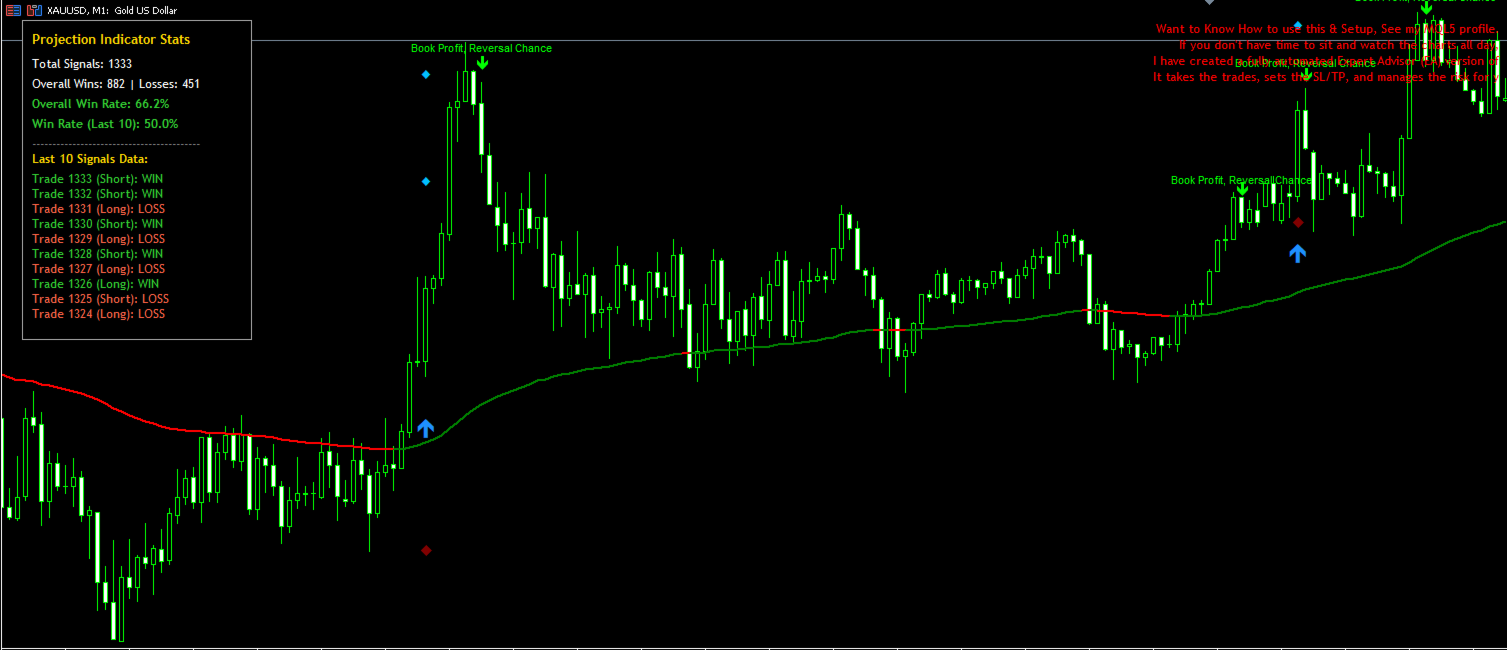
  • Yerleşik Uyarılar: Tüm girişler ve RSI tepeleri için push bildirimleri, açılır pencereler ve terminal çıktıları (sadece kapanmış barlarda tetiklenir — %100 yeniden çizim yok).

Nasıl Kullanılır:

  • Bar kapanışında Long (mavi) veya Short (kırmızı) oku görünmesini bekleyin.

  • Gösterge Stop Loss'unuzu (romb) ve Take Profit hedeflerini otomatik olarak çizecektir.

  • İşleminizi manuel olarak yönetin veya RSI Tepe Uyarısı tetiklendiğinde kısmi kar alımı yapın.


Önerilen ürünler
Product Description: Adaptive Y-Axis Scaling is a powerful MT5 indicator designed to enhance your trading experience by providing precise control over the Y-axis (price) scaling of your charts. This innovative tool allows you to customize the price scaling by specifying the number of pips from the visible chart's highs and lows. The calculated price range from this input is then used to set the maximum and minimum prices for the open chart, ensuring an optimized and comprehensive view of market
FREE
VWAP Bands Indicator
Hilario Henrique Silva Ribeiro
4.8 (25)
Do you know VWAP Bands? It is an indicator used to identify support and resistance points from the daily VWAP and you can use it to check the best entry and exit points. This indicator does not use the principle of bollinger bands. There is a difference in the calculation method. Use it according to your strategy. See the applications and what results you can get. The indicator is free and can be used on any account.
FREE
Moving pivot Average Fibonacci The  indicator compares the selected period with its counterpart from the previous period. The indicator determines the moving Fibonacci levels for the day or any time interval to assess the price movement range from the time average. The indicator helps predict the expected high or low for the day based on historical time data. The pivot line can be considered an average trend line and use it in a variety of trading strategies. If you have any question about the
Midpoint Bands
Emanuel Cavalcante Amorim Filho
Midpoint Bands   is a   channel-like   indicator that draws two lines on the chart - an upper band and a lower band, pointing out possible reversal levels. This is one of the indicators used in the Sapphire Strat Maker - EA Builder. Sapphire Strat Maker - EA Builder:  https://www.mql5.com/en/market/product/113907 The bands are simply calculated like this: Upper Band   = (HighestHigh[N-Periods] + LowestHigh[N-Periods])/2  Lower Band   = (LowestLow[N-Periods] + HighestLow[N-Periods])/2 Middl
FREE
Hilo Power
Dorival Cardozo
HiloPower – Advanced Trend and Market Strength Indicator for MetaTrader 5 HiloPower is not just another trend indicator developed from the traditional Hi-Lo. It was designed to offer a more complete and intelligent reading of the market, combining direction, strength, and intensity of movements. With it, the trader can see not only where the price is going, but also how strong and volatile that movement really is.
FREE
Anubi Terminal is a professional trade management assistant designed for manual traders who demand precision, speed, and strict risk control. Unlike automated bots, Anubi puts the trader in control, providing a sophisticated interface to execute and manage trades according to institutional-grade risk management rules. Why Anubi Terminal? Manual trading often fails due to calculation errors and emotional exits. Anubi eliminates these risks by automating position sizing and trade management based
Touch VWAP MT5
Danrlei Hornke
4.8 (5)
O Touch VWAP é um indicador que permite calcular uma Média Ponderada por Volume (VWAP) apenas apertando a tecla 'w' no seu teclado e após clicando no candle do qual deseja realizar o calculo, clicando abaixo do candle é calculada a VWAP baseado na minima dos preços com o volume, clicando sobre o corpo do candle é calculado uma VWAP sobre o preço medio com o volume e clicando acima do candle é calculado uma VWAP baseado na máxima dos preços com o volume, voce tambem tem a opção de remover a VWAP
FREE
Fusion Harmonic Intelligence , MetaTrader 5 platformunda çalışmak üzere tasarlanmıştır. Bu araç, piyasada kesin giriş noktalarını belirlemek için harmonik formasyon analizini RSI ve hareketli ortalamalar gibi geleneksel teknik göstergelerle birleştirir. Yazılım, önemli kayıplara karşı acil durum planları, entegre bir haber filtresi ve sermayeyi korumak için agresif bir hedge (korunma) sistemi içeren sağlam risk yönetimi ile öne çıkar. Ayrıca, dinamik bir takip eden durdur (trailing stop) motoru
Signal Eskiya, in addition to channel lines, reflects entry signals in the form of arrows. Trading strategies using the channel indicator belong to the classic methods of technical analysis, are easy to execute, and therefore available even to beginners. Price ranges work equally well on any trading assets and timeframes, they can be used both independently and with additional confirmation from oscillators and market volumes. American traders say: “Trend is your friend”, which means “Trend is
This is a professional automated trading system that uses a synthesis of 4 independent trading strategies employing artificial intelligence technologies and quantum computing to make consensus-based decisions. Key Features: Performs well on timeframes - H12 and D1 Multi-strategy approach - 4 independent strategies with different timeframes Consensus Engine - intelligent signal aggregation Quantum Adaptation - processing market uncertainty Self-learning system - continuous accuracy improvement
FREE
Simple indicator to calculate fibonacci retracement levels on time. Add to chart and move trend line to set the fibonacci retracement levels. Inputs Levels  - levels for which to calculate values, separated by space, default are fibonacci levels Show time  - if true, time will be shown on levels Show date  - if true, date will be shown on levels Show fibonacci level  - if true, value of levels will be shown Fibonacci lines color  - color of levels Trend line color  - color of trend line which de
FREE
Daily HiLo
Nicanor Jr Cagape Layco
DailyHiLo Indicator Master the daily range like a pro. This indicator automatically plots the previous day’s high and low levels —a core element in the (Beat The Market Maker) trading approach—directly on your chart. These levels act as natural boundaries for intraday price action, helping traders identify potential reversal zones, breakout points, and liquidity targets. Key Features Accurate plotting of yesterday’s high and low for any symbol and timeframe. Works seamlessly with BTMM-inspired
FREE
VWAP Cloud
Flavio Javier Jarabeck
4.1 (10)
Do you love VWAP? So you will love the VWAP Cloud . What is it? Is your very well known VWAP indicator plus 3-levels of Standard Deviation plotted on your chart and totally configurable by you. This way you can have real Price Support and Resistance levels. To read more about this just search the web for "VWAP Bands" "VWAP and Standard Deviation". SETTINGS VWAP Timeframe: Hourly, Daily, Weekly or Monthly. VWAP calculation Type. The classical calculation is Typical: (H+L+C)/3 Averaging Period to
FREE
Liquidity Map
Alex Amuyunzu Raymond
Liquidity Map  Overview The Liquidity Map indicator is an advanced visualization tool based on ICT Smart Money Concepts . It automatically identifies daily Buy Zones , Sell Zones , and Liquidity Levels , showing where price is likely to reverse or continue based on institutional order flow. It calculates key levels from the daily session — such as the previous day’s high, low, and midpoint — then derives a premium (sell bias) and discount (buy bias) structure. When price trades into these mapped
Linha PCM Fimathe
Anderson Maicon De Vargas Odorcik
Manual de Instalação e Configuração Para que você tenha a melhor experiência profissional, siga estes passos simples para preparar o seu terminal: 1. Ativação no Terminal (Ajuste de Segurança) Antes de começar, precisamos garantir que o MetaTrader permita que você manipule a ferramenta livremente: Pressione Ctrl + O para abrir as Opções . Vá na aba Gráficos . Marque a opção: "Selecionar objetos com um clique do mouse" . Isso permitirá que você ajuste a régua de medição de forma instantânea. 2. V
Price Action Suvo - Ultimate SMC & Trend Indicator  Key Features 1. Advanced Market Structure (BOS & CHoCH) Dual Structure Analysis:   Automatically identifies both   Internal Structure   (short-term) and   Swing Structure   (major trends). BOS & CHoCH:   Clearly marks   Break of Structure (BOS)   and   Change of Character (CHoCH)   with distinct styles. Visual Perfection: Internal:   Dotted lines for minor structure. Swing:   Solid lines for major structure. No Overlap:   Fixed logic prevent
FREE
SMC Structure Markup
Seyed Mohammad Hosseini Hejazi
4.67 (15)
Overview The Smart Money Structure Markup Indicator for MetaTrader 5 is a powerful tool designed to help traders identify key market structures based on popular Smart Money Concepts (SMC) strategies. This indicator detects micro-market structures, providing insights into price movements and potential trend changes. It highlights important elements such as valid Break of Structure (BOS), Change of Character (CHoCH), and Inducement (IDM), helping traders to make informed decisions. Key Features Ma
FREE
I recommend you to read the  product's blog  (manual) from start to end so that it is clear from the beginning what the indicator offers. This multi time frame and multi symbol supply and demand zone dashboard indicator sends alerts when the price has reached a supply/demand zone. It is also possible to use it to be alerted about regular double tops/bottoms instead of zones. It can be used with all time frames from M1 to MN. Maximum 9 time frames can be shown in the dashboard at the same time. 
track record of myfxbook : Raw spread hesabında geri test yapın ve etkileyici sonuçlar göreceksiniz. Expert Advisor (EA) Genel Bakış: Bu EA, özellikle XAUUSD (Altın / ABD Doları) çifti için optimize edilmiştir. 1 saatlik zaman dilimi (H1) için en iyi performansı sunarken, 4 saatlik zaman dilimi (H4) de güçlü bir ikincil seçenektir. Altın piyasasının kendine özgü volatilitesi ve yapısına göre titizlikle ayarlanmıştır. Sana hızlı zenginlik hayalleri satmıyoruz. Gerçek anlamda profesyonel ti
"Manual channel drawing? Not anymore. Let the market structure reveal itself automatically." "Track long-term price zones 24/7, in real-time." Real Trader Pain Points Identifying pivot points manually takes   huge time   and   effort Difficult to adapt to   high volatility   and pinpoint   reliable channels Copy Ideas "Markets never sleep. Why should your analysis stop?" "Dozens of assets a day—how do you keep up?" Core Claim AutoChannels   automatically reads market structure , reducin
Previous Day Close
Vincent Kipleting Burugo
The indicator is a line right at yesterday's closing price. With the indicator, there is no need for adding or deleting previous day close lines each new day. T he line gives you an instant visual reference point for support, resistance, and market sentiment.   Whether you are day trading or swing trading, this line helps you quickly gauge where the market closed last session and how current price action relates to that level. It works seamlessly across all timeframes - from 1-minute charts to d
FREE
Pivot Point Slim Indicator Overview A professional-grade pivot point indicator equipped with 6 types of pivots. With a clean, easy-to-read design, it automatically displays important support and resistance levels on your chart. Customizable Display Settings Individual color settings for each level (P, S1-S5, R1-R5) Show/hide toggle for each level Label display on/off Price display on/off Label position (left/right) Label offset adjustment (spacing between lines and text) Line width adjustment Hi
FREE
Graphic Alignment Context
Ricardo Alexandre Laurentino
The Graphic Alignment Context (GAC) Technical Indicator measures the vertical difference of the simple average price of a financial instrument in the context of three different timeframes determined by a defined number of bars or candles (periods) to determine the strength of the buy or sell trend. sale. Ascending average prices indicate Buying strength (1), Descending average prices indicate Selling strength (-1) and any scenario different from the previous two conditions indicates Neutrality
FREE
NakaTrend
Ricardo De Andrade Nakano
2 (1)
"NakaTrend'i Tanıtıyoruz: MetaTrader 5 İçin Son Trend Belirleyici! Trading deneyiminizi devrim niteliğinde bir hale getirmeye hazır mısınız? NakaTrend'i keşfedin, trend değişikliklerini hassas ve kolay bir şekilde belirlemek için güvenilir göstergeniz. NakaTrend ile artık piyasadaki dalgalanmalardan yararlanma fırsatını kaçırmayacaksınız. Yükselen bir trend ortaya çıktığında, NakaTrend bunu yeşil bir dolar işareti ile belirtir ve alış emri vermenizi önerir. Ve eğer eğilim düşüşe geçerse, kırm
FREE
CYCLE WAVE OSCILLATOR indicator is an indicator based on cyclical price fluctuations. This indicator can help you determine overbought and oversold levels, and help you predict price trends within the cycle. MT4 Version here! You can combine it with our indicators below to make your trading decisions more accurate: Supply Demand Ribbon MT5 Basic Feature: - Three Trend Types: + Zero + Basic + Advanced
FREE
An updated version is now available free of charge. Ver. 034.33   is available. Basics Currency Pair: EUR-USD 5 Minute Display and set the 5-minute chart of EUR-USD. Adjustments may be necessary depending on the broker. In particular, entry is controlled by " エンベロープミドル偏差"  and the ATR 1H value. About Envelope Middle Deviation " エンベロープミドル偏差" is closer to 1.0, the easier it is to enter the market, but at the same time, the rate of being cut-risk increases. About  ATR EntryLimit   ATR Entry Li
FREE
Bu çoklu zaman dilimi ve çoklu sembol göstergesi, stokastik sinyal hattının stokastik ana hattını ne zaman kestiğini tanımlar. Alternatif olarak, stokastik aşırı alım/satış alanından ayrıldığında (ana hattı kesen sinyal hattı olmadan) uyarı verebilir. Bonus olarak Bollinger bantlarını ve RSI aşırı alım/satış çaprazlarını da tarayabilir. Kendi kurallarınız ve tekniklerinizle birleştiğinde bu gösterge, kendi güçlü sisteminizi yaratmanıza (veya geliştirmenize) izin verecektir. Özellikler Piyasa İzl
Volatilite Doktoru Çöl Kartalı'nı Tanıtıyor: Patlayıcı Ticaret Başarısı için Mükemmel Skalp Algoritmanız! Ticaret oyununuzu devrimleştirmeye hazır mısınız? Volatilite Doktoru Çöl Kartalı'na daha fazla bakmanıza gerek yok - bu, hassasiyet, kontrol ve karlılıkla tüccarları donatmak amacıyla tasarlanmış olan son derece başarılı bir skalp algoritmasıdır. İşte Volatilite Doktoru Çöl Kartalı'nın diğerlerinin önünde duran nedenleri: 1) Basit ve Anlaşılır: Karmaşık jargon veya dik öğrenme eğrisi yok.
FREE
TilsonT3
Jonathan Pereira
5 (1)
Tillson's T3 moving average was introduced to the world of technical analysis in the article ''A Better Moving Average'', published in the American magazine Technical Analysis of Stock Commodities. Developed by Tim Tillson, analysts and traders of futures markets soon became fascinated with this technique that smoothes the price series while decreasing the lag (lag) typical of trend-following systems.
FREE
Professional VWAP Trading System with Advanced Signal Detection Transform your trading with the most comprehensive VWAP indicator available for MetaTrader 5. Magic VWAP Key Levels Pro combines multiple timeframe analysis, intelligent signal detection, and professional-grade visualization to give you the edge in modern markets. CORE FEATURES: Multi-Timeframe VWAP Analysis Session, Weekly, and Monthly VWAP calculations Previous 10-day VWAP support/resistance Dynamic anchor periods (Session/Week/Mo
Bu ürünün alıcıları ayrıca şunları da satın alıyor
Market Flow Pro
Gabriele Sabatino
4 (1)
Market Flow Pro Market Flow Pro is an intelligent trading advisor for the MetaTrader 5 platform, designed for automatic trading on financial markets using algorithmic analysis and strict risk management. -Key features: - Fully automatic trading 24/5 - Adaptive trend and momentum entry algorithm -  Built-in risk management - Flexible lot settings (fixed/auto-calculation) - Support for major currency pairs and indices - Optimised for operation on various timeframes  How it works Market
Azimuth Pro
Ottaviano De Cicco
5 (4)
LAUNCH PROMO Azimuth Pro price is initially set at 299$ for the first 100 buyers. Final price will be 499$ . THE DIFFERENCE BETWEEN RETAIL AND INSTITUTIONAL ENTRIES ISN'T THE INDICATOR — IT'S THE LOCATION. Most traders enter at arbitrary price levels, chasing momentum or reacting to lagging signals. Institutions wait for price to reach structured levels where supply and demand actually shift. Azimuth Pro maps these levels automatically: swing-anchored VWAP, multi-timeframe structure lines, an
ARIPoint
Temirlan Kdyrkhan
ARIPoint is a powerful trading companion designed to generate high-probability entry signals with dynamic TP/SL/DP levels based on volatility. Built-in performance tracking shows win/loss stats, PP1/PP2 hits, and success rates all updated live. Key Features: Buy/Sell signals with adaptive volatility bands Real-time TP/SL/DP levels based on ATR Built-in MA Filter with optional ATR/StdDev volatility Performance stats panel (Success, Profit/Loss, PP1/PP2) Alerts via popup, sound, push, or email Cu
RelicusRoad Pro: Kantitatif Piyasa İşletim Sistemi ÖMÜR BOYU ERİŞİMDE %70 İNDİRİM (SINIRLI SÜRE) - 2.000+ TRADER'A KATILIN Neden çoğu trader "mükemmel" indikatörlere rağmen başarısız olur? Çünkü tekil kavramları boşlukta trade ederler. Bağlamı olmayan bir sinyal kumardır. Sürekli kazanmak için KONFLÜANS (UYUM) gerekir. RelicusRoad Pro basit bir ok indikatörü değildir. Tam bir Kantitatif Piyasa Ekosistemi dir. Tescilli volatilite modellemesini kullanarak fiyatın ilerlediği "Adil Değer Yolu"nu har
CGE Trading Suite
Carl Gustav Johan Ekstrom
5 (1)
CGE Trading Suite delivers the analytical edge typically reserved for professional trading desks. The platform integrates a full suite of analytical tools into one seamless workflow: dynamic grid mapping, liquidity behavior analysis, ECM, trend lines, MIDAS, trade cycles, and directional channel projections. Together, these provide a unified view of market structure and momentum. Directional clarity is further enhanced by the capital flow index, which measures currency basket strength to identif
" Dynamic Scalper System MT5 " göstergesi, trend dalgaları içinde işlem yapmak için scalping yöntemi için tasarlanmıştır. Başlıca döviz çiftleri ve altın üzerinde test edilmiştir, diğer işlem araçlarıyla uyumluluğu mümkündür. Ek fiyat hareketi desteğiyle trend boyunca pozisyonların kısa vadeli açılması için sinyaller sağlar. Göstergenin prensibi. Büyük oklar trend yönünü belirler. Küçük oklar şeklinde scalping için sinyaller üreten bir algoritma trend dalgaları içinde çalışır. Kırmızı oklar yü
Göstergemiz, piyasada ilgi gösterilen bölgeleri vurgular ve ardından emir birikim bölgelerini gösterir. Büyük ölçekli bir emir defteri (order book) gibi çalışır. Bu, büyük sermaye için geliştirilmiş bir göstergedir. Performansı olağanüstüdür. Piyasada ne tür bir ilgi olursa olsun, onu görürsünüz . (Bu, tamamen yeniden yazılmış ve otomatikleştirilmiş bir versiyondur – artık manuel analiz gerekmez.) İşlem Hızı (Transaction Speed) , piyasada büyük emirlerin nerede ve ne zaman biriktiğini gösteren v
Pointer Trend Switch — precision trend reversal indicator Pointer Trend Switch is a high-precision arrow indicator designed to detect key moments of trend reversal based on asymmetric price behavior within a selected range of bars. It identifies localized price impulses by analyzing how far price deviates from the opening level, helping traders find accurate entry points before a trend visibly shifts. This indicator is ideal for scalping, intraday strategies, and swing trading, and performs equa
ARIScalping
Temirlan Kdyrkhan
ARIScalp is a powerful trading companion designed to generate high-probability entry signals with dynamic TP/SL/DP levels based on volatility. Built-in performance tracking shows win/loss stats, PP1/PP2 hits, and success rates all updated live. Key Features: Buy/Sell signals with adaptive volatility bands Real-time TP/SL/DP levels based on ATR Built-in MA Filter with optional ATR/StdDev volatility Performance stats panel (Success, Profit/Loss, PP1/PP2) Alerts via popup, sound, push, or email Cus
Matreshka
Dimitr Trifonov
5 (2)
Matreshka self-testing and self-optimizing indicator: 1. Is an interpretation of the Elliott Wave Analysis Theory. 2. Based on the principle of the indicator type ZigZag, and the waves are based on the principle of interpretation of the theory of DeMark. 3. Filters waves in length and height. 4. Draws up to six levels of ZigZag at the same time, tracking waves of different orders. 5. Marks Pulsed and Recoil Waves. 6. Draws arrows to open positions 7. Draws three channels. 8. Notes support and re
The Institutional Secret Method  represents a paradigm shift in market analysis, moving away from lagging indicators and into the realm of Topological Finance . It is engineered to decode the hidden geometry of price movement by calculating the most efficient path—the Geodesic —between current price action and institutional liquidity targets. The system views the market as a physical landscape where price is naturally drawn toward massive pools of liquidity (Stops). It uses two primary calculati
UZFX {SSS} Scalping Smart Signals MT5, hızlı hareket eden piyasalarda doğru, gerçek zamanlı sinyaller talep eden Scalper'lar, Günlük Yatırımcılar ve Swing Yatırımcılar için tasarlanmış, Yeniden Boyama Yapmayan yüksek performanslı bir ticaret göstergesidir. (UZFX-LABS) tarafından geliştirilen bu gösterge, fiyat hareket analizi, trend onayı ve akıllı filtrelemeyi bir araya getirerek tüm döviz çiftleri ve zaman dilimlerinde yüksek olasılıklı alım ve satım sinyalleri üretir. Temel Özellikler Akıllı
TrendMaestro5
Stefano Frisetti
note: this indicator is for METATRADER4, if you want the version for METATRADER5 this is the link:  https://www.mql5.com/it/market/product/108106 TRENDMAESTRO ver 2.5 TRENDMAESTRO recognizes a new TREND from the start, he never makes mistakes. The certainty of identifying a new TREND is priceless. DESCRIPTION TRENDMAESTRO identifies a new TREND in the bud, this indicator examines the volatility, volumes and momentum to identify the moment in which there is an explosion of one or more of these da
Scalping Winning Signals Pro SWS
Muhammad Usman Siddique
5 (1)
UZFX SWS {Scalping Winning Signals} Pro v1.0, Usman Zabir (UZFX LABS) tarafından hızlı hareket eden piyasalarda kesin giriş sinyalleri arayan scalperlar, günlük tüccarlar ve swing tüccarlar için özel olarak geliştirilmiş, güçlü, yeniden boyama yapmayan bir göstergedir. Gecikme veya yanlış yeniden boyama olmadan güvenilir, gerçek zamanlı sinyaller isteyen tüccarlar için idealdir. ÖNERDİĞİM* EN İYİ ZAMAN ARALIKLARI: 30 DAKİKA VE ÜZERİ. {1 SAAT} BENİM FAVORİM. VE SONUÇLAR AKIL ALMAZ...! Temel Öze
Weis Wave with Alert MT5
Trade The Volume Waves Single Member P.C.
4.94 (17)
Rental/Lifetime Package Options and Privileges  Rent Monthly Six Months   Yearly/Lifetime Weis Wave with Speed with Alert+Speed Index x x x Manual  x x x Quick Set up Video x x x Blog x x x Lifetime Updates x x x Setup and Training Material x x Discord Access Channel "The SI traders"          x Rectangle Break Alert Tool      x How to trade with it:    http://www.tradethevolumewaves.com   ** If you purchase please contact me to setup your  : Training Room and  complete manual access.  Wei
Introduction to X3 Chart Pattern Scanner X3 Cherart Pattern Scanner is the non-repainting and non-lagging indicator detecting X3 chart patterns including Harmonic pattern, Elliott Wave pattern, X3 patterns, and Japanese Candlestick patterns. Historical patterns match with signal patterns. Hence, you can readily develop the solid trading strategy in your chart. More importantly, this superb pattern scanner can detect the optimal pattern of its kind. In addition, you can switch on and off individu
Rtc ML Ai Predictor
Muhammad Faisal Sagala
Rtc ML Ai | Predictor CORE MACHINE LEARNING ENGINE Adaptive ML Market Predictor – Multi-Bar Trend & Candle Forecast What This Indicator Does This indicator is a  real-time market prediction engine  designed to analyze price behavior and estimate  future market tendencies . Unlike conventional indicators, this system  does not rely on static parameters or historical curve-fitting , but adapts its internal state dynamically during live market operation. Instead of using static rules, the indic
Jita Indicator Pro MT5 | All Timeframes Professional Trend Agreement System – Premium Edition ($500) What Is Jita Indicator Pro? Jita Indicator Pro is a structured trend-confirmation system designed for serious traders who value precision, alignment, and controlled signal behavior. It combines: Advanced band-based trend direction logic ATR-driven structural trigger engine Dual-confirmation agreement system Locked history update design This indicator prints signals only when multiple conditions
ÜCRETSİZ AUX Göstergesini, EA desteğini ve tam kılavuzu alın, lütfen ziyaret edin – https://www.mql5.com/en/blogs/post/763955 Trend'i Belirle. Deseni Oku. Girişi Zamanla. 30 Saniyede 3 Adım! Kolayca işlem yapın — analiz gerektirmez, Akıllı yardımcınız iş akışınızı basitleştirmeye hazır Artık grafik yüklemesi yok. Akıllı yönelim tespiti ile güvenle işlem yapın. Tüm para birimleri, kripto, hisse senetleri, metaller, endeksler ve herhangi bir zaman dilimi ile uyumludur. Sadece tıklayın ve yürütün
Recommended TimeFrame >= H1. 100% Non Repainted at any moment.  Use it carefully, only with Trend Direction. Trading Usage: 2 Variants: as Range System or as BreakOut System (Both Only With Trend Direction)::: (Always use StopLoss for minimise Risk); [1] as Range System: (Recommended) in UP TREND:  - BUY in Blue Line , then if price goes down by 50 points (on H1) open Second BUY.   Close in any Profit you wish: TrailingStop(45 points) or Close when Price touches upper Gold Line. in DOWN TREND
MT4 / MT5 için Astronomi Göstergesini Tanıtıyoruz: En İleri Göksel Ticaret Arkadaşınız Ticaret deneyiminizi göksel seviyelere yükseltmeye hazır mısınız? MT4 için devrim niteliğindeki Astronomi Göstergemizi arayın. Bu yenilikçi araç karmaşık algoritmaları kullanarak eşsiz astronomik içgörüler ve hassas hesaplamalar sunmak için geleneksel ticaret göstergelerini aşmaktadır. Bilgi Evreni Parmaklarınızın Ucunda:   Göksel verilerin hazinelerini açığa çıkaran kapsamlı bir paneli gözlemleyin. Gezegenl
Prices move for many reasons and these can vary from one operator to another: software, private and institutional traders simultaneously contribute to the formation of the price, making predictive art very difficult. However, there are measurable factors that bind the price to an underlying trend in line with the physical reality that the financial asset represents: these are the macroeconomic indicators. Large investors use this information wisely to set their strategies. Understanding these m
WARNING: This indicator is distributed EXCLUSIVELY on MQL5.com MT4 version:   https://www.mql5.com/it/market/product/160363 MT5 version:   https://www.mql5.com/it/market/product/160410 ============================================================================================= MAX RIBBON ver 1.00 The indicator that shows you the TREND clearly and unambiguously! ============================================================================================= DESCRIPTION MAX RIBBON is an advanced tre
AlgoEAs Trend Dashboard V1 Indicator for MT5 Introduction: This is a Dashboard Indicator based on 7 built in Multi Timeframe indicators. This strategy gives Buy/Sell Ideas based on 9 trend states. Easy to view gas guage to view current trend. Has as optional Alerts to enable with 9 messages. Run on M15 chart, with M15, H1, and H4 indicator time frames. Great tool! Features: Non-Repainting Dashboard For Desktop MT5 Only, Works On Any Mt5 Pair Great for Intraday and Swing Trading Easy view gas
+++++++++++++++++++++++++++++++++++++++++++++++++++++++++++++++++++++++++++++++++++++++++++++++++ +++ Link to EURUSD Only Free Version -->  https://www.mql5.com/en/market/product/156904?source=Unknown +++++++++++++++++++++++++++++++++++++++++++++++++++++++++++++++++++++++++++++++++++++++++++++++++ Hallo Trader, This is a traditional GANN & FIBONACCI strategy based on detection of an impulsive move in the opposite direction. This is called a Breakout. At the moment of Breakout, the indicator draw
Big Player Range
Thalles Nascimento De Carvalho
5 (3)
BigPlayerRange – MT5 için En İyi Gösterge BigPlayerRange , MetaTrader 5 üzerinde Mini Endeks ve Mini Dolar için en iyi gösterge olarak kabul edilir. Bu güçlü araç, büyük oyuncuların stratejik faaliyet alanlarını vurgulayarak kurumsal teknik analizde yüksek hassasiyet sunar. BigPlayerRange Nasıl Kullanılır: Gösterge, alış bölgelerini (yeşil çizgi) ve satış bölgelerini (kırmızı çizgi) gösterir. Fiyat bu alanların dışına kapandığında trend oluşma olasılığı yüksektir. Yeşil çizginin üzerinde
Historical Similarity Matcher Indicator (HI.SI.MA) Try it free today — demo version now available!   https://www.mql5.com/en/market/product/167114 Overview The Historical Similarity Matcher is a technical analysis indicator for MetaTrader 5. It scans historical price data to find segments that show statistical similarity to a user-selected reference period on the chart.
IVISTscalp5
Vadym Zhukovskyi
5 (6)
What's new about iVISTscalp5 forecast indicator (Version 10)? iVISTscalp5 is a unique nonlinear forecasting for a week ahead system for any financial instrument which executes fast scalping using time levels. iVISTscalp5 is a tool for easy study and understanding of financial market. 1) iVISTscalp5 forecast indicator has been completely rewritten into another programming language (C++), which has accelerated data loading and processing. As a result, a different graphical display of forecasts
##   ONLY GOLD ##   Тiльки Золото ## **Mercaria Professional Trading Zones - Complete Guide** ## **Mercaria Professional Trading Zones - Повний посібник** ### **How Mercaria Zones Work / Як працюють зони Mercaria** **English:** Mercaria Zones is an advanced trading indicator that identifies high-probability support and resistance areas using ZigZag extremes combined with mathematical zone calculations. The indicator works on multiple timeframes simultaneously, providing a comprehensive view
From The Sons comes the Alpha. Our intention is to bridge institutional with retail analysis just to ensure level ground at affordable rates for us all.  The Mathematical Inevitability of Alpha: ATHENA x PROMETHEUS = Predator Pulse AI (Alpha)  In the global theater of finance, the "retail trader" is often just liquidity for the giants. To survive, you don't need a better indicator; you need a fundamental shift in how you perceive reality. The ATHENA x PROMETHEUS system is not a tool—it is a mat
Filtrele:
İnceleme yok
İncelemeye yanıt