R breaker Variation

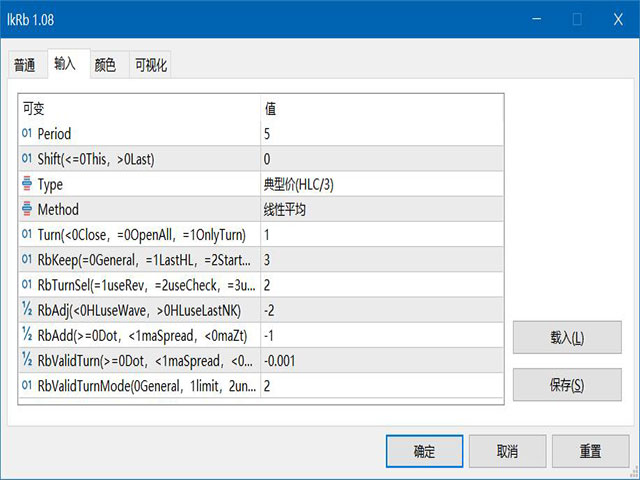
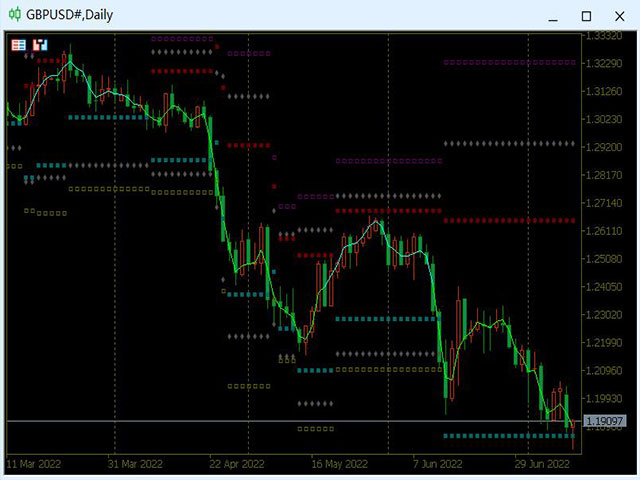
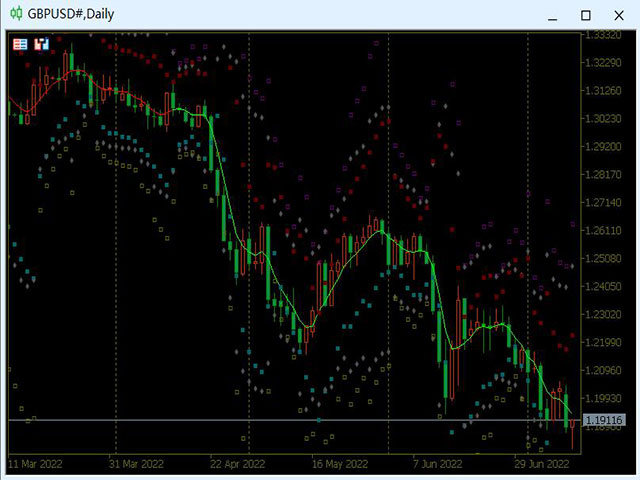
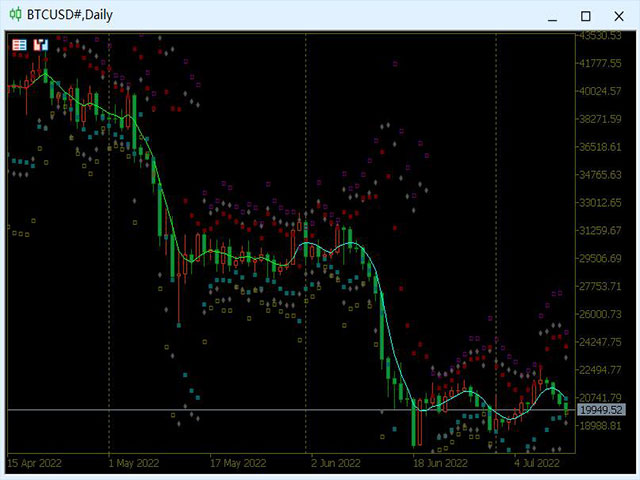
In the Forex trading system, the Pivot Points trading method is a classic trading strategy. Pivot Points is a very simple resistance support system. Based on yesterday’s highest, lowest and closing prices, seven price points are calculated, including one pivot point, three resistance levels and three support levels.
The resistance line and the support line are one of the tools that are often used in technical analysis, and the role of the support line and the pressure line can be mutually transformed. From a trading point of view, Pivot Point is like a combat map, pointing out the support and resistance price that should be paid attention to by investors. As for the specific tactical cooperation, Pivot Point does not specifically stipulate it, depending on the investor itself.
For this trading strategy. Investors can flexibly formulate strategies based on intraday prices and related trends in pivot points, support levels and resistance levels, and can even manage position adjustments based on key points.


Önerilen ürünler
Double Fractal Entry Bot trades automatically using fractal breakouts or rebounds. It detects precise entry points, places SL and TP based on market structure, and includes logic to manage risk and avoid false signals. Simple, smart, and powerful. This product is also available for MetaTrader 4 =>  https://www.mql5.com/en/market/product/143609 Double Fractal Entry Bot is an intelligent trading robot based on the proven logic of the Double Fractal Entry indicator. It analyzes price using upper a
DYJ WITHDRAWAL PLAN: Trend Dönüşüm Ticaret Sistemi 1. DYJ WITHDRAWAL PLAN Nedir? DYJ WITHDRAWAL PLAN , piyasa trendinin yön değiştirdiği anları otomatik olarak tespit eden ve   otomatik alım-satım (pozisyon açma ve kapama)   işlemlerini gerçekleştiren akıllı bir   trend dönüşüm ticaret sistemidir . Sistem,   her türlü işlem enstrümanı ve tüm aracı kurumlarla (broker)   uyumlu çalışır. İster   Forex   ister   Sentetik Endeksler   olsun, her platformda sorunsuz şekilde işlem yapabilir. 2. Temel Ö
MTF Market Structure ZigZag is a multi-timeframe structure indicator for MetaTrader 5. It maps ZigZag-based swing structure from up to four selected timeframes onto the active chart and helps traders read trend continuation and structural shifts more clearly. The indicator can display: ZigZag swing lines market structure labels: HH, HL, LH, LL BOS (Break of Structure) events CHoCH (Change of Character) events optional horizontal break lines shifted to the right BOS and CHoCH are confirmed by can
I recommend you to read the   product's blog  (manual) from start to end so that it is clear from the beginning what the indicactor offers. This multi time frame and multi symbol trend indicator sends an alert when a strong trend or trend reversal has been identified. It can do so by selecting to build up the dashboard using Moving average (single or double (both MA:s aligned and price above/below both)), RSI, Bollinger bands, ADX, Composite index (Constance M. Brown), Awesome (Bill Williams), 
The ABC Indicator analyzes the market through waves, impulses, and trends, helping identify key reversal and trend-change points. It automatically detects waves A, B, and C, along with stop-loss and take-profit levels. A reliable tool to enhance the accuracy and efficiency of your trading. This product is also available for MetaTrader 4 =>  https://www.mql5.com/en/market/product/128179 Key Features of the Indicator: 1. Wave and Trend Identification:    - Automatic detection of waves based on mov
Liquidity Map
Alex Amuyunzu Raymond
Liquidity Map  Overview The Liquidity Map indicator is an advanced visualization tool based on ICT Smart Money Concepts . It automatically identifies daily Buy Zones , Sell Zones , and Liquidity Levels , showing where price is likely to reverse or continue based on institutional order flow. It calculates key levels from the daily session — such as the previous day’s high, low, and midpoint — then derives a premium (sell bias) and discount (buy bias) structure. When price trades into these mapped
Haven Market Structure PRO - Profesyonel Piyasa Analistiniz Karşınızda  Haven Market Structure PRO  – bu sadece bir indikatör değil, Fiyat Hareketi (Price Action) ve Akıllı Para Konseptleri (Smart Money Concepts) gibi temel kavramlara dayanan, fiyat hareketi analizini otomatikleştiren eksiksiz bir sistemdir. Bu PRO sürümü, grafik üzerinde maksimum kontrol sahibi olmak ve piyasanın tam resmini görmek isteyen yatırımcılar için oluşturulmuştur. Diğer ürünler ->  BURADA Piyasa yapısını anlamak, kâr
The indicator scans for TD Sequential signals in multiple timeframes for the all markets filtered and shows the results on Dashboard. Key Features Dashboard can be used for all markets It can scan for signals on MN1, W1, D1, H4, H1, M30, M15 ,M5, M1 timeframes Parameters UseMarketWatch: Set true to copy all symbols available in market watch MarketWatchCount : Set the number of symbols that you want to copy from the market watch list. CustomSymbols: Enter the custom symbols that you want to be a
BtcAI
Novin Ghasemi Nik
BTC AI Ticaret Botu - AI Entegrasyonu ile Gelişmiş Kripto Ticaret Kanal bağlantısı:   https://www.mql5.com/en/channels/btcai ÖNEMLİ GERİ TEST UYARISI Bu Uzman Danışman, geri test ile canlı ticaret için farklı stratejiler kullanmaktadır: Geri Test Modu: Geleneksel teknik göstergelere dayanan basitleştirilmiş bir strateji kullanır. Canlı Ticaret: Piyasa duyarlılığı, haber etkisi ve karmaşık desen tanıma dahil olmak üzere tam AI analizi uygular. Geri test sonuçları, bu temel farklılıklar ned
Fibonacci Pullback EA
Rodrigo Alejandro Stemann Henriquez
Fibonacci Pullback EA detects the latest valid swing via symmetric pivots and projects a configurable Fibonacci level across that range. When the previous closed candle wicks into that level and confirms on close , the EA places an order with SL at the swing extreme plus a points buffer , and TP at the opposite swing extreme. Designed originally for EURUSD M30 and USDJPY M30 , yet fully configurable. Signal logic Determines the latest bearish or bullish swing using symmetric pivots. Computes a F
SMC Structure Markup
Seyed Mohammad Hosseini Hejazi
4.67 (15)
Overview The Smart Money Structure Markup Indicator for MetaTrader 5 is a powerful tool designed to help traders identify key market structures based on popular Smart Money Concepts (SMC) strategies. This indicator detects micro-market structures, providing insights into price movements and potential trend changes. It highlights important elements such as valid Break of Structure (BOS), Change of Character (CHoCH), and Inducement (IDM), helping traders to make informed decisions. Key Features Ma
FREE
Apex Level MT5
Solomon Ndirangu Macharia
Apex Level MT5 is a high discipline, stable and long term growth momentum EA designed to exploit significant price levels in the market. It doesn't guess where the market might go, it waits for the market to commit to a direction and then follows the flow and by focusing on daily liquidity expansion, the EA avoids the noise of midday trading which results in a cleaner equity curve and high quality setups. EA philosophy Quality over Quantity: The Ea focuses on the most important breakout levels o
​ IMPORTANT ANNOUNCEMENT: REBRANDING & MAJOR UPGRADE ​Institutional Trap Finder has now been officially upgraded and rebranded to GOLD TRAP MASTER PRO (SMC SCALPER) V2.0. ​We have completely overhauled the logic, improved the recovery factor, and optimized it specifically for XAUUSD (Gold). When you download this product, you are getting the latest V2.0 PRO version with all premium features included! ​ Gold Trap Master Pro (SMC Scalper) V2.0 ​ Stop being the Liquidity. Start trading with the
Breakout MV
Emmanouil Bampalos
Breakout MV :  This Expert Advisor offers you one of the most fundamental trading strategy,  combining Moving Average and Volums indicators!  Key Features : Consistent Performance : Breakout strategy has demonstrated a robust performance across various market conditions, by capitalizing on significant price movements. Strategic Trade Execution : We select the desired range, and once the price approaches these levels and the indicators confirm our entry, we open a trade. The trade will close eit
FREE
Born to Kill Zone  is a trading strategy in the financial markets where traders aim to profit from short- to intermediate-term price movements.  In conducting the analysis, this EA incorporates the use of a moving average indicator . As we are aware, moving averages are reliable indicators widely utilized by professional traders Key components include precise entry and exit strategies, risk management through stop-loss orders, and position sizing. Swing trading strikes a balance between active
Pulsar X
Dmitriq Evgenoeviz Ko
PULSAR X — Gold Market Momentum Monitoring The XAUUSD market doesn't forgive simple decisions. High volatility, false breakouts, and aggressive reactions to news make classic indicator-based strategies vulnerable. PULSAR X is a next-generation algorithmic system designed to accurately operate in market congestion and impulse exhaustion conditions. This is not a trend bot or an averaging mechanism. PULSAR X analyzes the moment when crowd pressure loses its force and the market moves from chaos t
Bu çoklu zaman dilimi ve çoklu sembol göstergesi, stokastik sinyal hattının stokastik ana hattını ne zaman kestiğini tanımlar. Alternatif olarak, stokastik aşırı alım/satış alanından ayrıldığında (ana hattı kesen sinyal hattı olmadan) uyarı verebilir. Bonus olarak Bollinger bantlarını ve RSI aşırı alım/satış çaprazlarını da tarayabilir. Kendi kurallarınız ve tekniklerinizle birleştiğinde bu gösterge, kendi güçlü sisteminizi yaratmanıza (veya geliştirmenize) izin verecektir. Özellikler Piyasa İzl
Algo octa
Firas Al-qasimi
Algo Octa - Indicateur d'Analyse Technique Avancé Indicateur professionnel combinant ZigZag, SAR parabolique, canaux de tendance et niveaux de Fibonacci pour une analyse technique complète.  if you don't understand how to use Technical Support via product feedback or MQL5 messaging system.  Fonctionnalités Principales Analyse Multi-Composants  ZigZag coloré avec détection automatique des extremums  Intégration du SAR parabolique pour la confirmation de tendance  Création automatique de canau
Session Volume Profile — Daily + Weekly Know where the volume is. Trade with the market, not against it. What It Does Session Volume Profile maps exactly where volume was traded across price — for the current day and optionally the full trading week. Updated in real time, directly on your chart. At a glance you can see where the market accepted price, where it rejected it, and where the key reference levels are for the session ahead. No repainting. No clutter. Just clean, actionable levels. Key
Cobra Mis
Vitalii Zakharuk
A fundamental technical indicator that allows you to assess the current market situation in order to enter the market of the selected currency pair in a trend and with minimal risk. This indicator was created on the basis of the original extreme search indicators, the indicator is well suited for determining a reversal or a big sharp jerk in one direction, thanks to it you will know when this will happen, he will notify you with the appearance of a blue dot for buying red for sale. It basical
Signal Eskiya, in addition to channel lines, reflects entry signals in the form of arrows. Trading strategies using the channel indicator belong to the classic methods of technical analysis, are easy to execute, and therefore available even to beginners. Price ranges work equally well on any trading assets and timeframes, they can be used both independently and with additional confirmation from oscillators and market volumes. American traders say: “Trend is your friend”, which means “Trend is
Optimal F Service Application Type: Service Application Functions: Calculation of the optimal fraction and trade volume to achieve maximum growth of the equity curve, based on the results of previous trades. About this app Capital management is the most crucial and often underestimated component of any trading system. Proper capital management can enhance—and sometimes significantly improve—the performance of your trading algorithm. This application automatically calculates the optimal fractio
Kullanım Kılavuzu NEXA Pivot Scalper PRO Genel Bakış NEXA Pivot Scalper PRO, MetaTrader 5 platformu için geliştirilmiş otomatik bir işlem sistemi (Expert Advisor)dır. Program, fiyatın Pivot seviyeleri yakınındaki davranışını analiz eder ve teknik göstergeler kullanarak kısa vadeli piyasa koşullarını değerlendirir. Birden fazla işlem koşulu aynı anda karşılandığında işlemler otomatik olarak açılır. Expert Advisor, önceden tanımlanmış işlem kuralları ve risk yönetimi kurallarına göre çalışır. Ürün
FREE
Adaptive Market-Structure Grid (AMSG) Indicator Overview The Adaptive Market-Structure Grid (AMSG) is a custom indicator for MetaTrader 5 designed to visualize evolving market structure through adaptive grid levels. It detects price swings, constructs dynamic grids, and adjusts to changing volatility conditions. The indicator helps traders observe how market structure shifts between trending and ranging phases. How It Works AMSG continuously evaluates price data to identify swing highs and low
Send me a message so I can send you the setfile Birkaç yapılandırma seçeneği bulunan sağlam robot, Aşağıdaki ekran görüntüsündeki ayarlarla 10 dakikalık bir zaman diliminde BTC ile kullanın. Uzman robotu satın aldığınızda, botu geliştirmeye devam etmek için değişiklik talep etme hakkına sahipsiniz. Temel Özellikler Hareketli Ortalama Geçiş Stratejisi: EA, işlem sinyalleri üretmek için iki hareketli ortalama (MA1 ve MA2) kullanır. Daha hızlı MA'nın (MA1) daha yavaş MA'nın (MA2) üstüne veya
Pivot Scenario Dashboard is a compact trading indicator designed to display daily pivot-based market structure in a clean and professional dashboard. It automatically calculates the main pivot level, support and resistance zones, and scenario-based market bias for the current symbol. The indicator helps traders quickly identify: main pivot level bullish and bearish trigger areas support and resistance levels target projection levels current market scenario in a compact dashboard Main Features: D
HenGann
Ehsan Kariminasab
Hengann Sq, using artificial intelligence, mathematical algorithms, Fibonacci, 9 Gann and Fibonacci square strategy, which enables us to have win rate of 200% profit per month. Initial investment for minimum capital of $100 to $1000, you be able to adjust the volume, date, hour, day and profit limit. adjustable profit limit in both buy and sell positions. Able to place orders in all time frames from 5 minutes to a week. further adjustment enables you to open the position according your desir
NEXY is a professional multi-timeframe trading system based on Market Structure (HH/HL/LH/LL) and Fibonacci Retracement zones.  CORE STRATEGY: The EA identifies pivot points (higher highs, higher lows, lower highs, lower lows) to determine the market structure. Once the main structure is established, it calculates Fibonacci retracement zones (0.618-0.786) where the price is likely to retrace before continuing in the direction of the trend. You can select which timeframes to align with the main
Aurum Quant Logic – Profesyonel XAUUSD Algoritması Aurum Quant Logic, yalnızca XAUUSD (Altın) piyasası için ve H1 zaman diliminde çalışmak üzere geliştirilmiş özel bir işlem sistemidir. Yüksek riskli Grid veya Martingale botlarının aksine, bu EA tamamen nicel analiz, volatilite kırılım mantığı ve katı risk yönetimine dayanır. Uzun vadeli kullanım için tasarlanmıştır; ADX (Average Directional Index) filtresiyle desteklenen dinamik kanal kırılım stratejisi kullanarak yüksek olasılıklı hareketleri
An updated version is now available free of charge. Ver. 034.33   is available. Basics Currency Pair: EUR-USD 5 Minute Display and set the 5-minute chart of EUR-USD. Adjustments may be necessary depending on the broker. In particular, entry is controlled by " エンベロープミドル偏差"  and the ATR 1H value. About Envelope Middle Deviation " エンベロープミドル偏差" is closer to 1.0, the easier it is to enter the market, but at the same time, the rate of being cut-risk increases. About  ATR EntryLimit   ATR Entry Li
FREE
Bu ürünün alıcıları ayrıca şunları da satın alıyor
Divergence Bomber
Ihor Otkydach
4.9 (87)
Bu göstergeyi satın alan herkese aşağıdaki ekstra içerikler ücretsiz olarak sunulmaktadır: Her işlemi otomatik olarak yöneten, Stop Loss ve Take Profit seviyelerini ayarlayan ve işlemleri strateji kurallarına göre kapatan özel yardımcı araç: "Bomber Utility" Göstergenin farklı varlıklar üzerinde kullanılmasına yönelik ayar dosyaları (set dosyaları) Bomber Utility için 3 farklı modda kullanım sunan ayar dosyaları: "Minimum Risk", "Dengeli Risk" ve "Bekle-Gör Stratejisi" Bu ticaret stratejisini hı
Power Candles V3 - İlk Kendi Kendini Optimize Eden Güç Göstergesi Power Candles V3 , güç analizini doğrudan işlem yapılabilir bir sisteme dönüştürür. Gösterge artık grafiğinizi yalnızca piyasa gücüne göre renklendirmekle kalmaz; arka planda canlı bir otomatik optimizasyon çalıştırır ve sembolünüz için en iyi Stop Loss, Take Profit ve sinyal eşiğini size sunar. Tek tıklama ile bu ayar canlı işlem için devreye girer. Bu araç Stein Investments ekosisteminin bir parçasıdır.  18 aracın tümünü keşfed
Grabber System MT5
Ihor Otkydach
4.83 (23)
Size mükemmel bir teknik gösterge olan Grabber’ı tanıtıyorum. Bu araç, kullanıma hazır bir “her şey dahil” işlem stratejisi olarak çalışır. Tek bir yazılım kodu içinde güçlü piyasa teknik analiz araçları, işlem sinyalleri (oklar), uyarı işlevleri ve push bildirimleri entegre edilmiştir. Bu göstergeyi satın alan herkes aşağıdaki hediyeleri ücretsiz olarak alır: Açık emirleri otomatik yönetmek için Grabber Yardımcı Aracı Kurulum, yapılandırma ve nasıl işlem yapılacağını adım adım anlatan video kıl
Bu indikatörü satın alırsanız, Profesyonel Trade Manager’ımı  + EA ÜCRETSİZ olarak alacaksınız. Öncelikle, bu Ticaret Sistemi'nin Non-Repainting, Non-Redrawing ve Non-Lagging Göstergesi olduğunu vurgulamak önemlidir, bu da hem manuel hem de robot ticareti için ideal hale getirir. Online kurs, kılavuz ve ön ayarları indir. "Smart Trend Trading System MT5", yeni ve deneyimli tüccarlar için özelleştirilmiş kapsamlı bir ticaret çözümüdür. 10'dan fazla premium göstergeyi birleştiriyor ve 7'den fazla
SignalTech MT5 is a trading system for EURUSD, USDCHF, USDJPY, AUDUSD, NZDUSD, EURJPY, AUDJPY, NZDJPY, CADJPY H2 and H3 Timeframe.  It can generate signals with Buy/Sell Arrows and Pop-Up/Sound Alerts. Each signal has clear Entry and Stop Loss levels, which should be automatically flagged on the chart, as well as potential Targets 1, 2, and 3. The Entry and TP levels are fixed after the trade is taken. The exit level is dynamic. If there are signs of a potential short-term trend reversal, the
Trend Screener Pro MT5
STE S.S.COMPANY
4.85 (104)
Trend Göstergesi, Trend Alım Satım ve Filtreleme için Çığır Açan Benzersiz Çözüm, Tüm Önemli Trend Özellikleriyle Tek Bir Araç İçinde Yerleştirildi! Forex, emtialar, kripto para birimleri, endeksler ve hisse senetleri gibi tüm sembollerde/araçlarda kullanılabilen %100 yeniden boyamayan çoklu zaman çerçevesi ve Çoklu para birimi göstergesidir. Trend Screener, grafikte noktalarla ok trend sinyalleri sağlayan etkili bir trend trend göstergesidir. Trend analizörü göstergesinde bulunan özellikler: 1.
Tanıtım       Quantum Breakout PRO   , Breakout Bölgeleri ile ticaret yapma şeklinizi değiştiren çığır açan MQL5 Göstergesi! 13 yılı aşkın ticaret tecrübesine sahip deneyimli tüccarlardan oluşan bir ekip tarafından geliştirilmiştir.       Kuantum Breakout PRO       yenilikçi ve dinamik koparma bölgesi stratejisiyle ticaret yolculuğunuzu yeni zirvelere taşımak için tasarlanmıştır. Kuantum Breakout Göstergesi, size 5 kar hedefi bölgesi ile kırılma bölgelerinde sinyal okları ve kırılma kutusuna da
Top indicator for MT5   providing accurate signals to enter a trade without repainting! It can be applied to any financial assets:   forex, cryptocurrencies, metals, stocks, indices .  Watch  the video  (6:22) with an example of processing only one signal that paid off the indicator! MT4 version is here It will provide pretty accurate trading signals and tell you when it's best to open a trade and close it. Most traders improve their trading results during the first trading week with the help of
Quantum TrendPulse
Bogdan Ion Puscasu
5 (23)
SuperTrend   ,   RSI   ve   Stochastic'in   gücünü tek bir kapsamlı göstergede birleştirerek işlem potansiyelinizi en üst düzeye çıkaran nihai işlem aracı olan   Quantum TrendPulse'u   tanıtıyoruz. Hassasiyet ve verimlilik arayan yatırımcılar için tasarlanan bu gösterge, piyasa trendlerini, momentum değişimlerini ve en uygun giriş ve çıkış noktalarını güvenle belirlemenize yardımcı olur. Temel Özellikler: SuperTrend Entegrasyonu:   Güncel piyasa trendlerini kolayca takip edin ve karlılık dalgası
Azimuth Pro
Ottaviano De Cicco
5 (7)
Azimuth Pro V2: Synthetic Fractal Structure and Confirmed Entries for MT5 Overview Azimuth Pro is a multi-level swing structure indicator by Merkava Labs . Four nested swing layers, swing-anchored VWAP, ABC pattern detection, three-timeframe structural filtering, and closed-bar confirmed entries — one chart, one workflow from micro-swings to macro-cycles. This is not a blind signal product. It is a structure-first workflow for traders who care about location, context, and timing. V2 Launch Offe
Atomic Analyst MT5
Issam Kassas
3.94 (31)
Öncelikle belirtmek gerekir ki bu Ticaret Göstergesi Yeniden Çizim Yapmaz, Gecikmez ve Gecikme Göstermez, bu da hem manuel hem de robot ticareti için ideal hale getirir. Kullanıcı kılavuzu: ayarlar, girişler ve strateji. Atom Analisti, Piyasada Daha İyi Bir Avantaj Bulmak İçin Fiyatın Gücünü ve Momentumunu Kullanan PA Fiyat Hareketi Göstergesidir. Gürültüleri ve Yanlış Sinyalleri Kaldırmaya ve Ticaret Potansiyelini Artırmaya Yardımcı Olan Gelişmiş Filtrelerle Donatılmıştır. Birden fazla katmanl
Meravith MT5
Ivan Stefanov
5 (1)
Göstergе, herhangi bir noktadan hacmi analiz eder ve bu hacim için piyasanın tükeniş seviyelerini hesaplar. Meravith’in ana çizgileri: Boğa hacim tükeniş çizgisi – hedef olarak kullanılır. Ayı hacim tükeniş çizgisi – hedef olarak kullanılır. Trend çizgisi – piyasa trendini gösterir. Piyasanın boğa mı ayı mı olduğuna bağlı olarak rengi değişir ve trend desteği görevi görür. Nasıl kullanılır: Mor dikey çizgiye çift tıklayın ve istediğiniz konuma taşıyın. Her şeyi analiz edebilirsiniz – trendleri v
Btmm state engine pro
Garry James Goodchild
5 (4)
BTMM State Engine Pro is a MetaTrader 5 indicator for traders who use the Beat The Market Maker approach: Asian session context, kill zone timing, level progression, peak formation detection, and a multi-pair scanner from a single chart. It combines cycle state logic with a built-in scanner dashboard so you do not need the same tool on many charts at once. What it does Draws the Asian session range; session times can follow broker server offset or be set in inputs. Tracks level progression (L
Bu gösterge paneli, seçilen semboller için mevcut en son   harmonik kalıpları   gösterir, böylece zamandan tasarruf edersiniz ve daha verimli olursunuz /   MT4 sürümü . Ücretsiz Gösterge:   Basic Harmonic Pattern Gösterge sütunları Symbol :   seçilen semboller görünecektir Trend:   yükseliş veya düşüş Pattern :   desen türü (gartley, kelebek, yarasa, yengeç, köpekbalığı, cypher veya ABCD) Entry :   giriş fiyatı SL:   zararı durdur fiyatı TP1:   1. kar alma fiyatı TP2:   2. kar alma fiyatı TP
OmniSync Projection
Antonio-alin Teculescu
5 (1)
Chronos Fractal Engine is an innovative price projection indicator for MetaTrader 5, designed to transform your technical analysis by intelligently identifying and projecting historical price patterns. Built upon an advanced correlation algorithm and the fractal principles of the market, this powerful tool visualizes potential future price movements, giving you a unique edge in your trading decisions. What is Chronos Fractal Engine? At its core, the Chronos Fractal Engine employs a sophisticat
RelicusRoad Pro: Kantitatif Piyasa İşletim Sistemi ÖMÜR BOYU ERİŞİMDE %70 İNDİRİM (SINIRLI SÜRE) - 2.000+ TRADER'A KATILIN Neden çoğu trader "mükemmel" indikatörlere rağmen başarısız olur? Çünkü tekil kavramları boşlukta trade ederler. Bağlamı olmayan bir sinyal kumardır. Sürekli kazanmak için KONFLÜANS (UYUM) gerekir. RelicusRoad Pro basit bir ok indikatörü değildir. Tam bir Kantitatif Piyasa Ekosistemi dir. Tescilli volatilite modellemesini kullanarak fiyatın ilerlediği "Adil Değer Yolu"nu har
Bill Williams Advanced
Siarhei Vashchylka
5 (11)
Bill Williams Advanced is designed for automatic chart analysis using Bill Williams' "Profitunity" system. The indicator analyzes four timeframes at once. Manual (Be sure to read before purchasing) Advantages 1. Analyzes the chart using Bill Williams' "Profitunity" system. Signals are displayed in a table in the corner of the screen and on the price chart. 2. Finds all known AO and AC signals, as well as zone signals. Equipped with a trend filter based on the Alligator. 3. Finds "Divergence Bar
ARICoins
Temirlan Kdyrkhan
ARICoin is a powerful trading companion designed to generate high-probability entry signals with dynamic TP/SL/DP levels based on volatility. Built-in performance tracking shows win/loss stats, PP1/PP2 hits, and success rates all updated live. Key Features: Buy/Sell signals with adaptive volatility bands Real-time TP/SL/DP levels based on ATR Built-in MA Filter with optional ATR/StdDev volatility Performance stats panel (Success, Profit/Loss, PP1/PP2) Alerts via popup, sound, push, or email Cust
Meridian Pro
Ottaviano De Cicco
5 (1)
Meridian Pro: Professional Multi-Timeframe Trend Matrix for MT5 Overview Meridian Pro is a multi-timeframe trend matrix by Merkava Labs that compresses directional state, strength, momentum condition and matrix agreement into one compact panel. One adaptive engine, applied consistently from M1 to W1. No per-symbol tuning. No indicator stacking. One structured readout across every asset and every timeframe. Launch Offer — Get Meridian Pro for USD 99 (introductory). Regular price: USD 149. 1. Why
META Points PRO MT5
Polina Balahura
5 (1)
META Puanları PRO   — Piyasa hareketlerini takip eden ve alım satım işlemlerinde tahmini ortadan kaldıran, piyasanın kararını çoktan vermiş olduğu noktaları gösteren bir araçtır. Bu gösterge, trendlerin, eğilimlerin ve yapıların değiştiği kilit noktaları belirler ve fiyatın büyük oyuncuların pozisyon alması için geri döndüğü alanları vurgular. Sadece hareketi görmüyorsunuz, arkasındaki mantığı da anlıyorsunuz. Tüm sinyaller mum çubuğu kapandıktan sonra kaydedilir, yeniden çizilmez ve grafiğe kay
Advanced Supply Demand MT5
Bernhard Schweigert
4.53 (15)
Herhangi bir Acemi veya Uzman Tüccar için En İyi Çözüm! Bu gösterge benzersiz, yüksek kaliteli ve uygun fiyatlı bir ticaret aracıdır çünkü bir dizi tescilli özelliği ve yeni bir formülü bir araya getirdik. Bu güncelleme ile çift zaman dilimi dilimlerini gösterebileceksiniz. Yalnızca daha yüksek bir TF gösteremeyeceksiniz, aynı zamanda TF grafiğini ve ARTIK daha yüksek TF'yi de gösterebileceksiniz: YUVARLAK BÖLGELERİ GÖSTERMEK. Tüm Arz Talebi tüccarları buna bayılacak. :) Önemli Bilgiler Açıkland
Gann Kare Göstergesi, W.D. Gann tarafından yazılan "Piyasa Tahminleri için Matematiksel Formül" makalesine dayalı güçlü bir piyasa analizi aracıdır. Bu araç, piyasa analizi için matematiksel ve Gann teorilerini kullanarak hassas analizler gerçekleştirir. 144, 90, 52 karelerini ve ayrıca 9 karesini kullanır. Ayrıca, ın 9 karesi ve bu kareyle ilişkili kanallar ve yıldız modelleri için yöntemini içerir. Kullanıcı Kılavuzu ve Uygulama: Bu göstergeleri kullanmadan önce, kullanıcı kılavuzunu okumanız
Cvd Divergence
Thalles Nascimento De Carvalho
CVD Divergence – Profesyonel Emir Akışı ve Diverjans Analizi CVD Divergence, fiyat ile Kümülatif Delta Hacmi (CVD) arasındaki güvenilir uyumsuzlukları tespit etmek için tasarlanmış teknik bir göstergedir. Gerçek emir akışının fiyat hareketini doğrulamadığı anları yüksek hassasiyetle belirleyerek olası dönüşleri, momentum zayıflamasını ve kurumsal manipülasyonları ortaya çıkarır. Gösterge, agresif hacim analizini fiyat yapısıyla birleştirerek net, objektif ve erken sinyaller sağlar. Göstergenin Ö
Gartley Hunter Multi
Siarhei Vashchylka
5 (11)
Gartley Hunter Multi - An indicator for searching for harmonic patterns simultaneously on dozens of trading instruments and on all possible timeframes. Manual (Be sure to read before purchasing) | Version for MT4 Advantages 1. Patterns: Gartley, Butterfly, Shark, Crab. Bat, Alternate Bat, Deep Crab, Cypher 2. Simultaneous search for patterns on dozens of trading instruments and on all possible timeframes 3. Search for patterns of all possible sizes. From the smallest to the largest 4. All fou
" Dynamic Scalper System MT5 " göstergesi, trend dalgaları içinde işlem yapmak için scalping yöntemi için tasarlanmıştır. Başlıca döviz çiftleri ve altın üzerinde test edilmiştir, diğer işlem araçlarıyla uyumluluğu mümkündür. Ek fiyat hareketi desteğiyle trend boyunca pozisyonların kısa vadeli açılması için sinyaller sağlar. Göstergenin prensibi. Büyük oklar trend yönünü belirler. Küçük oklar şeklinde scalping için sinyaller üreten bir algoritma trend dalgaları içinde çalışır. Kırmızı oklar yü
Presenting one-of-a-kind Gann Indicator for XAUUSD IQ Gold Gann Levels is a non-repainting, precision tool designed exclusively for XAUUSD/Gold intraday trading. It uses W.D. Gann’s square root method to plot real-time support and resistance levels, helping traders spot high-probability entries with confidence and clarity. William Delbert Gann (W.D. Gann) was an exceptional market analyst whose trading technique was based on a complex blend of mathematics, geometry, astrology, and ancient calcul
Scalping Winning Signals Pro SWS
Muhammad Usman Siddique
5 (1)
UZFX SWS {Scalping Winning Signals} Pro v1.0, Usman Zabir (UZFX LABS) tarafından hızlı hareket eden piyasalarda kesin giriş sinyalleri arayan scalperlar, günlük tüccarlar ve swing tüccarlar için özel olarak geliştirilmiş, güçlü, yeniden boyama yapmayan bir göstergedir. Gecikme veya yanlış yeniden boyama olmadan güvenilir, gerçek zamanlı sinyaller isteyen tüccarlar için idealdir. ÖNERDİĞİM* EN İYİ ZAMAN ARALIKLARI: 30 DAKİKA VE ÜZERİ. {1 SAAT} BENİM FAVORİM. VE SONUÇLAR AKIL ALMAZ...! Temel Öze
Berma Bands
Muhammad Elbermawi
5 (8)
Berma Bantları (BB'ler) göstergesi, piyasa trendlerini belirlemeyi ve bunlardan yararlanmayı amaçlayan yatırımcılar için değerli bir araçtır. Fiyat ile BB'ler arasındaki ilişkiyi analiz ederek, yatırımcılar bir piyasanın trend veya aralıklı fazda olup olmadığını ayırt edebilir. Daha fazla bilgi edinmek için [ Berma Home Blog ] adresini ziyaret edin. Berma Bantları üç belirgin çizgiden oluşur: Üst Berma Bandı, Orta Berma Bandı ve Alt Berma Bandı. Bu çizgiler fiyatın etrafına çizilir ve genel tren
Öncelikle, bu Ticaret Aracının Non-Repainting, Non-Redrawing ve Non-Lagging Gösterge olduğunu vurgulamakta fayda var, bu da onu profesyonel ticaret için ideal hale getiriyor. Çevrimiçi kurs, kullanıcı kılavuzu ve demo. Akıllı Fiyat Hareketi Kavramları Göstergesi, hem yeni hem de deneyimli tüccarlar için çok güçlü bir araçtır. İleri ticaret fikirlerini, Inner Circle Trader Analizi ve Smart Money Concepts Ticaret Stratejileri gibi 20'den fazla kullanışlı göstergeyi bir araya getirerek bir araya
RFI levels PRO MT5
Roman Podpora
3.67 (3)
Bu gösterge, fiyat dönüş noktalarını ve fiyat geri dönüş bölgelerini doğru bir şekilde gösterir.       Başlıca oyuncular   . Yeni trendlerin nerede oluştuğunu görüyorsunuz ve her işlem üzerinde kontrolü elinizde tutarak, azami hassasiyetle kararlar alıyorsunuz. TREND LINES PRO   göstergesiyle birlikte kullanıldığında maksimum potansiyelini ortaya koyar.  VERSION MT4 Göstergenin gösterdiği şey: Yeni bir trendin başlangıcında aktivasyonla birlikte tersine dönüş yapıları ve tersine dönüş seviyeler
Yazarın diğer ürünleri
根据高开低收价格确定反转点位,画出的极点折线。 The pole polyline is drawn according to the high opening and low closing price to determine the reversal point. 参数(Args): 1.周期数(Period)。参与界限计算的K柱数量。 2.界限(Divide)。计算方式包括:         t1,顺高低价 (Buy min H,Sell max L)           t2,逆高低价 (Buy min L,Sell max H)           t3,收盘价 (Buy min C,Sell max C)           t4,开盘价 (Buy min O,Sell max O)           t5,高开低收价的一半 (HOLC/2)           t6,高开低收价的一半+1 (HOLC/2+1)           t7,高开低收价的一半+2 (HOLC/2+2) 3.跨越界限使用的价格(Price)。包括收盘价(C)和高低价(HL) 4.偏移(Of
A cross - track indicator that visually shows the current bullish/bearish trend of the market through the midline (mid track), main line (upper track), and sub-lines (lower track). Intersections or upper rail turns can be used as buying and selling positions. Parameter description: period:10 price: WEIGHTED //HIGH //LOW //OPEN //CLOSE //MEDIAN //TYPICAL //AVERAGE //WEIGHTED method:Linear weighted //Simple //Exponential //Smoothed // Linear weighted main offset:1.5 sub offset:1 base:2 counts add
K线极点轨道UD 【input 参数】 InpMyMagic: 幻数 InpShowPanel: 是否展示面板 InpOneLot: 开单量1份[最大99.99](=0最小手,>0固定手,<0>=-1净亏比,<-1净余最小亏比) InpAllLot: 总净单量,100%(=0最小手,>0固定手,<0>=-1净亏比,<-1净余最小亏比) InpLotMaxMoney: 开单量计算的最大金额(=0不管,>0超过该值即限制为该值,<0超过整数值即限制为小数倍数) InpLot1Dot1Money: 开单1手变化1点时金额变化值。(<=0自动计算(美元),>0指定) InpDotBig: 大间隔点值(>=0点值,<1三位数点差均,<0整均比) InpDotSml: 小间隔点值(>=0点值,<1三位数点差均,<0整均比) ==========   UD   ========== InpUDType: 类型(=0不开,=1常规,=4偏极,=6平台,=8慢跟,=10超前,=12跟随) InpMinWidth: 上下轨宽度最小值(>=0点值,<1三位数点差均,<0整均比) InpHTurnThr
Type(1EMA,2DEMA,3TEMA) FastPeriod SlowPeriod SignalPeriod PriceApplied ( HIGH(H) LOW(L) OPEN(O) CLOSE(C) MEDIAN(HL) TYPICAL(HLC) WEIGHTED(HLCC) ) Deviate Up Deviate Down Deviate Bar What Is Moving Average Convergence/Divergence (MACD)? Moving average convergence/divergence (MACD, or MAC-D) is a   trend-following   momentum   indicator that shows the relationship between two   exponential moving averages (EMAs)   of a   security’s   price. The MACD line is calculated by subtracting the 26-peri
The parabolic SAR indicator, developed by J. Welles Wilder Jr., is used by traders to determine trend direction and potential reversals in price. The technical indicator uses a trailing stop and reverse method called "SAR," or stop and reverse, to identify suitable exit and entry points.  The parabolic SAR indicator appears on a chart as a series of dots, either above or below an asset's price, depending on the direction the price is moving. A dot is placed below the price when it is trending u
What Is the Relative Vigor Index? The Relative Vigor Index (RVI) is a   momentum indicator   used in technical analysis that measures the strength of a trend by comparing a security's closing price to its trading range while smoothing the results using a   simple moving average   (SMA). The RVI's usefulness is based on the observed tendency for prices to close higher than they open during uptrends, and to close lower than they open in downtrends. KEY TAKEAWAYS The Relative Vigor Index (RVI) is a
Filtrele:
Değerlendirme yok
Değerlendirmeye yanıt