Moving Pivot Average Fibonacci MT5
- Göstergeler
- Sürüm: 2.0
- Etkinleştirmeler: 5

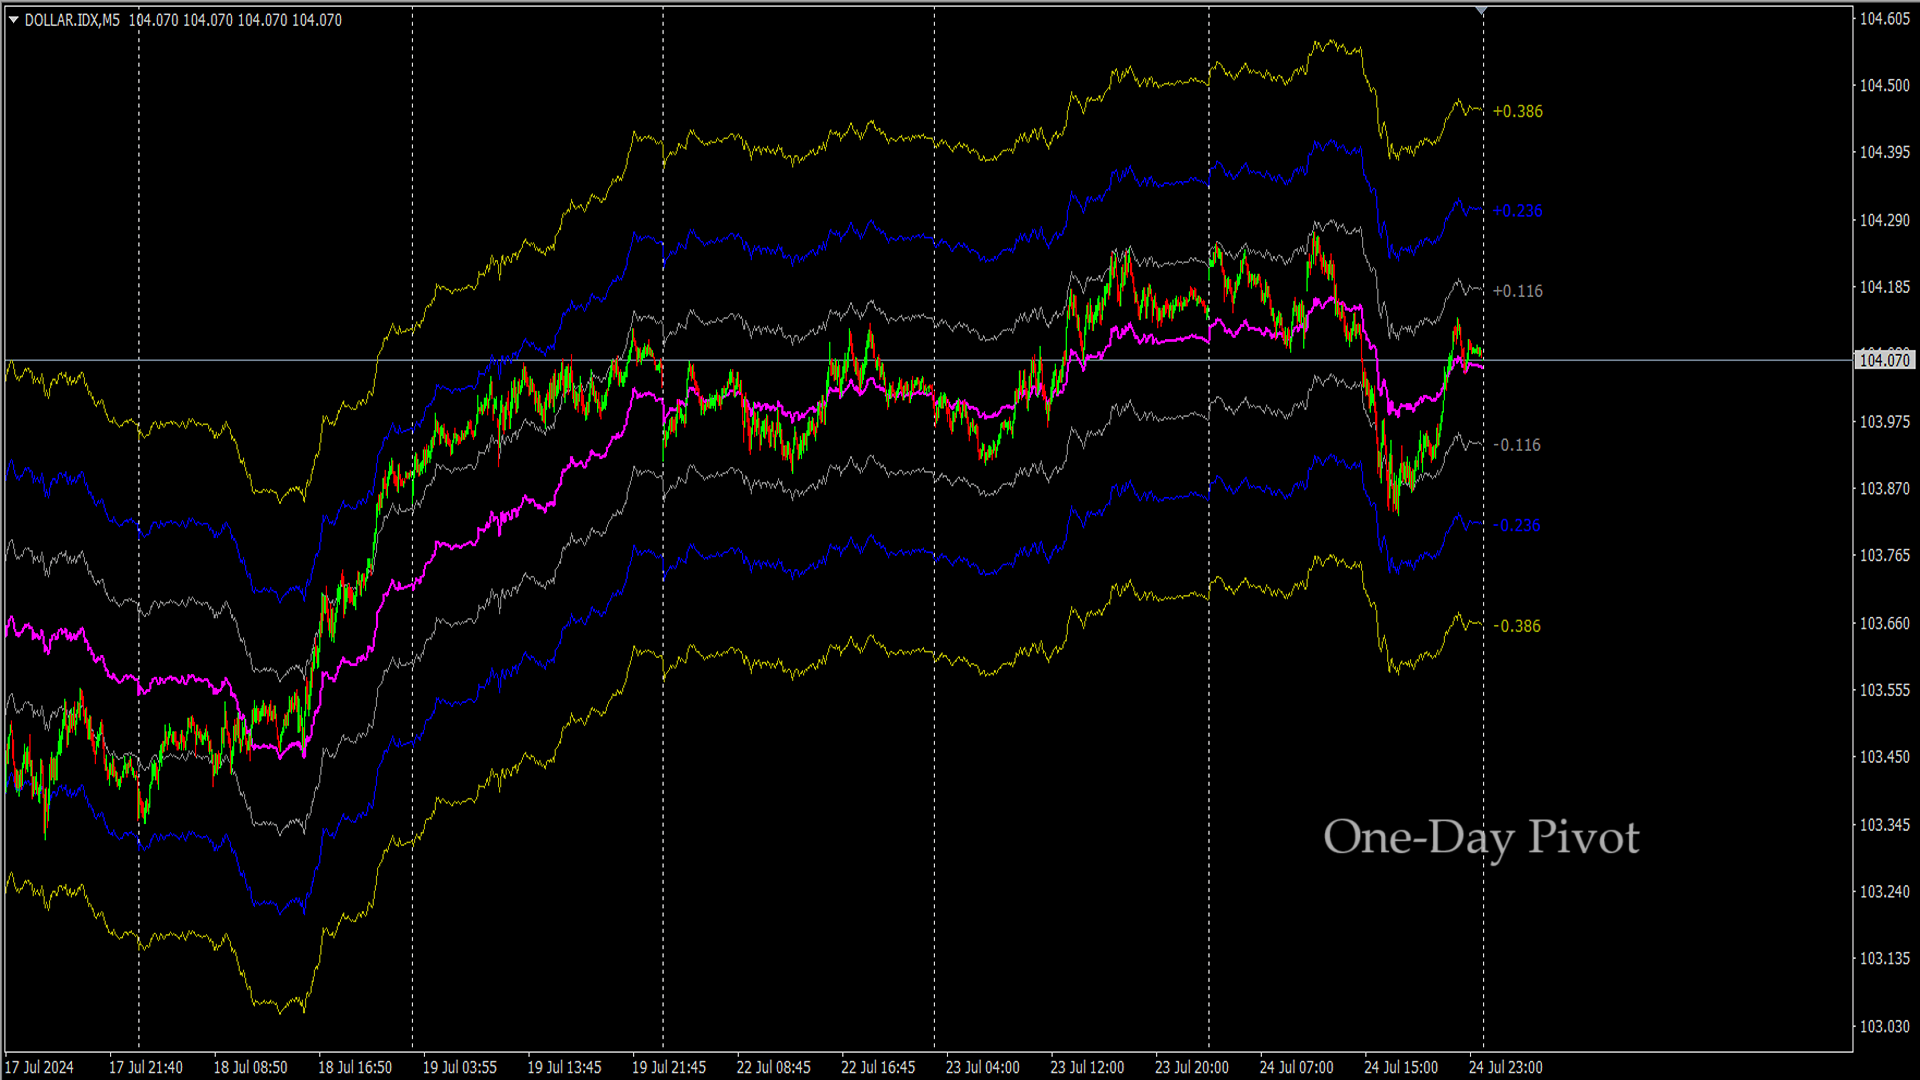
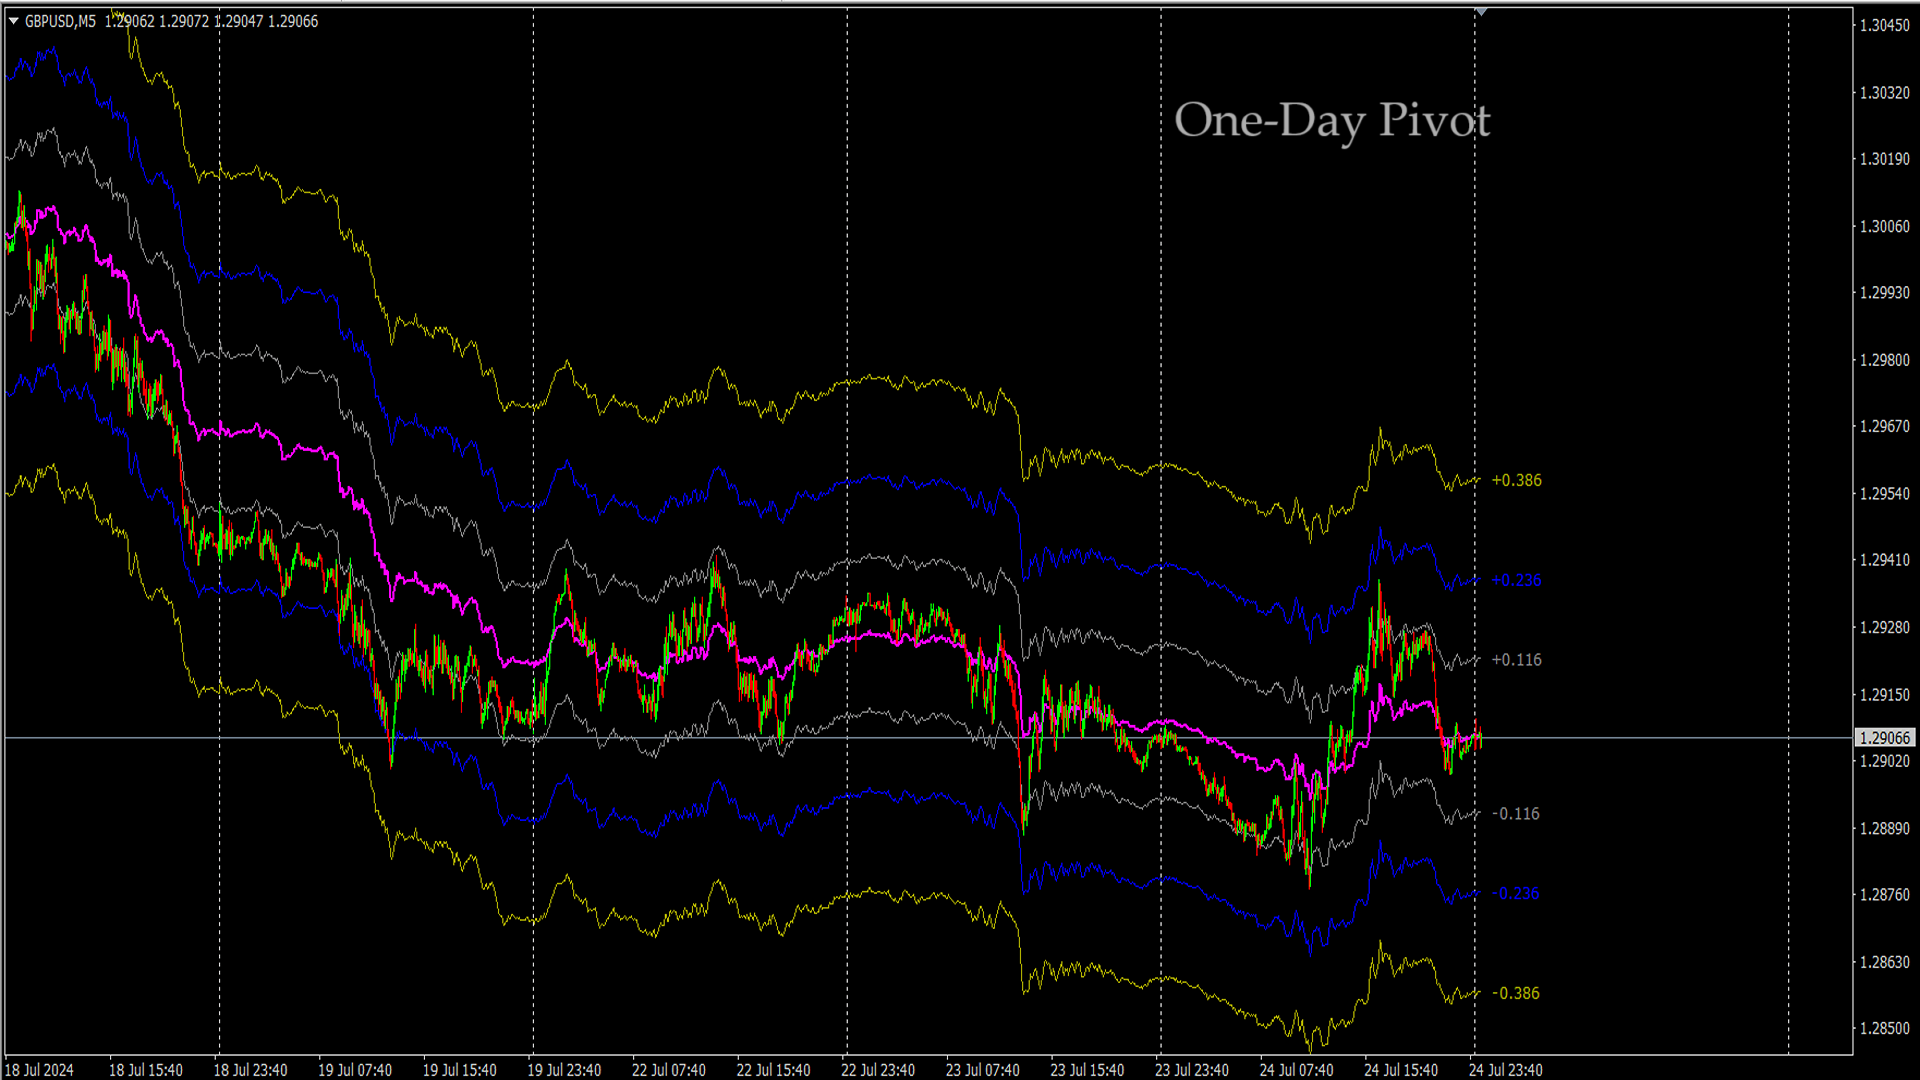
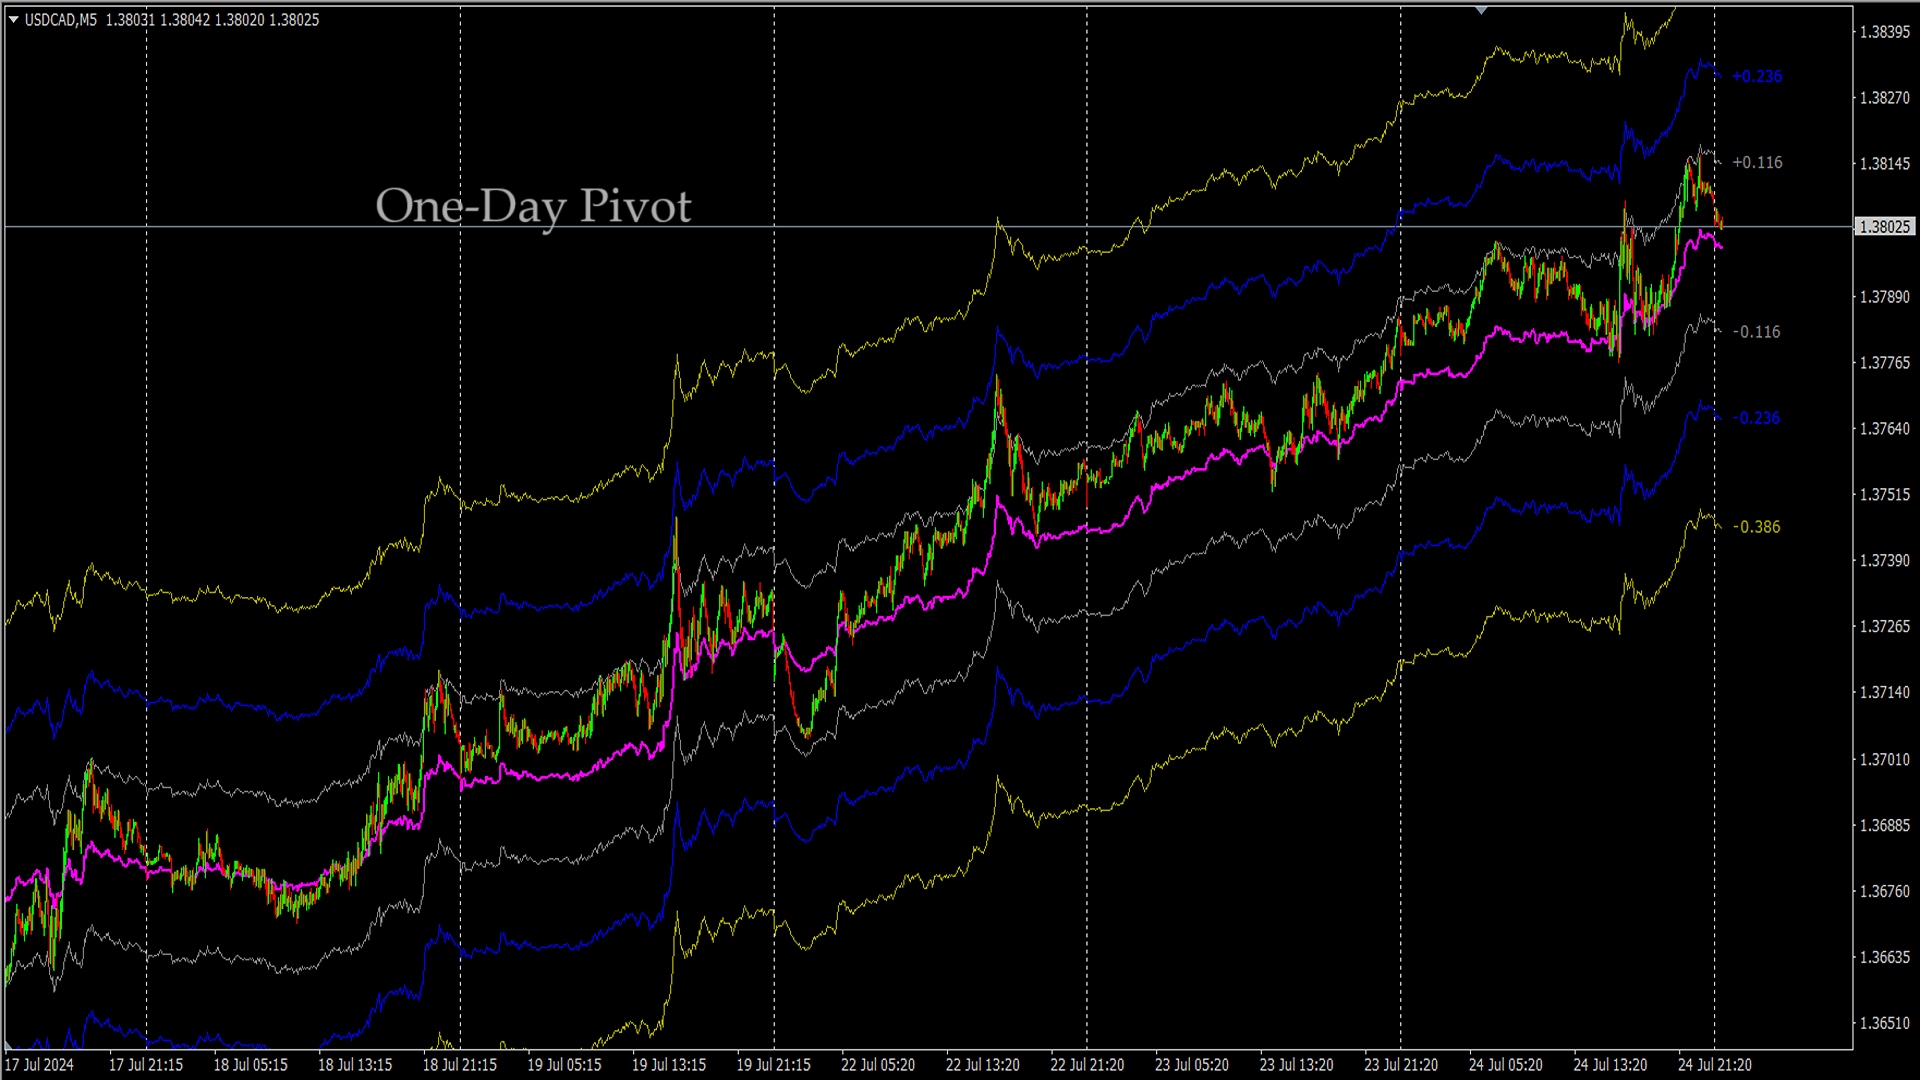
Moving pivot Average Fibonacci
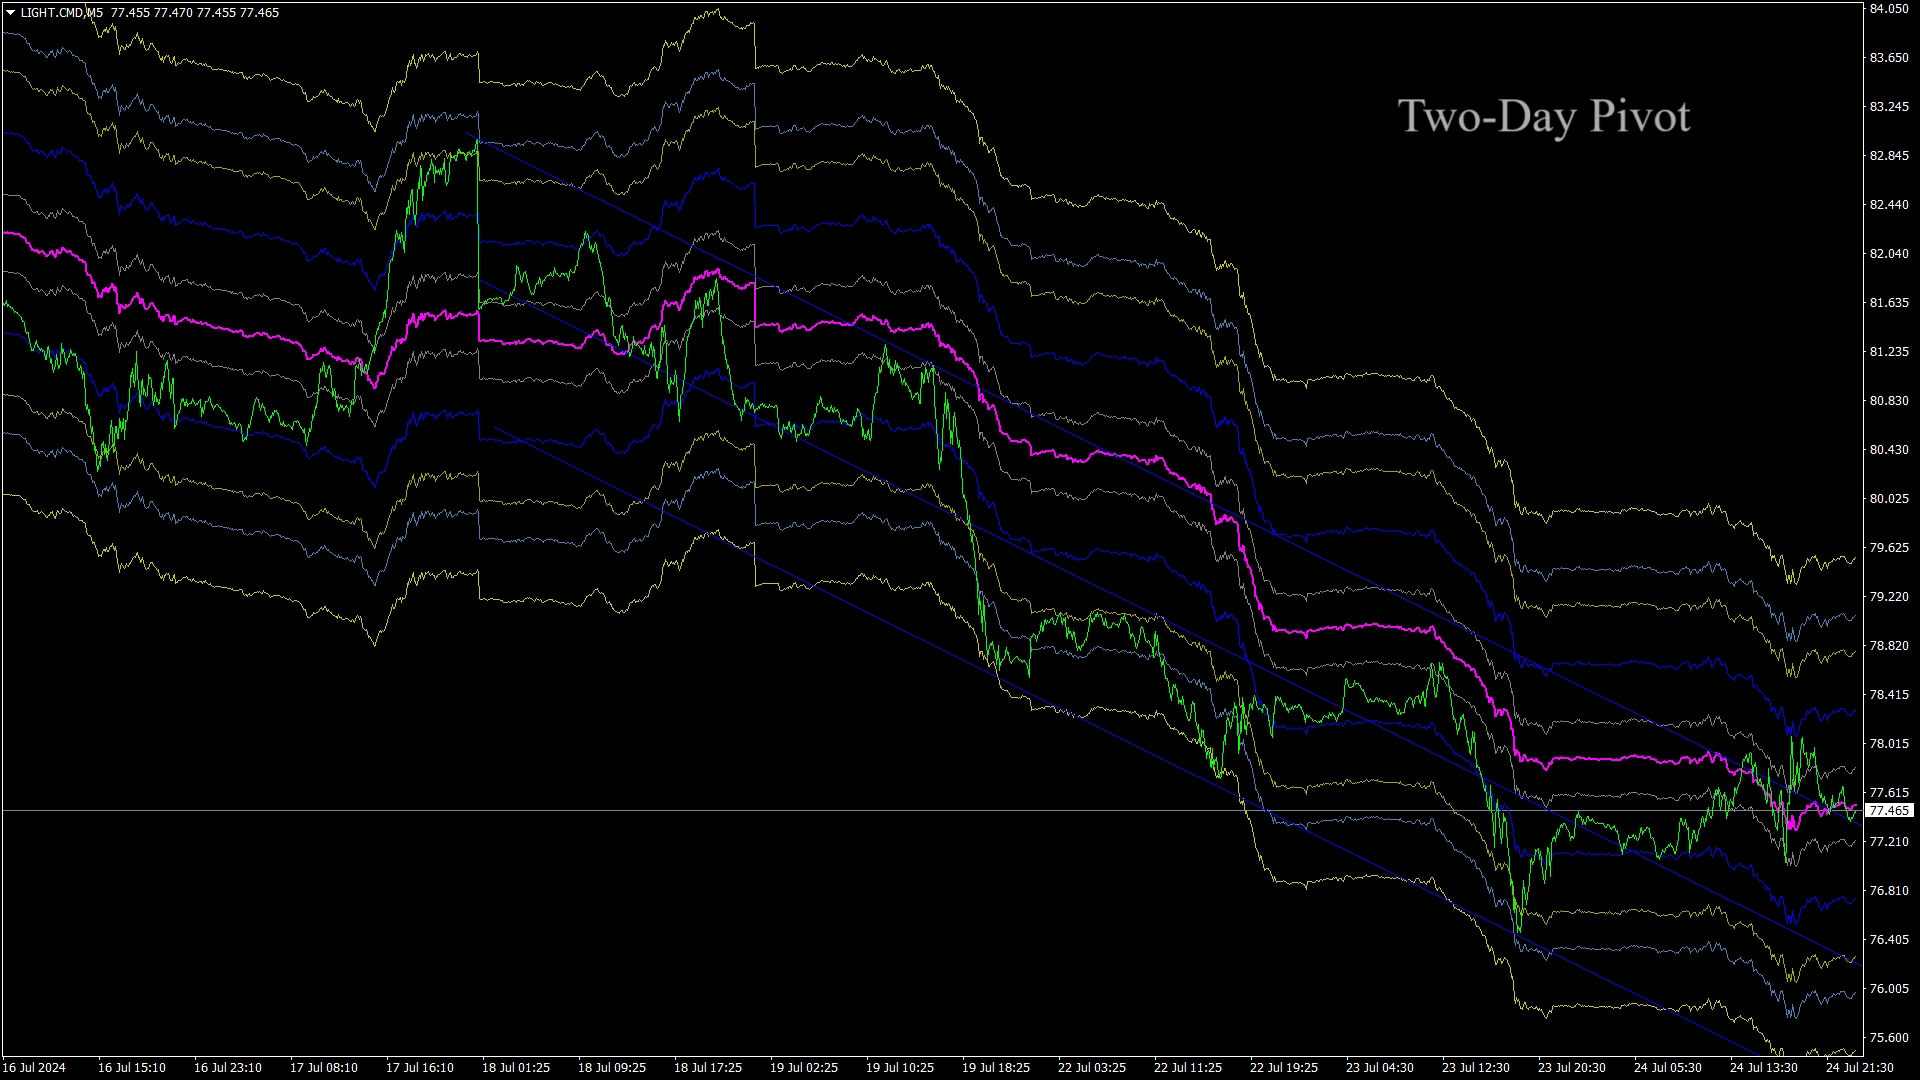
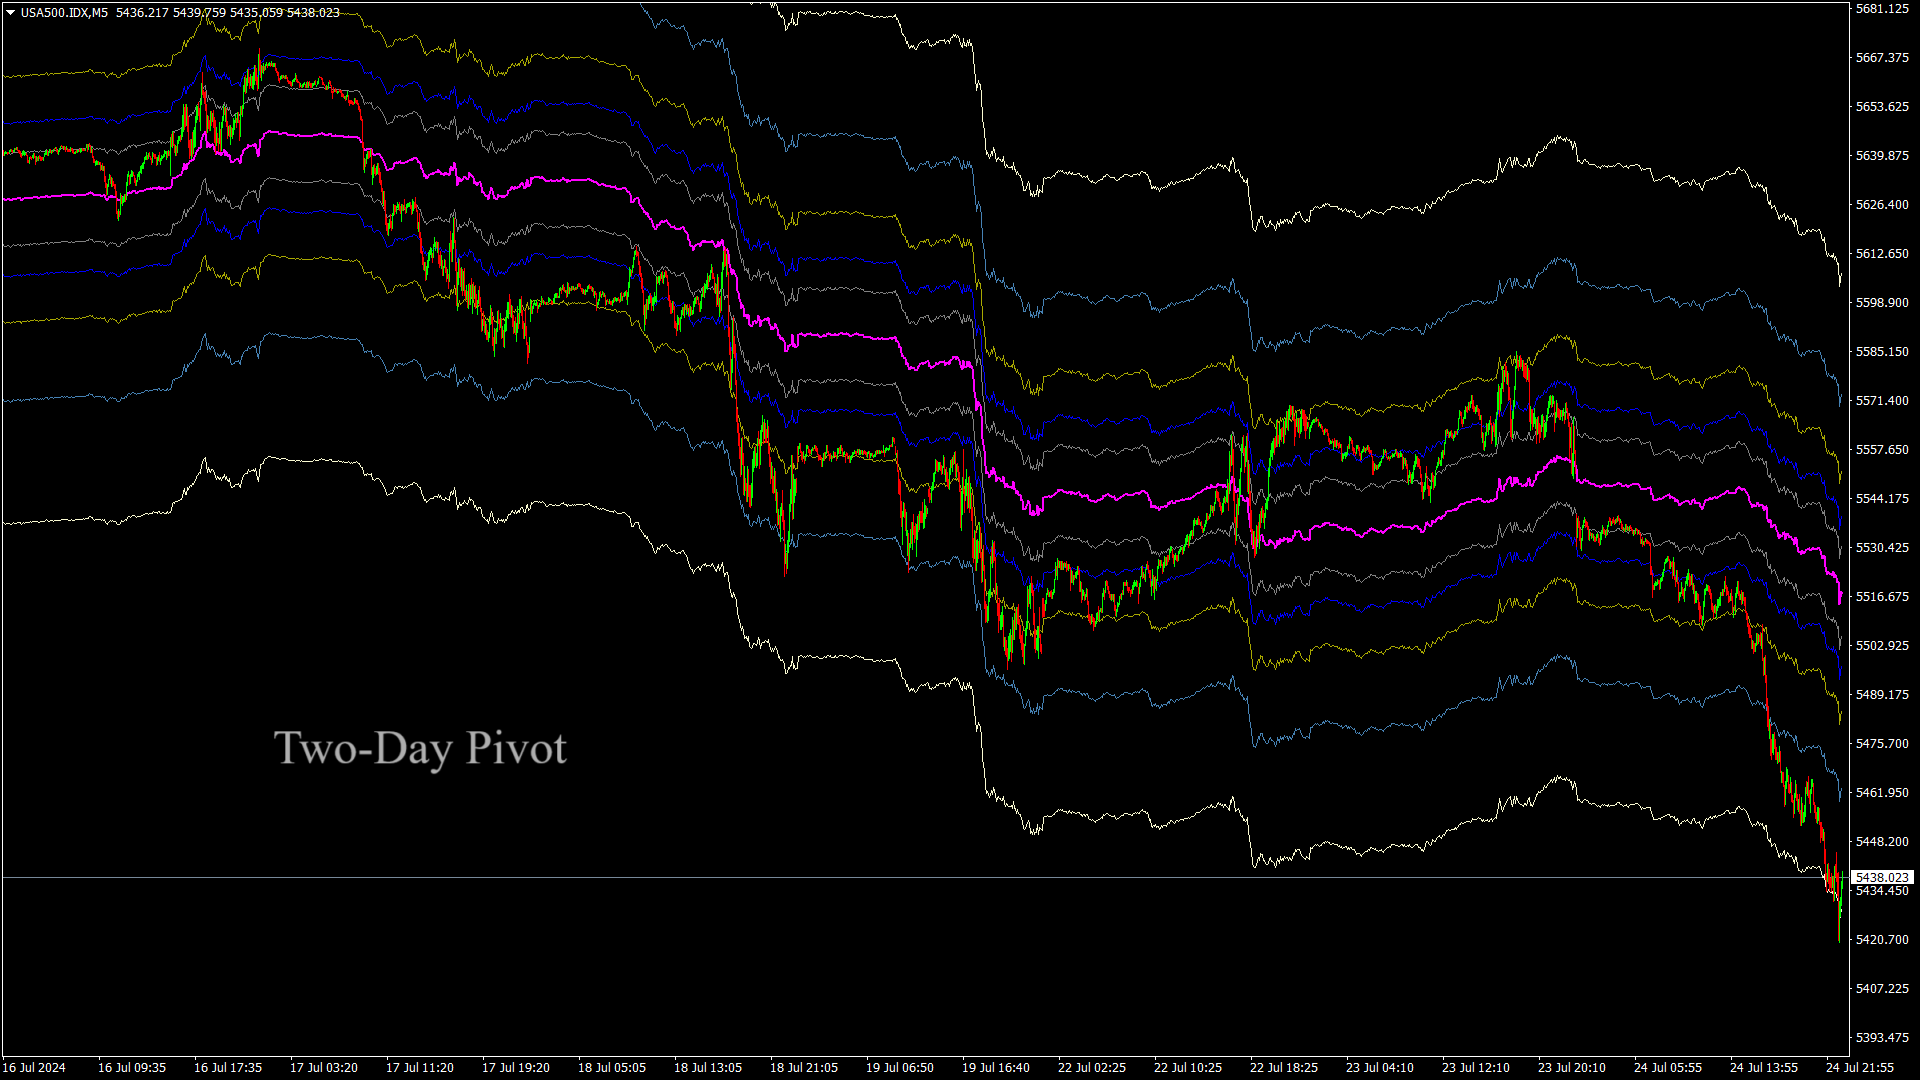
The indicator compares the selected period with its counterpart from the previous period.
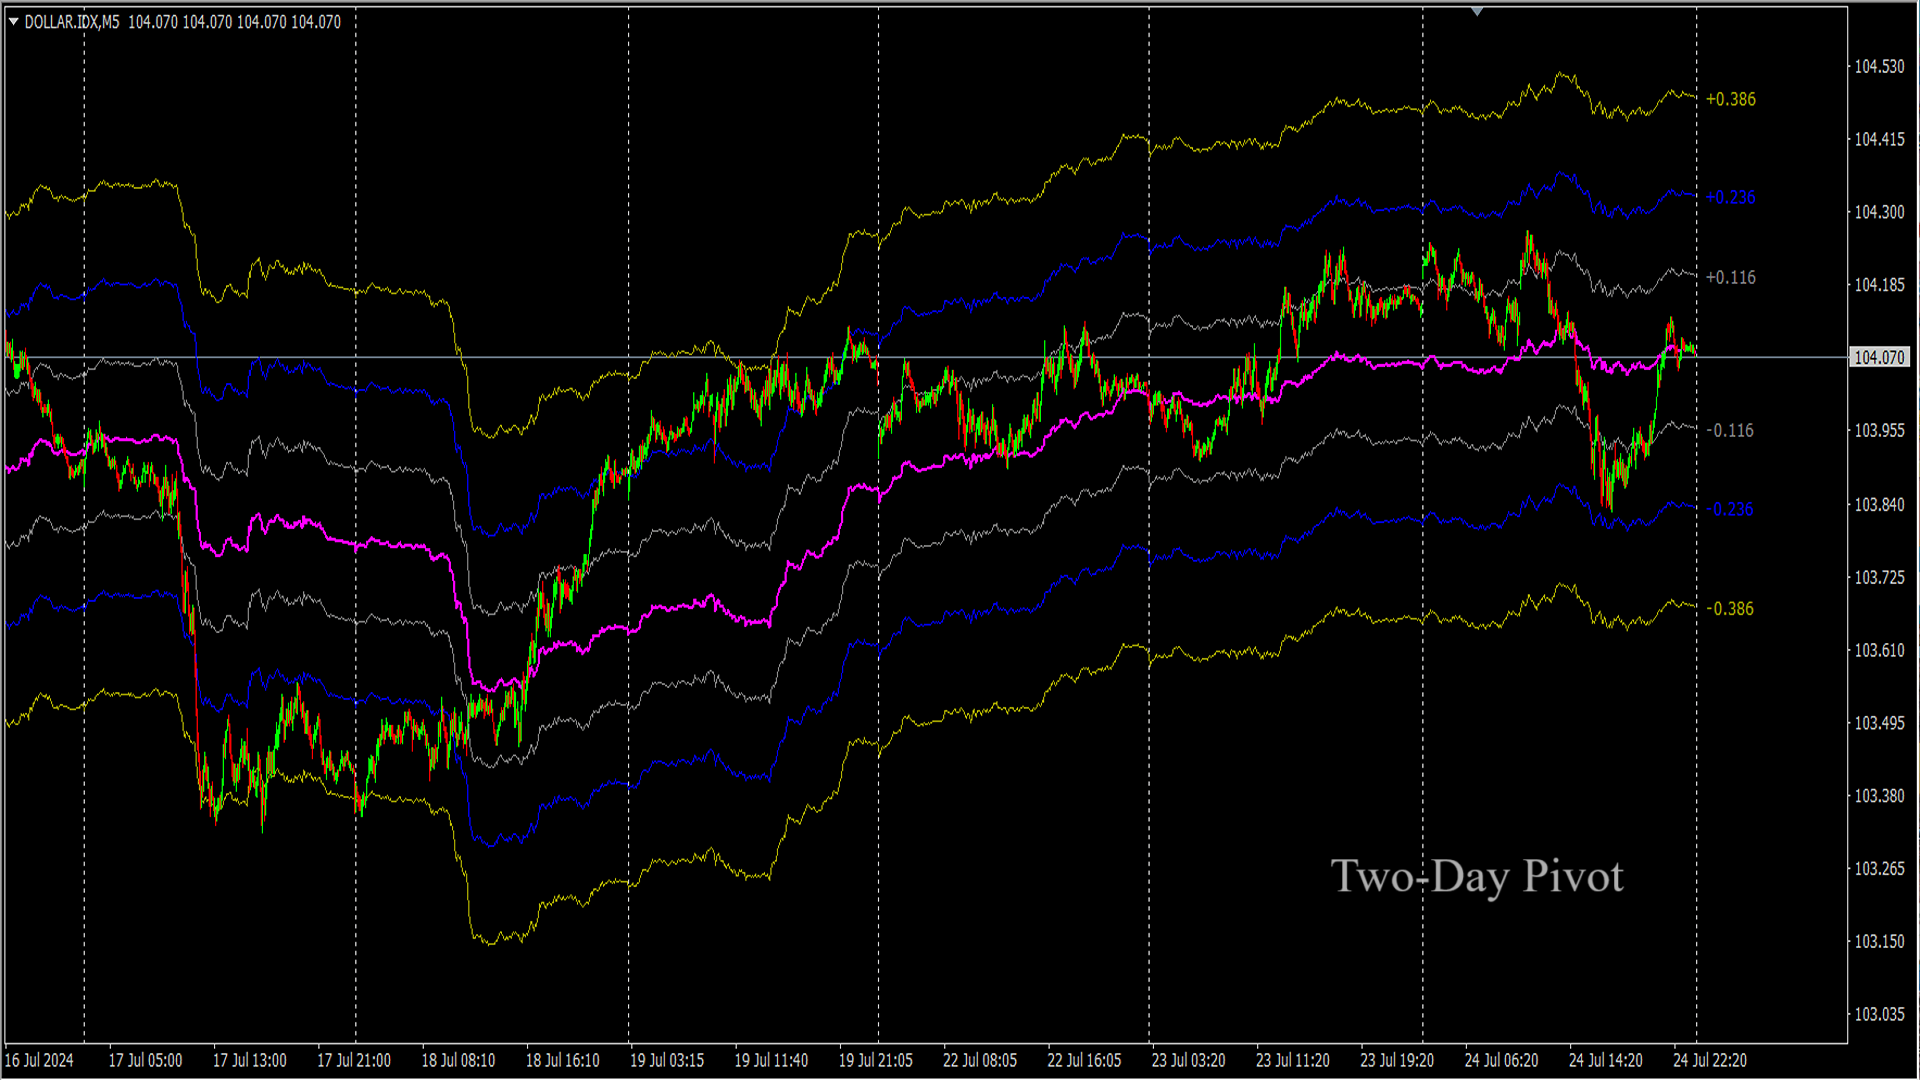
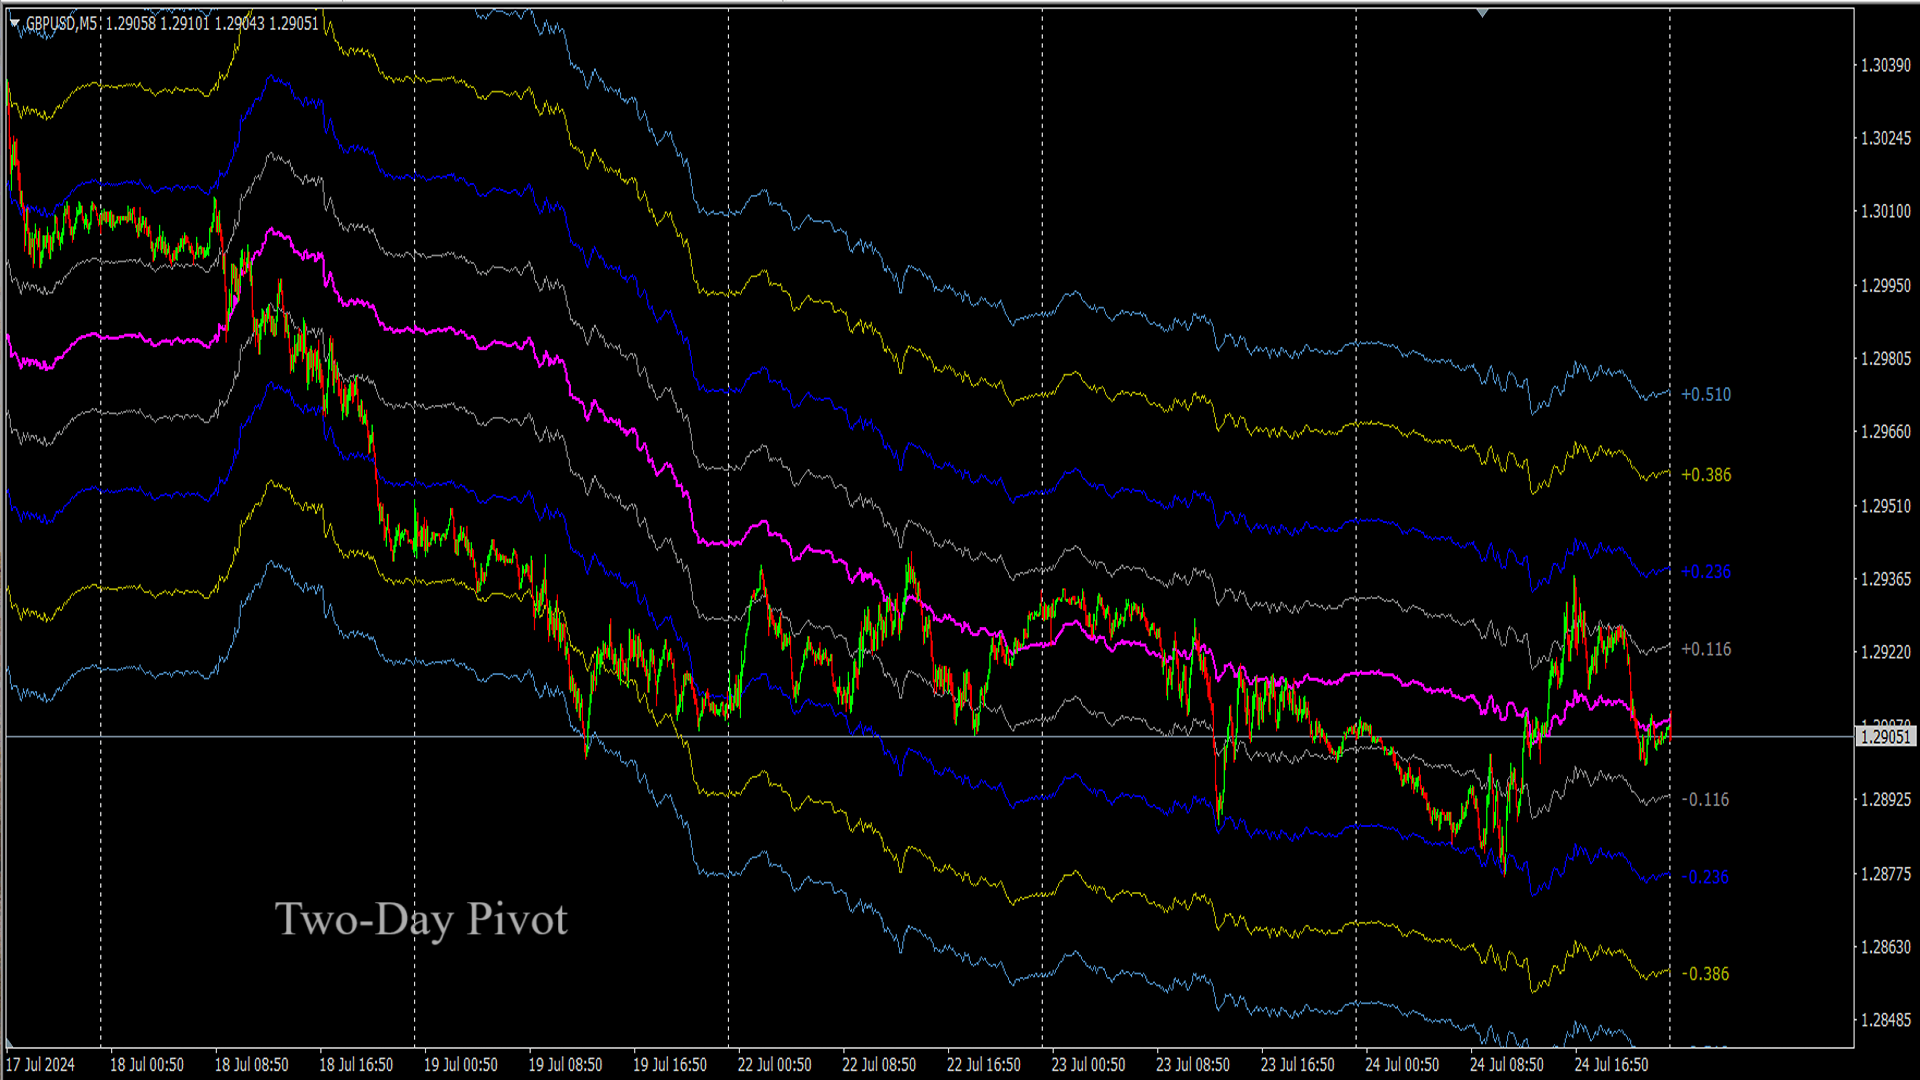
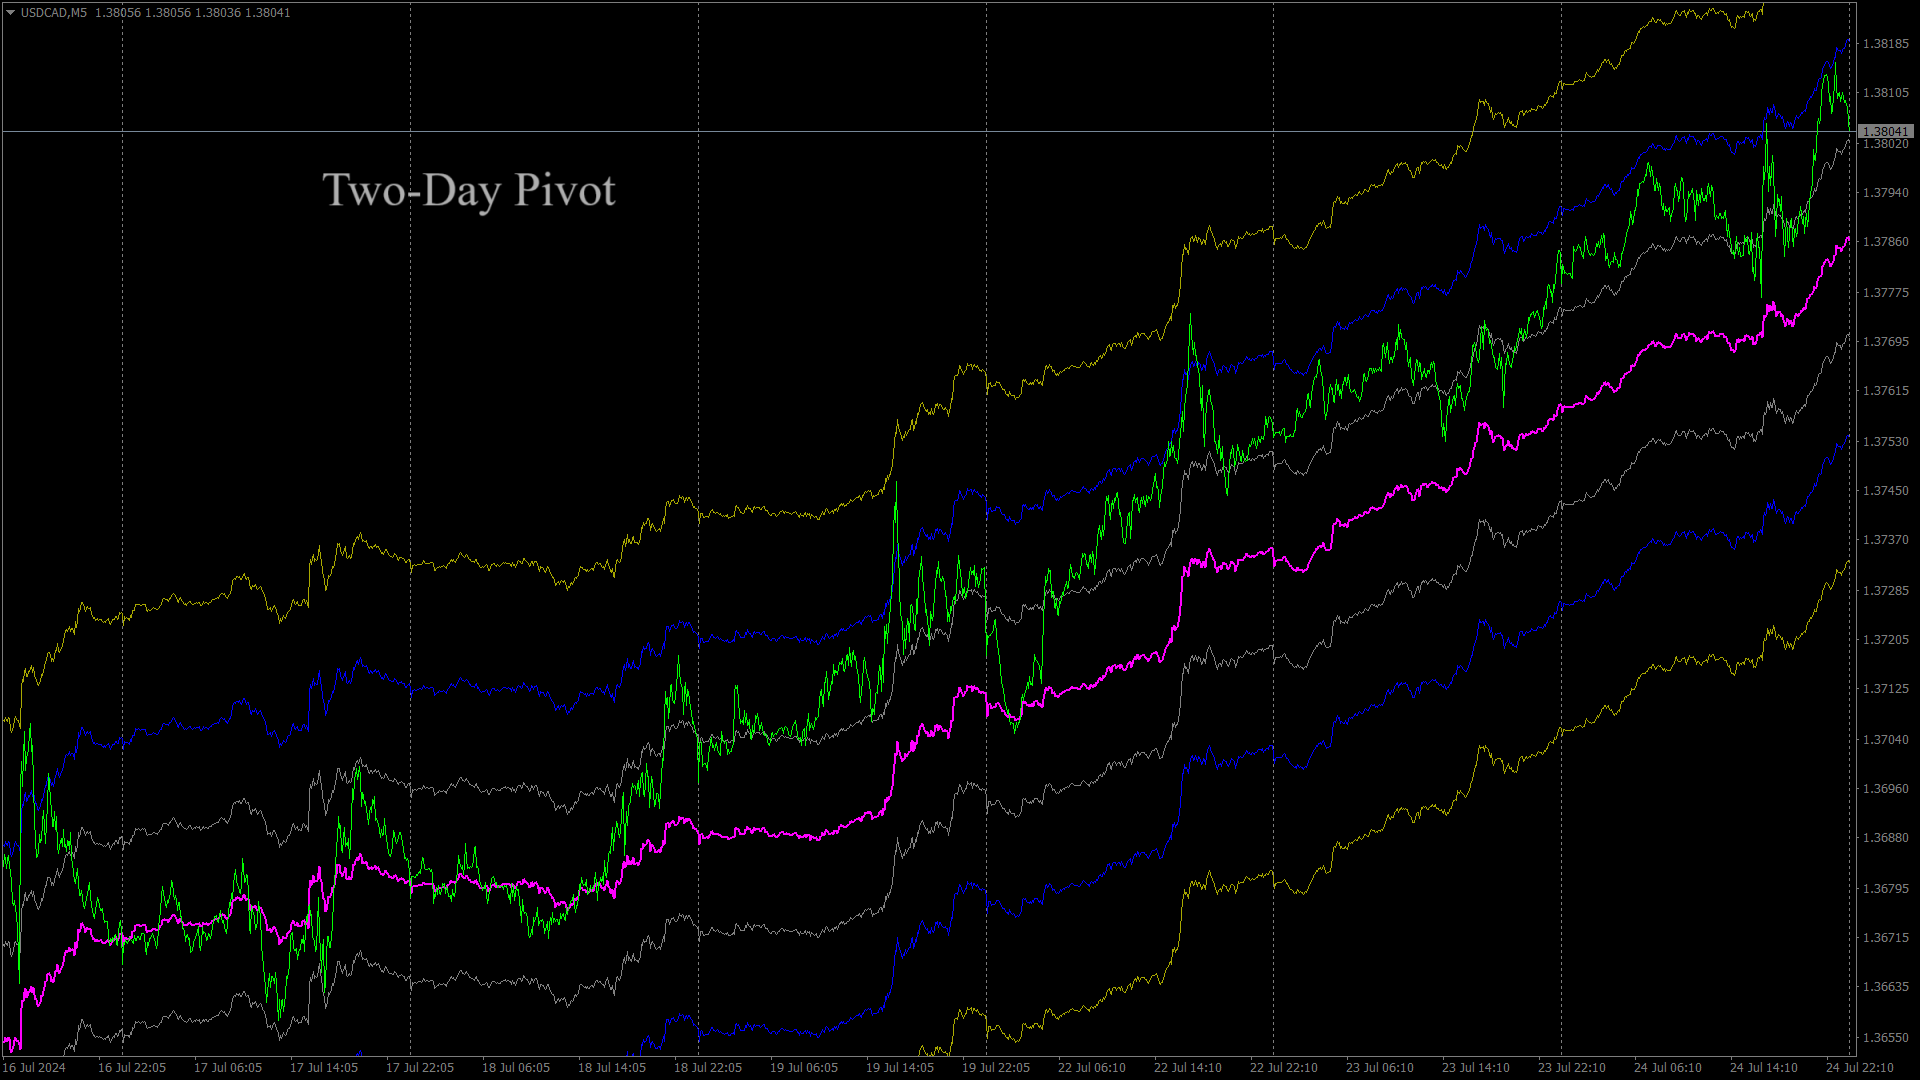
The indicator determines the moving Fibonacci levels for the day or any time interval to assess the price movement range from the time average.
The indicator helps predict the expected high or low for the day based on historical time data.
The pivot line can be considered an average trend line and use it in a variety of trading strategies.
If you have any question about the indicator, your comments are welcome.
Features
- Works for all timeframes.
- 100% non-repaint indicator.
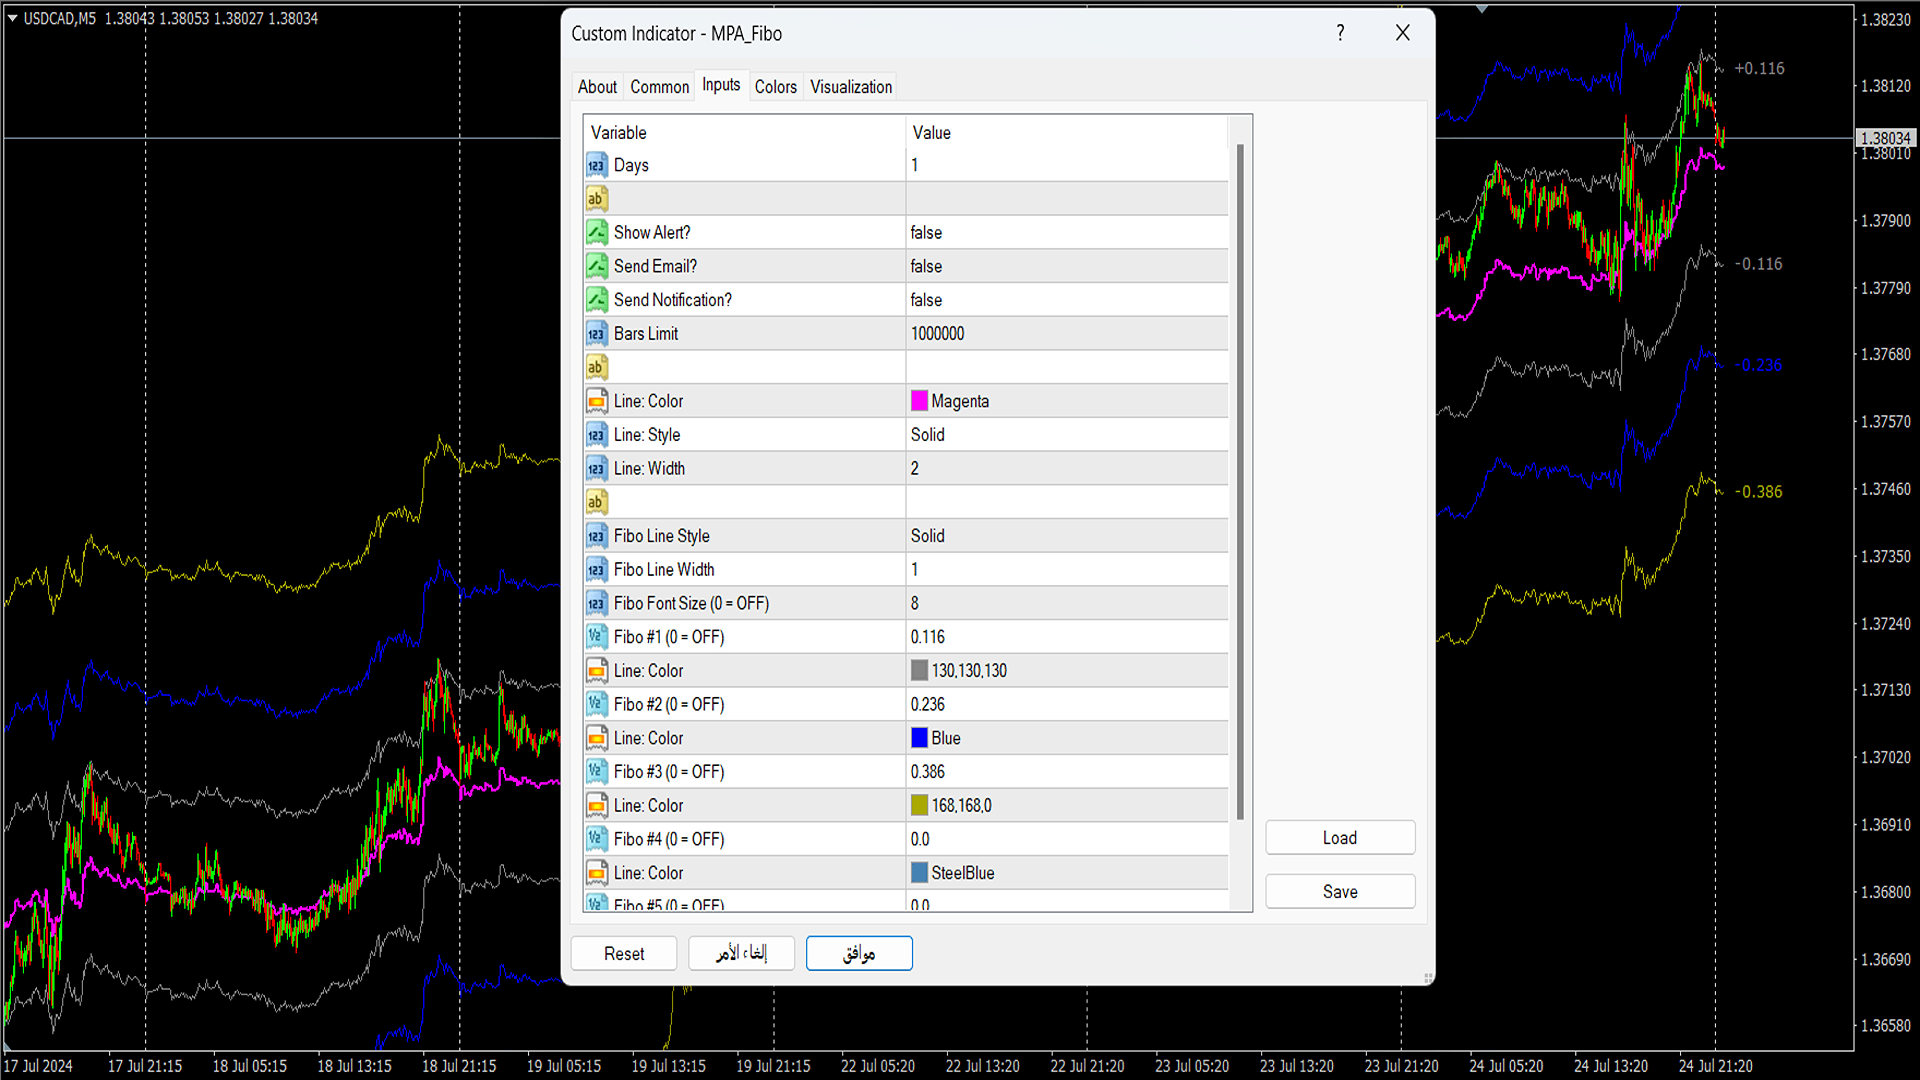
- Settings are customizable.