Liquidity Map
- Göstergeler
-
Alex Amuyunzu Raymond
 I’m an experienced MQL5 developer and software engineer specializing in building robust, high-performance algorithmic trading systems for MetaTrader 5. My work goes beyond standard EA development — I design intelligent, scalable solutions that combine market logic, automation, and external
 - Sürüm: 1.0
- Etkinleştirmeler: 5
Liquidity Map
Overview
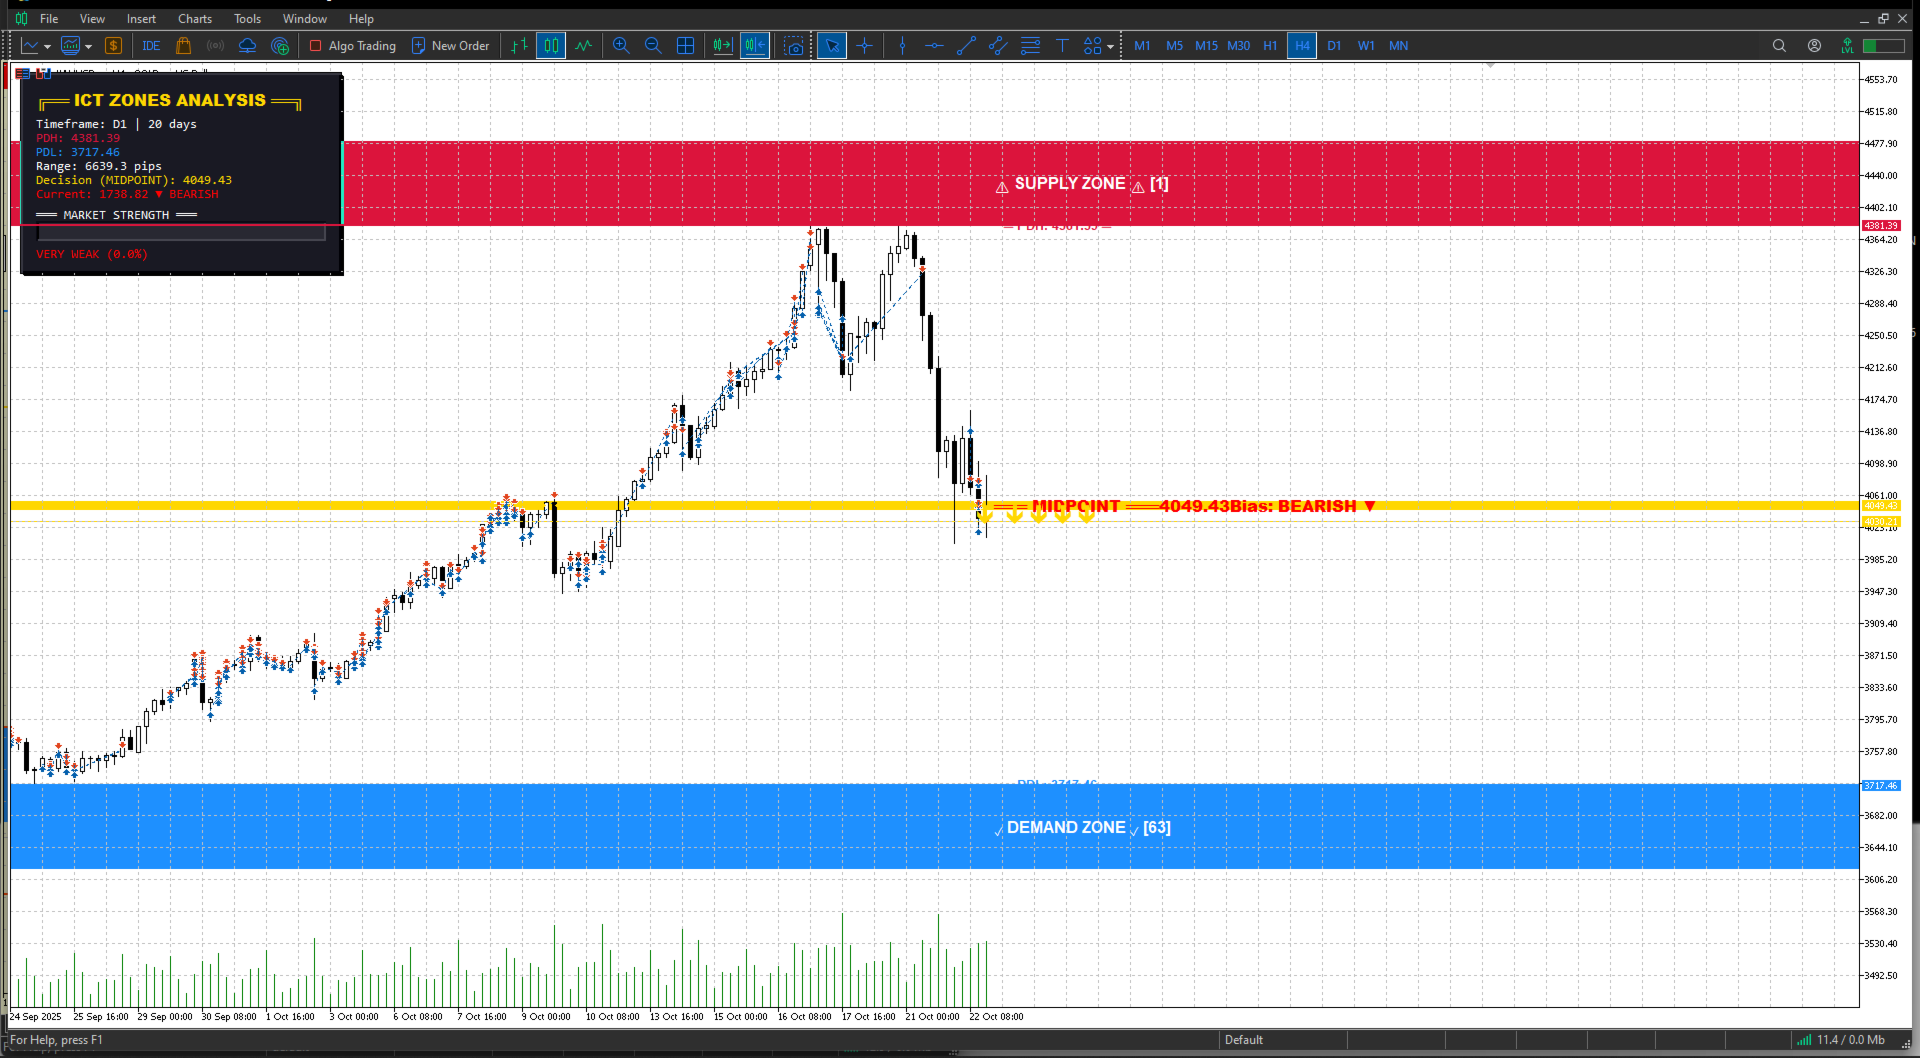
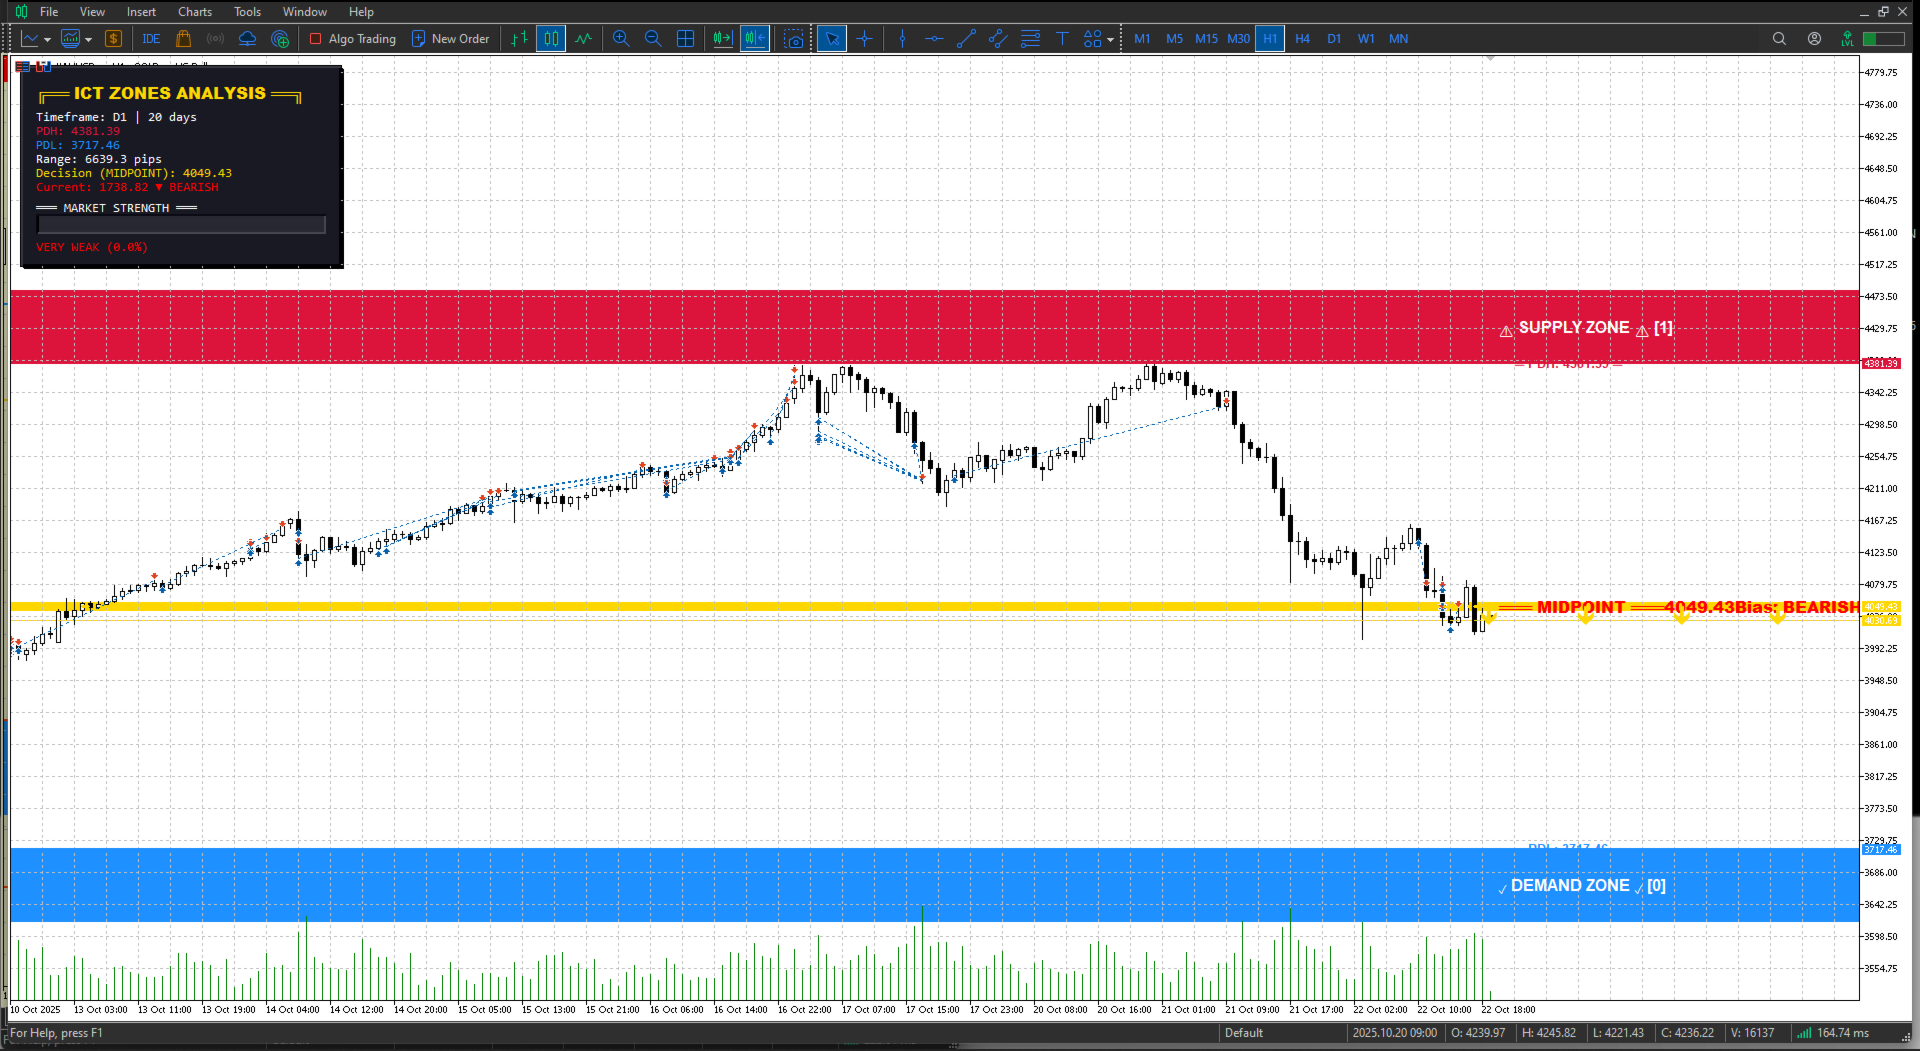
The Liquidity Map indicator is an advanced visualization tool based on ICT Smart Money Concepts.
It automatically identifies daily Buy Zones, Sell Zones, and Liquidity Levels, showing where price is likely to reverse or continue based on institutional order flow.
It calculates key levels from the daily session — such as the previous day’s high, low, and midpoint — then derives a premium (sell bias) and discount (buy bias) structure.
When price trades into these mapped regions, traders can anticipate liquidity sweeps, reversals, or continuation setups with greater accuracy.
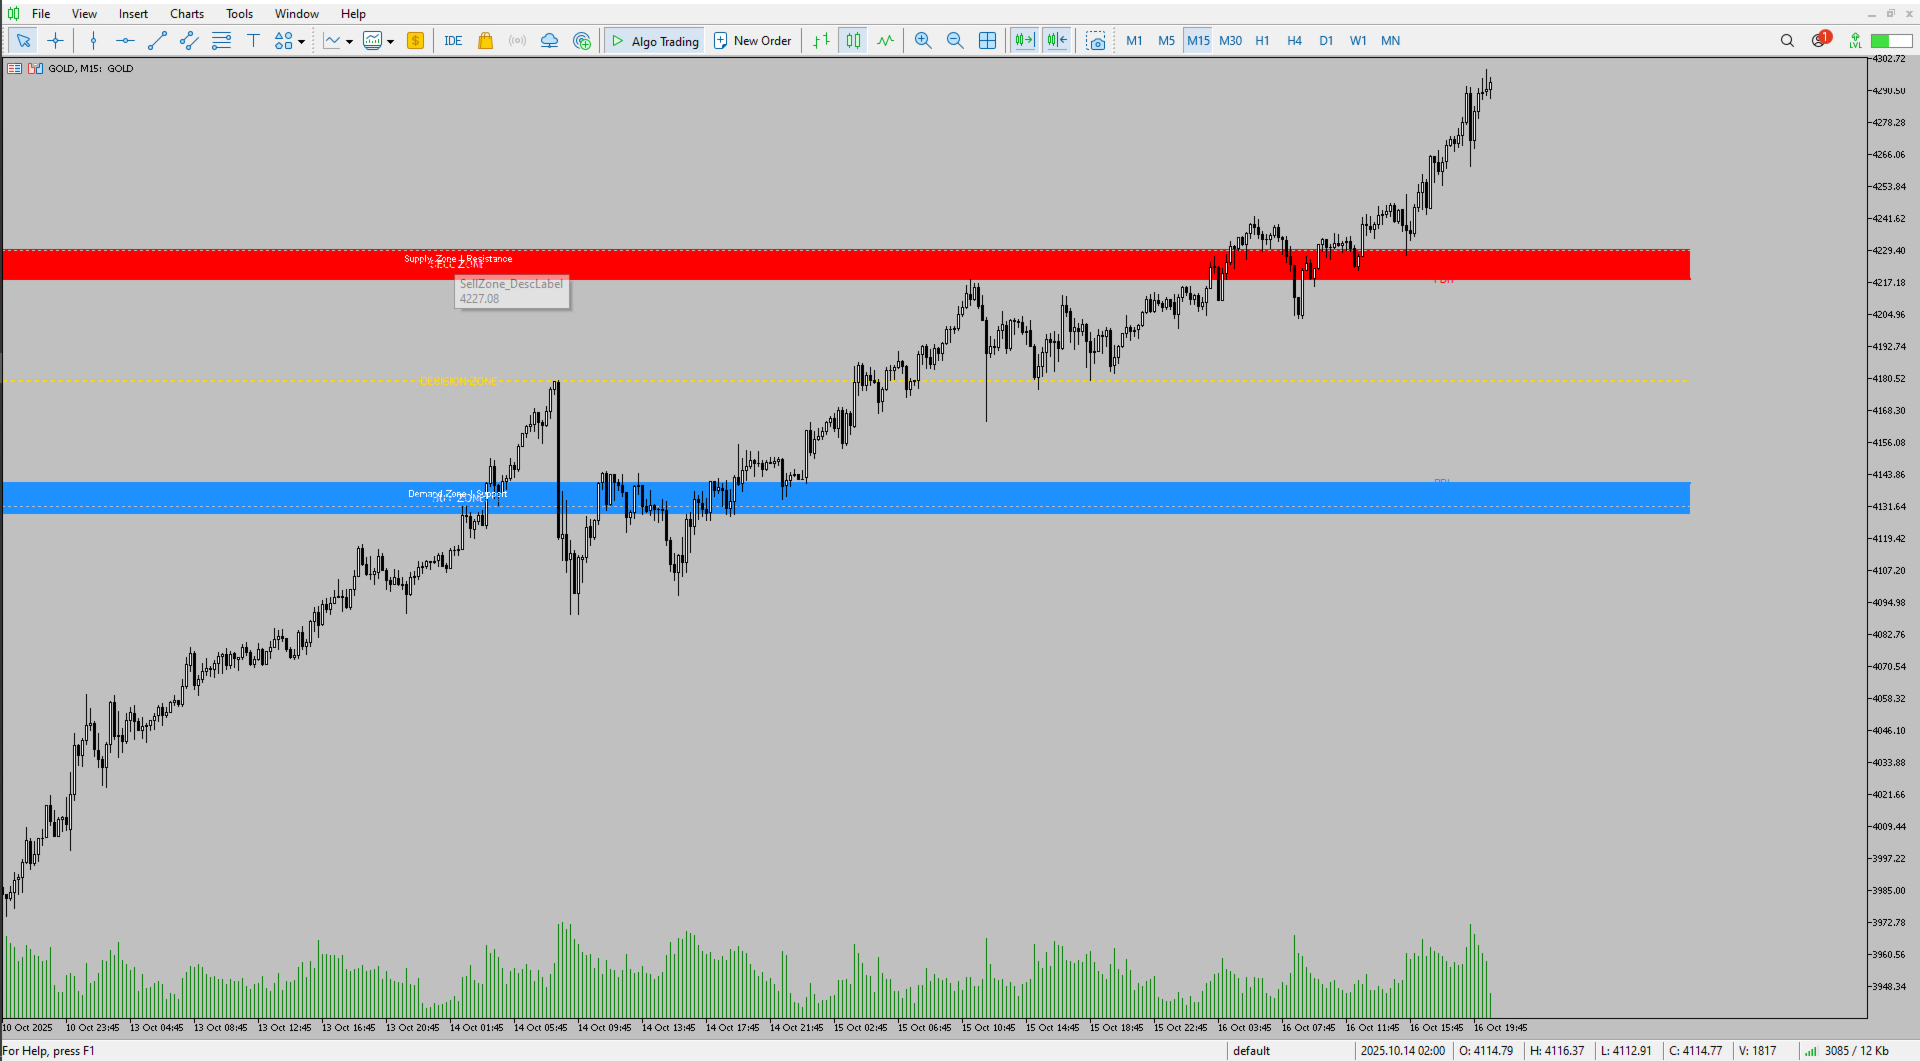
1. Chart Elements and Visual Structure
When attached to the chart, Liquidity Map creates and updates the following visual layers automatically:
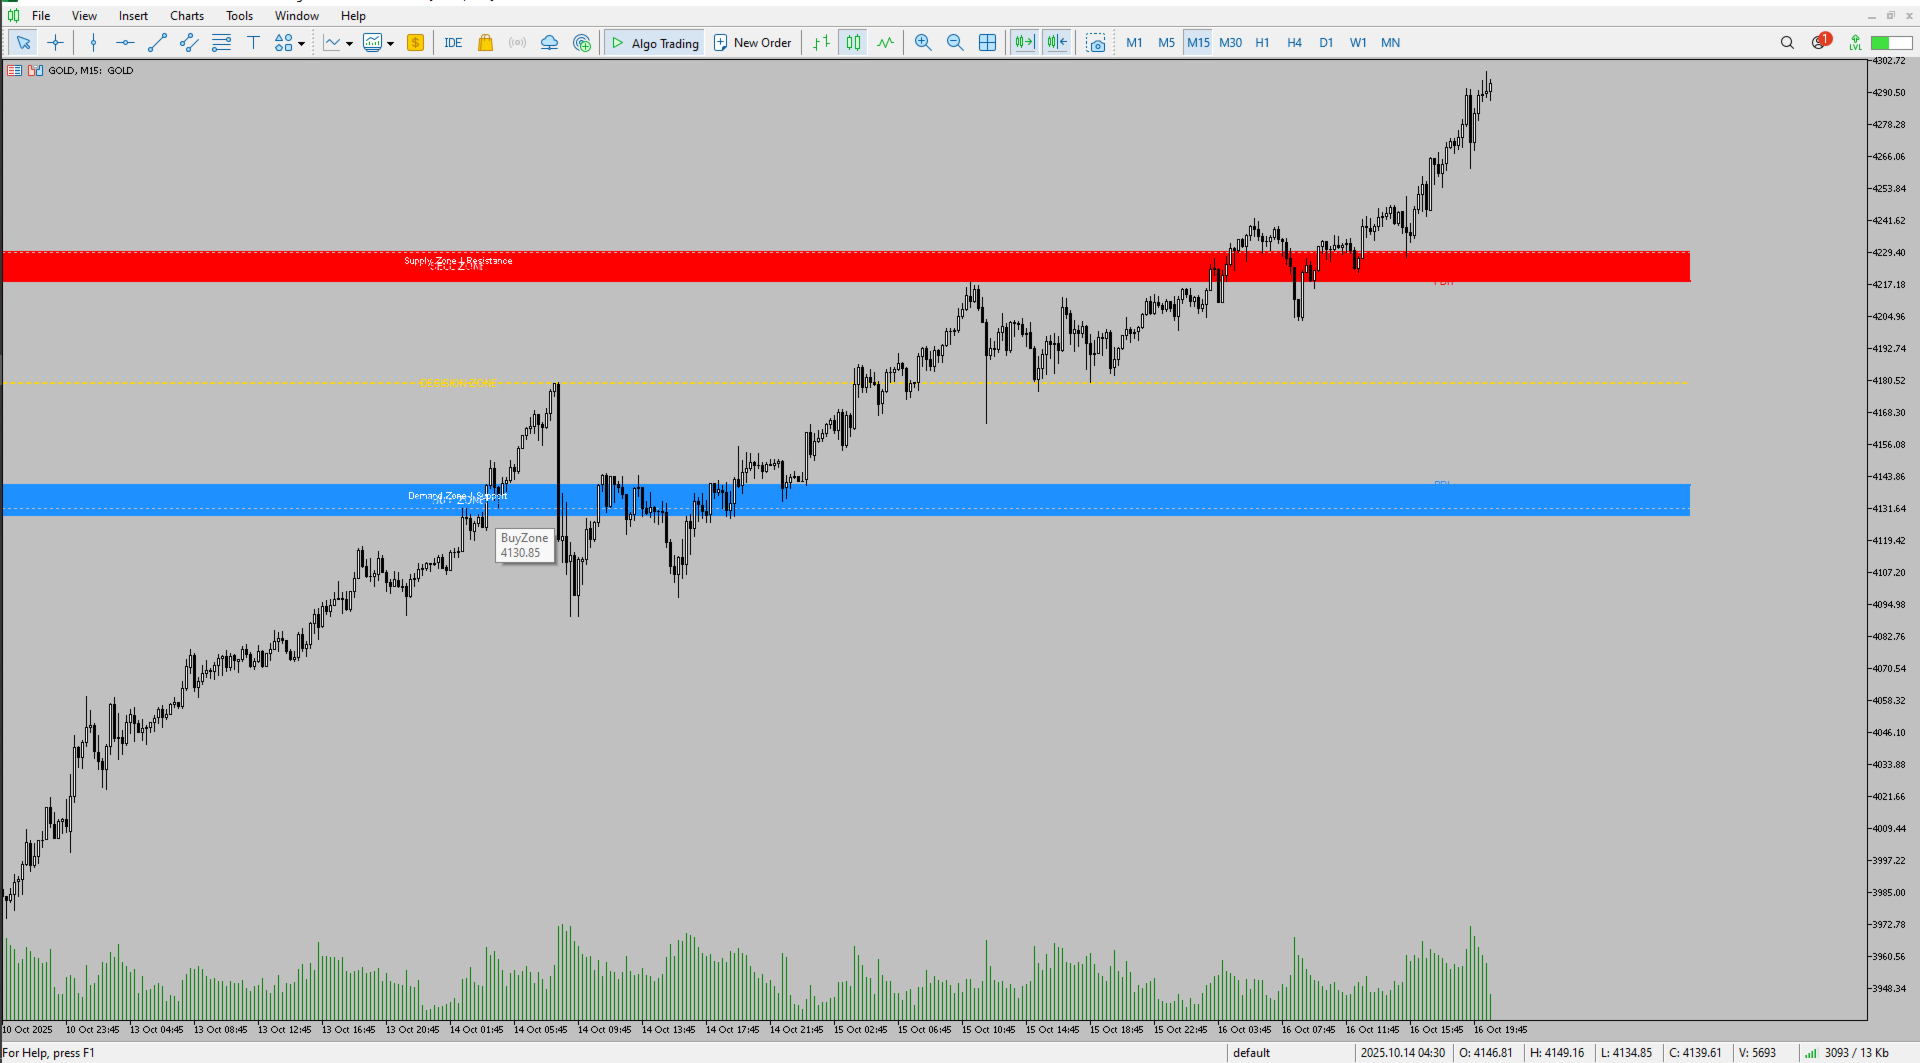
a. Buy Zone (Discount Zone)
-
Plotted below the daily midpoint.
-
Represents areas where smart money accumulates long positions.
-
Typically shaded in blue or green (user customizable).
-
When price enters this area, the indicator suggests a potential buy opportunity after liquidity is swept below previous lows.
b. Sell Zone (Premium Zone)
-
Plotted above the daily midpoint.
-
Represents institutional distribution or short interest areas.
-
Usually shaded in red or orange (user customizable).
-
When price enters this area, it often signals an area to look for sell setups or reversals after liquidity grabs above prior highs.
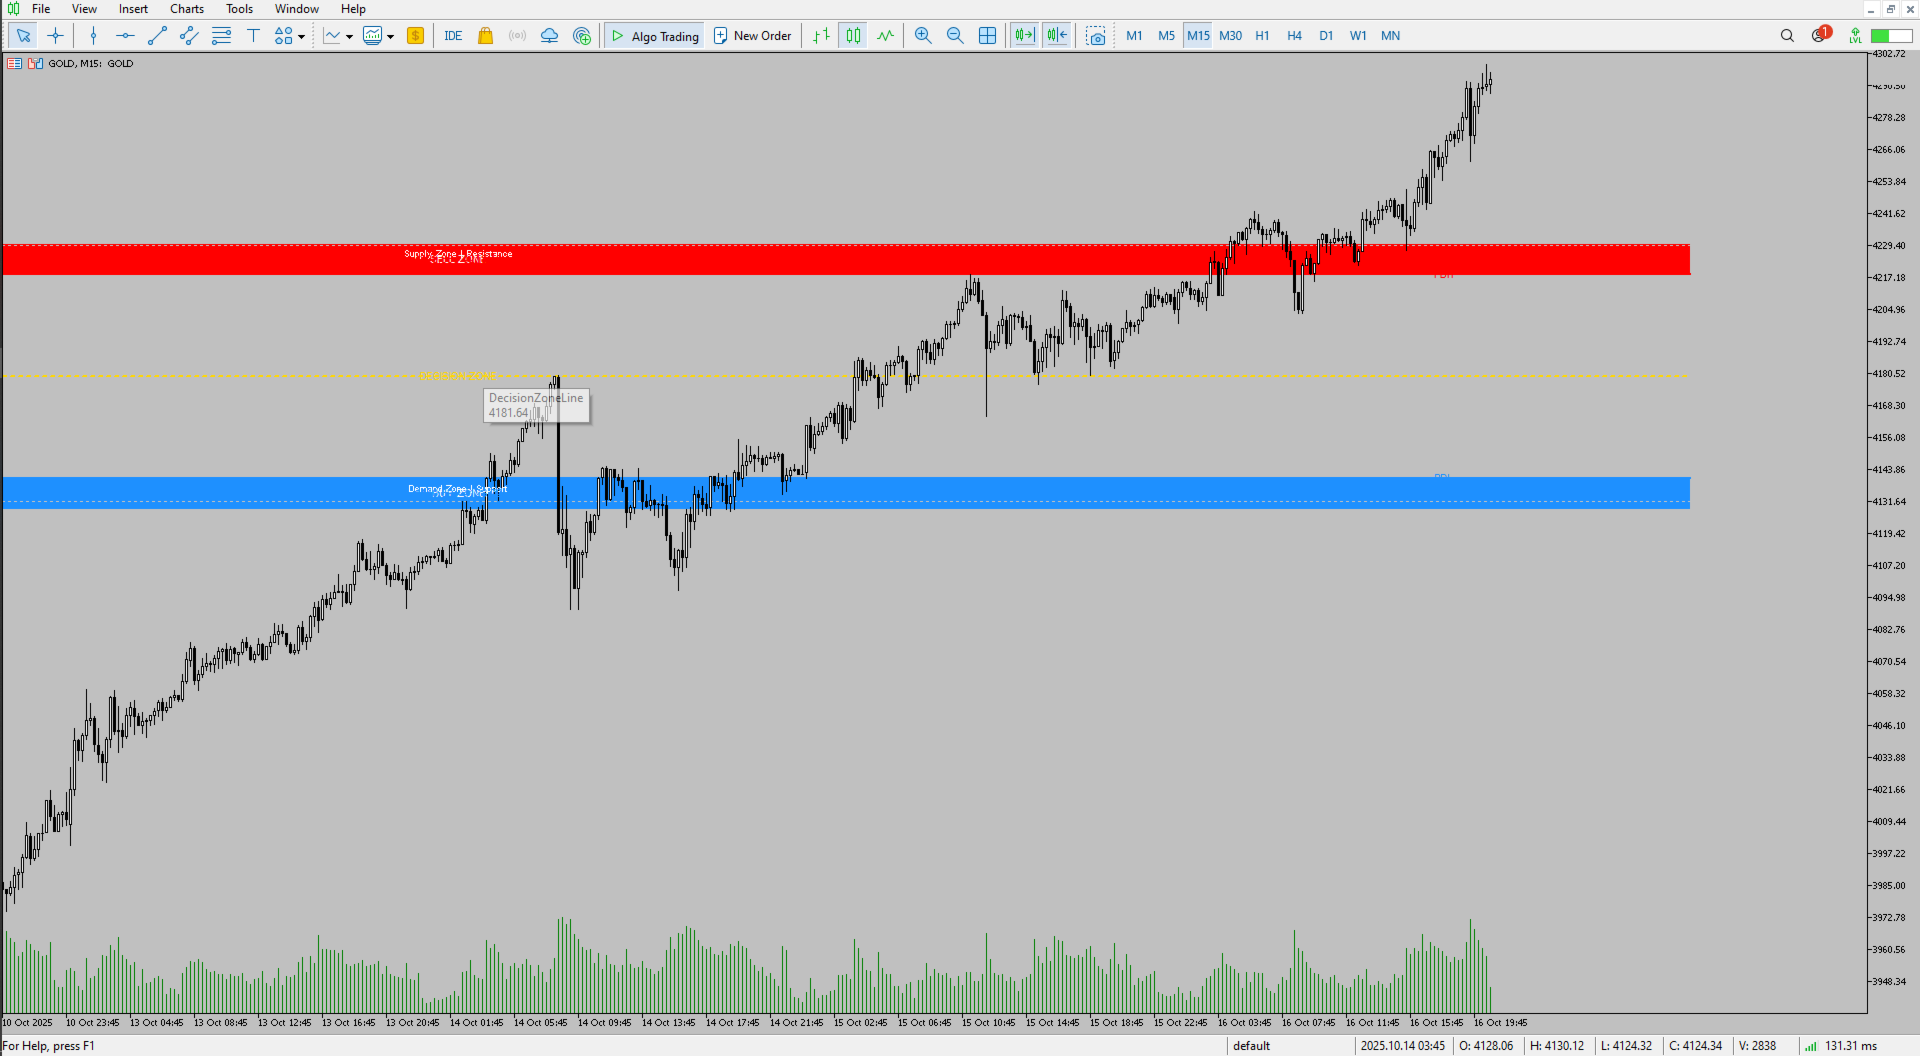
c. Daily Midpoint (Equilibrium Line)
-
The line dividing the daily range into two equal parts.
-
Acts as the fair value line, helping determine whether the market is currently in a premium (above) or discount (below) region.
-
Many traders use this to confirm directional bias.
d. Liquidity Sweep Levels
-
When price breaks a previous day’s high or low, the indicator marks that area visually (line or zone).
-
These are liquidity grab signals, showing that price has swept stops before potentially reversing.
e. Historical Zones
-
You can configure how many past days’ zones are shown.
-
This allows you to analyze how often price interacts with or respects previous liquidity areas.
2. Internal Logic and Calculations
The core logic of Liquidity Map revolves around three key daily data points:
-
Daily High (H)
-
Daily Low (L)
-
Midpoint (M) = (H + L) / 2
Using these:
-
Sell Zone (Premium) is defined as the area between the midpoint and the previous day’s high.
-
Buy Zone (Discount) is defined as the area between the midpoint and the previous day’s low.
If price breaches either the high or low, the indicator records a liquidity sweep and waits for a return to equilibrium (M) or opposite zone confirmation.
These calculations automatically refresh at the start of each new trading day or session, depending on your chart’s timeframe and broker time zone.
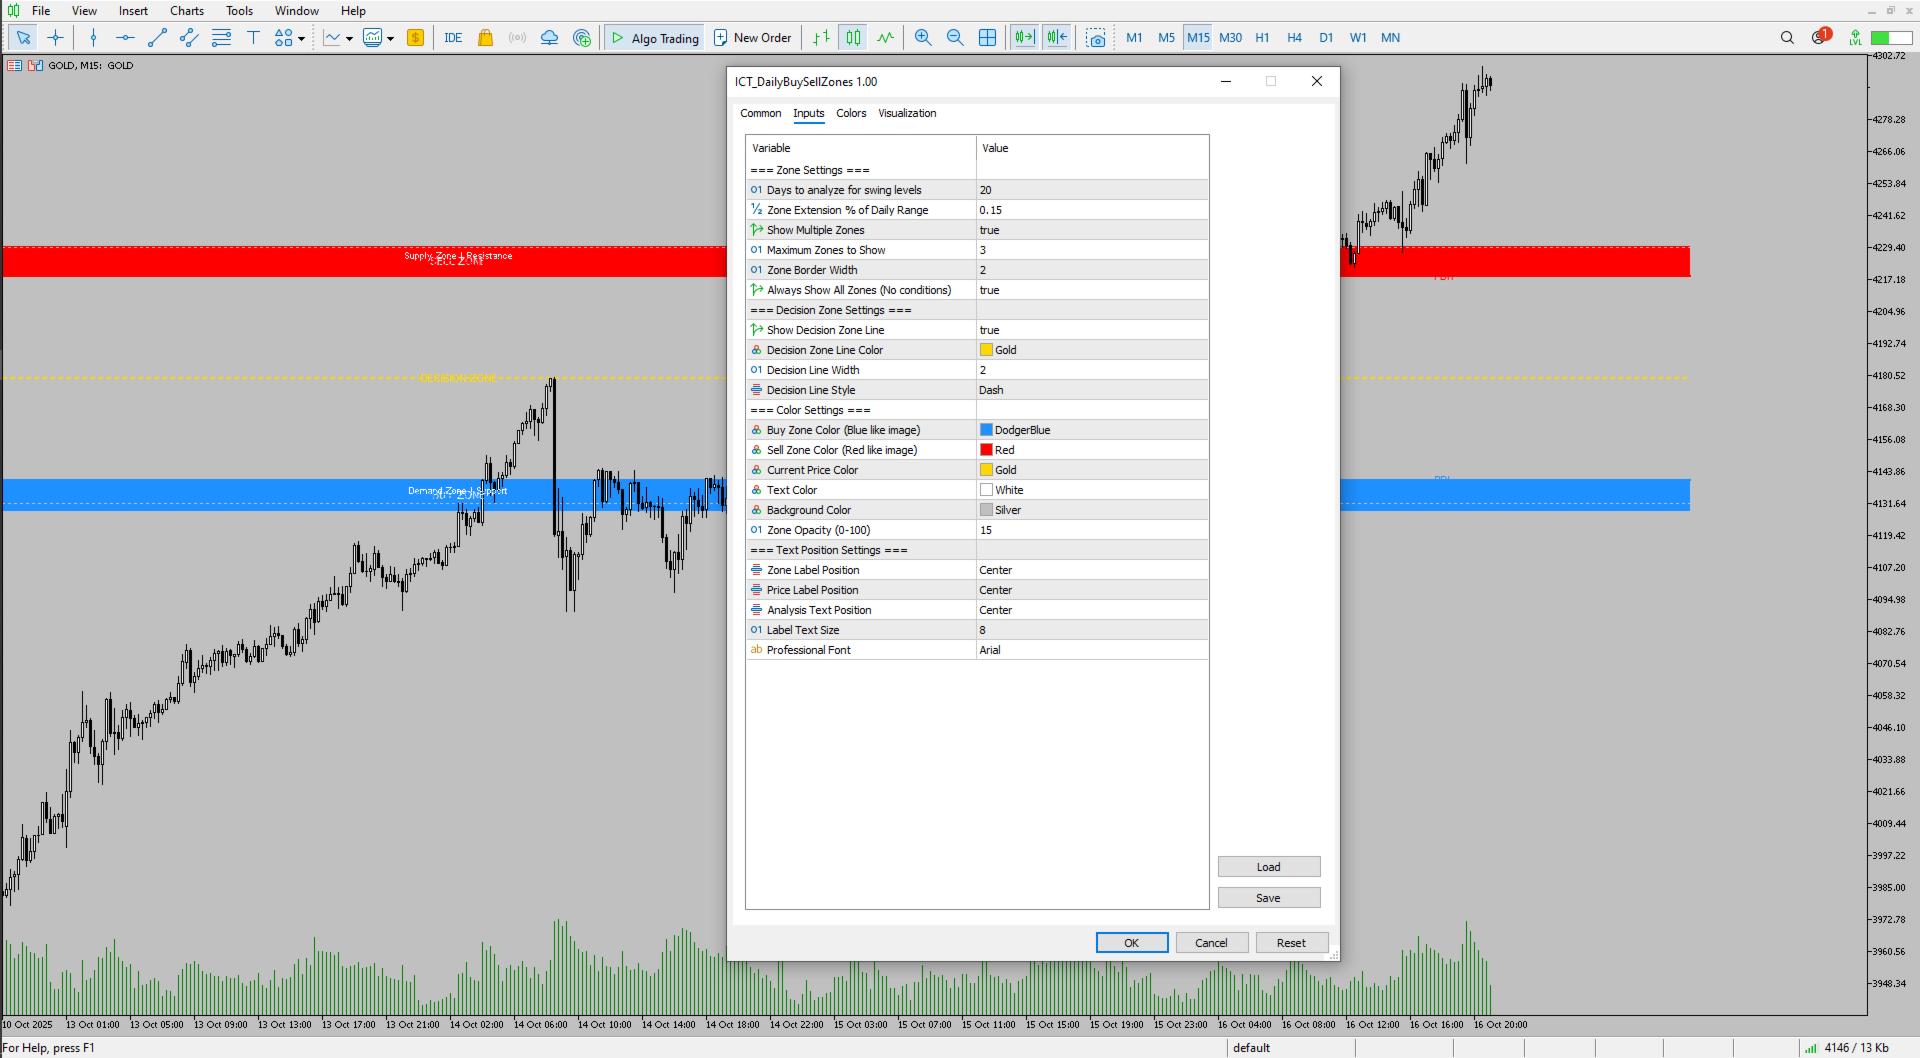
3. Inputs and Their Functions
| Input Name | Description | Effect on Chart |
|---|---|---|
| Show Buy Zones | Enables or disables display of the lower (discount) zones. | Turns Buy Zone area visibility on/off. |
| Show Sell Zones | Enables or disables display of the upper (premium) zones. | Turns Sell Zone area visibility on/off. |
| Number of Historical Days | Number of past zones to plot. Default is often 5. | Increases or reduces historical zone display depth. |
| Buy Zone Color | Color fill for buy (discount) zones. | Customizes zone appearance. |
| Sell Zone Color | Color fill for sell (premium) zones. | Customizes zone appearance. |
| Zone Transparency | Adjusts opacity of filled zones. | Makes areas more or less visible. |
| Show Midline | Displays or hides the midpoint (equilibrium) line. | Useful for clean or detailed layouts. |
| Midline Style/Color | Changes how the equilibrium line looks. | Aesthetic customization. |
| Label Zones | Enables text labels such as “Buy Zone” and “Sell Zone.” | Helps readability on higher timeframes. |
| Alert on Sweep | Enables alerts when liquidity sweeps occur. | Sends popup, sound, or notification on sweeps. |
| Alert on Zone Touch | Notifies when price touches or re-enters a zone. | Good for live monitoring or scalping setups. |
4. Functional Behavior
-
Dynamic Update:
Each new daily candle triggers automatic recalculation of zones and equilibrium lines. -
Multi-Timeframe Adaptation:
Works on any timeframe, but higher timeframes (H1, H4, D1) show clearer daily zones.
On lower timeframes (M5–M15), the zones act as execution points or reaction areas. -
Liquidity Sweep Logic:
When the current high exceeds the previous daily high or low, it marks a liquidity event.
After that, traders can watch for structure breaks or reversals to confirm smart money intent. -
Bias Confirmation:
-
Price above equilibrium (M) → sell bias zone (premium).
-
Price below equilibrium (M) → buy bias zone (discount).
-
Crossing M intraday often signals shift in bias or liquidity rebalancing.
-
5. Practical Trading Applications
-
Daily Bias Detection:
Understand where the day’s liquidity lies before entering trades. -
Session Planning:
Combine with London/New York sessions to spot likely manipulation zones. -
Reversal Confirmation:
Wait for liquidity sweeps beyond zones followed by structure breaks. -
Smart Money Entry Timing:
Align entries with the opposite side of liquidity grabs for sniper setups. -
Backtesting:
Historical zones help visualize how often price respects or retests institutional levels.
6. Performance
The Liquidity Map is optimized for fast, low-lag performance using native MQL5 graphic objects (rectangles and lines).
Even when multiple charts are open, the indicator maintains smooth operation due to minimal loops and efficient zone updating logic.
Summary
The Liquidity Map is more than a simple zone plotter — it’s a complete visual framework for understanding daily liquidity behavior.
By combining price action, session dynamics, and institutional range logic, it gives traders a real-time map of where price is likely to react, reverse, or continue.
It’s ideal for traders who follow ICT, Smart Money Concepts, or market structure analysis, and it seamlessly integrates into any discretionary or algorithmic workflow.