Fan sayfamıza katılın
Öyleyse bir link gönderin -
başkalarının da faydalanmasını sağlayın
- Görüntülemeler:
- 8155
- Derecelendirme:
- Yayınlandı:
- Güncellendi:
-
Bu koda dayalı bir robota veya göstergeye mi ihtiyacınız var? Freelance üzerinden sipariş edin Freelance'e git
Real author:
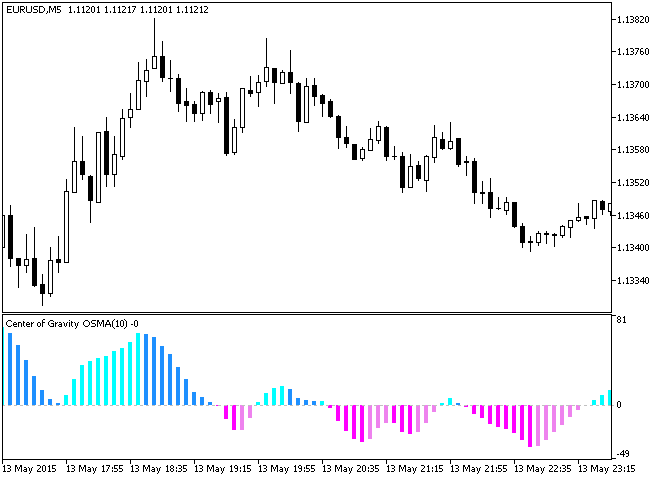
The Center of Gravity J. F. Ehlers indicator represented by a colored OSMA histogram. Smoothed difference between the main and the signal Center of Gravity lines serves as a source for the histogram.
Indicator uses the СMoving_Average class of the SmoothAlgorithms.mqh library. Working with that class was described in details in the article "Averaging Price Series for Intermediate Calculations Without Using Additional Buffers".

Fig.1. The CenterOfGravityOSMA indicator
MetaQuotes Ltd tarafından Rusçadan çevrilmiştir.
Orijinal kod: https://www.mql5.com/ru/code/13154
 RSICloud_HTF
The RSICloud indicator with the timeframe selection option available in the input parameters.
 RSICloud
Cloud indicator, the envelopes of which represent the RSI oscillator values calculated for High and Low prices.
 CenterOfGravityOSMA_HTF
The CenterOfGravityOSMA indicator with the timeframe selection option available in the input parameters.
 CoppockHist
Colored histogram based on a famous indicator by Edward Coppock.