Join our fan page
- Published by:
- Nikolay Kositsin
- Views:
- 28145
- Rating:
- Published:
- Updated:
-
Need a robot or indicator based on this code? Order it on Freelance Go to Freelance
Real author:
Rosh
Center of Gravity actually has a zero lag and allows to define turning points precisely. This indicator is the result of Ehler's study of adaptive filters.
The indicator Center of Gravity allows to identify main pivot points almost without any lag.
The idea of calculating a center of gravity appeared from the investigation of lags of different filters with the finite impulse response (FIR) in accordance with the relative amplitude of filter coefficients. SMA (Simple Moving Average) is a FIR-filter, in which all coefficients have one and the same value. As a result the center of gravity of SMA is an exact center of the filter. WMA (Weighted Moving Average) is a FIR-filter, in which the last price change is weighted through the filter length, and so on.
The values of weighting are coefficients of filters. Coefficients of WMA filters can be presented as contours of a triangle. The center of gravity is on the 1/3 of the triangle base length. Thus WMA gravity center is shifted to the right with respect to the center of gravitation of SMA of the same length, which gives us a smaller lag. For all examples with FIR filters the sum of productions of coefficients and the price must be divided by the sum of coefficients for preservation of original prices.
The most famous of such FIR filters is Ehlers filter that can be presented the following way:

The quote from the article:
"The coefficients of the Ehlers Filter can be almost any measure of variability. I have looked at momentum, signal to noise ratio, volatility, and even Stochastics and RSI values as filter coefficients. One of the most adaptive set of coefficients arose from video edge detection filters, and was the sum of the square of the differences of each price to each previous price. In any event, the result of using different filter coefficients is to make the filter adaptive by moving the CG of the coefficients.
While I was debugging the code of an adaptive FIR filter I noticed that the CG, itself, moved in exact opposition to the price swings. The CG moves to the right when prices go up and moves to the left when prices go down. Measured as the distance from the most recent price, the CG decreased when prices rose and increased when they fell. All I had to do was to invert the sign of the CG to get a smoothed oscillator that was both in phase with the price swings and had essentially zero lag."
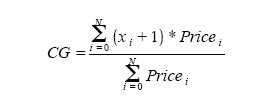
The Center of Gravity is calculated as Ehlers filter using the formula:

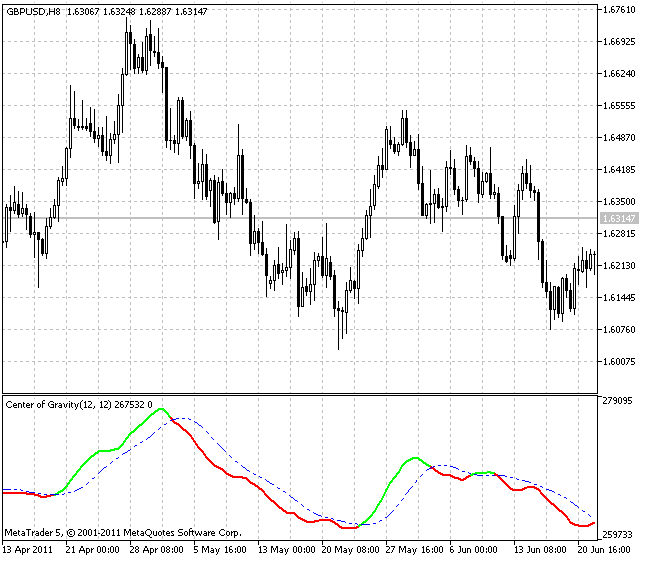
In this indicator Period_ parameter sets the period for the indicator calculation, AppliedPrice parameter sets the price type, based on which the indicator is calculated - thus we get the main line of the indicator (with changing color).
For the signal line (blue dot-dash line) the SmoothPeriod parameter sets the period of smoothing the main indicator line, the SmoothType parameter denotes the type of smoothing. The interpretation of the values of parameters is given in the form of comments in the indicator code.
Indicator uses the СMoving_Average class of the SmoothAlgorithms.mqh library. Working with that class was described in details in the article "Averaging Price Series for Intermediate Calculations Without Using Additional Buffers".
This indicator was first implemented in MQL4 and published in CodeBase 20.02.2007.

Translated from Russian by MetaQuotes Ltd.
Original code: https://www.mql5.com/ru/code/442
 Karacatica
The indicator generates market entry signals based on the ADX indicator.
 Laguerre
Trend strength indicator based on the Laguerre adaptive filter.
 ColorMACD
Histograma MACD colorido com a linha de sinal que muda de cor de acordo com a direção da tendência.
 NRTR Rosh v2
The indicator shows the current trend, support and resistance levels.