QQE Mod Indicator
- Индикаторы
-
Filip Valkovic
 Founder of XraiderStudios (connect via fiverr.com)
Developer - Trader - Professor
Feel free to contact me with request about a job for MT4/MT5.
I specialize in converting tradingview scripts to metatrader. - Версия: 1.40
- Обновлено: 10 октября 2025
- Активации: 20
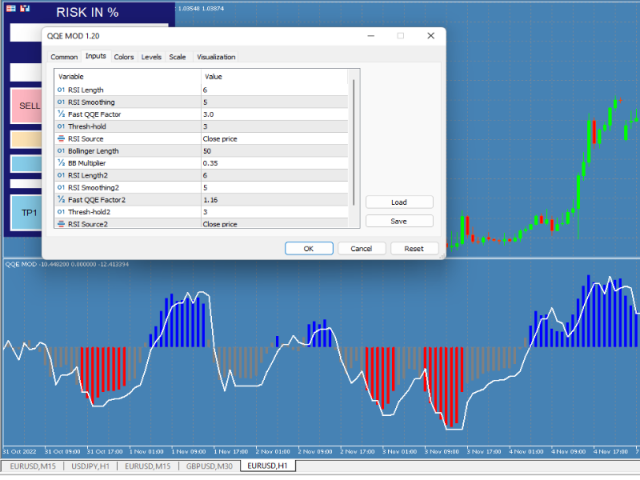
The Quantitative Qualitative Estimation (QQE) indicator is derived from Wilder’s famous Relative Strength Index (RSI). In essence, the QQE is a heavily smoothed RSI.
Modification of this version: ( converted from tradingview script by Mihkell00, original from Glaz, 100% identical output)
So there are Two QQEs. One that is shown on the chart as columns, and the other "hidden" in the background which also has a 50 MA bollinger band acting as a zero line.
When both of them agree - you get a blue or a red bar.
This version also has clean buffers for EA use:
buffer 0 = histogram,
buff 1 = colors,
buff2 = FastAtrRsiTL2(secondaryQQETrendLine)