BalanceCurve

1. What is this

This is a tool used to display the balance curve in real time. The historical orders of the MT5 software are only tabular, and it looks troublesome when you have a lot of orders. This program can draw your historical trading orders in the form of a capital curve graph. This way you can see at a glance how well you are trading and where you are going wrong.

At the same time, although the MT5 strategy backtest has a capital curve, it does not match the price one by one. So it is very troublesome to use. This program makes the price curve match the capital curve one by one, which is very convenient to use.

2. Features

  • You can draw your historical trading orders in the form of a capital curve chart, which can draw different capital curves according to different time frames.
  • It can be used for strategy backtesting to show how your EA strategy is doing in real time.
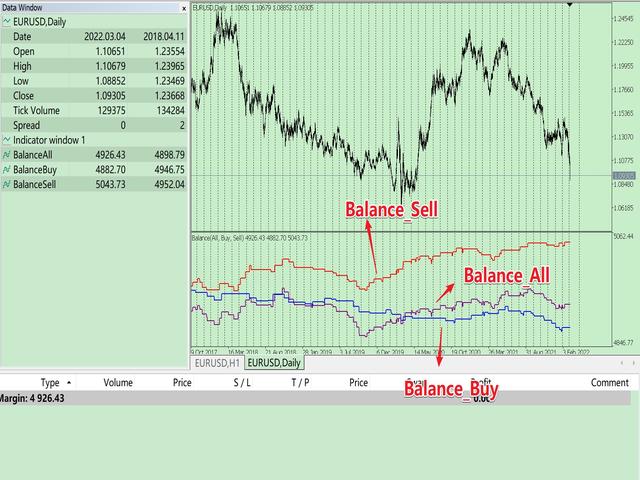
  • It is divided into three funding curves. One is for only showing long position, one is for showing only short position, and one is for including all.
  • Programming in the form of indicators does not affect the overlay of other EAs or indicators.

3. Parameter description

  • InitDeposit = 5000; // Initial Deposit
  • Inp_StartTime = 0; // History start time, 0 - all time
  • Inp_ProfitNorm = false; // Is corrected position to 1.0 lots, default false.
  • Inp_Symbol = NULL; // Select Symbol, default is all symbols.

4. How to use

Just load it directly on the chart.

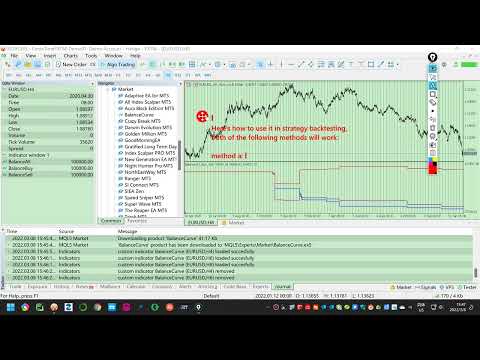
Here's how to use it in strategy backtesting, both of the following methods will work:

  • a. Load the following code into OnInit() of your EA, it will automatically load the indicator in the history test. First you have to copy the program to the Indicator directory.
    //---First you have to copy the program to the Indicator directory.
    iCustom(_Symbol, _Period, "BalanceCurve", 5000, 0, false);
  • b. Save the indicator to the template, and then load the template in the strategy backtest.


Рекомендуем также
Before installing the HeatMap indicator make sure you are using a broker that gives you access to the Depth of market (DOM) !! This indicator creates a heatmap on your chart allowing you to see the buy or sell limit orders easily and in real time. You have the possibility to change the setting and the colors of the HeatMap in order to adapt to all markets and all charts. Here is an example of a setting you can use with the NASDAQ100 on the AMPGlobal broker :  https://www.youtube.com/watch?v=x0Y
KT Renko Patterns MT5
KEENBASE SOFTWARE SOLUTIONS
KT Renko Patterns анализирует график Ренко кирпич за кирпичиком, чтобы найти известные графические паттерны, которые часто используют трейдеры на различных финансовых рынках. По сравнению с графиками на основе времени, торговля по паттернам на графиках Ренко легче и нагляднее благодаря их чистому виду. KT Renko Patterns включает несколько паттернов Ренко, многие из которых подробно описаны в книге «Профитная торговля с графиками Ренко» авторства Прашанта Шаха. Полностью автоматизированный сове
Индикатор кумулятивной дельты Как считает большинство трейдеров, цена движется под давление рыночных покупок или продаж. Когда кто-то выкупает стоящий в стакане оффер, то сделка проходит как "покупка". Если же кто-то наливает в стоящий в стакане бид - сделка идет с направлением "продажа". Дельта - это разница между покупками и продажами. А кумулятивная дельта - разница между покупками и продажами накопленным итогом за определенный период времени. Она позволяет видеть, кто в настоящий момент конт
Индикатор SMC Venom Model BPR — профессиональный инструмент для трейдеров, работающих в рамках концепции Smart Money (SMC). Он автоматически идентифицирует на графике цены два ключевых паттерна:  FVG   (Fair Value Gap) — комбинация их трёх свечей, в которой имеется разрыв между первой и третьей свечой. Формирует зону между уровнями, где отсутствует поддержка объемов, что часто приводит к коррекции цены. BPR   (Balanced Price Range)— комбинация двух FVG-паттернов, образующих «мост»  — зону пробо
ET9 New on the Market, Launch promo! Only a few copies left at: $699 Next price: $799 Final price: $1599 The Best Expert Advisor  on   XAUUSD   any timeframes! ET9  for MT5 Updated v4.80 !!      Important update:  Merge Dragon Ball's H4 breakout strategy, Optimize parameters ,     Add MaxStopLoss and MaxTakeProfit parameters Include Free ET1 for MT5:  https://www.mql5.com/en/market/product/113131 Dragon Ball MT5 Updated v1.80 !!  https://www.mql5.com/en/market/product/116514 Descriptions ET9
FusionPro EA
Bram Van De Vooren
FusionPro v1.1 Beta - Multi-Strategy News-Aware EA ️ CONSERVATIVE Multi-Pair Trading System with Advanced Risk Protection LIMITED BETA RELEASE - $299 (Price increases +$100 after every 10 sales - Secure your copy now!) ️ SAFETY-FIRST TRADING APPROACH Conservative Risk Management - Maximum 0.1%-2.0% risk per pair, never risky martingale News Event Protection - Automatically blocks trades during high-impact volatile events Smart Position Limits - Maximum open trades cap prevents o
| Fully-automated Smart Money Concept (ICT) inspired trading solution with multi-strategy capabilities | Built by a grid trader >> for grid traders.  This is MT5 version, click  here  for  Blue CARA MT4  (settings and logics are same in both versions)     Real monitoring signal  -->  Cara Gold Intro Blue CARA EA   ('CARA') - short for  C omprehensive  A lgorithmic   R esponsive   A dvisor is a next-gen  multi-currency    multi-timeframe  EA base on the widely known (and perhaps the most popul
Введение Это советник на откат, предназначенный для обнаружения расхождений тренда, что соответствует первому типу точек покупки и продажи в теории «Чжань Чжун Шуо Чань». Благодаря исключительно высокому коэффициенту прибыли этот советник обеспечивает стабильную долгосрочную прибыльность. Он использует динамическую сеточную торговлю, что позволяет легко адаптироваться к различным рыночным условиям. Акционная цена нового советника: 99 долларов США → 149 долларов США. Живой сигнал: https://www.m
50% off. Original price: $375  (Ends on February 15) Reward Multiplier is a semi-automatic trade manager based on pyramid trading that opens additional orders with the running profit of your trades to maximize return exponentially without increasing the risk. Unlike other similar EAs, this tool shows potential profit/loss and reward to risk ratio before even entering the first trade! Download Demo here  (starting lot is fixed at 0.01) Guide + tips here MT4 version   here You only open the first
Renko Logic
Ahmed Mohammed Bakr Bakr
MetaTrader 5 Renko Expert Advisor - User Guide Overview This Expert Advisor implements a complete Renko-based trading system with custom brick calculation, visual display, and automated trading logic. -The EA only for Rent unlimited Version coming soon. Features 1. Renko Engine Custom Renko Calculation : Built from scratch, no offline charts needed No Repainting : Uses only closed Renko bricks Configurable Brick Size : Set in points via input parameters Real-time Brick Formation : Automatically
Nova AC Trader is a modern automation of the Accelerator Oscillator (AC) — a Bill Williams momentum tool designed to detect shifts in market acceleration before trends fully form. This EA transforms the indicator’s early-warning nature into a structured trading system that reacts only when momentum changes are clear and consistent. Instead of waiting for the trend to be obvious, Nova AC Trader identifies when market acceleration starts to turn — offering opportunities at the earliest stage of mo
Trend Sentry Pro
K2021665571 (SOUTH AFRICA)
Описание продукта Trend Sentry Pro — это продвинутый полностью автоматизированный советник (EA), предназначенный для торговли только на покупку и использования восходящих трендов с помощью усовершенствованного индикатора трендовой линии. Советник открывает позиции на покупку, когда цена закрывается выше трендовой линии, что сигнализирует о подтвержденном бычьем тренде, и закрывает сделки, когда цена падает ниже трендовой линии, указывая на возможный разворот тренда. Такой подход позволяет Trend
Gann Time–Price Square Cycles (MT5) Этот индикатор реализует концепцию баланса времени и цены, предложенную У.Д. Ганном. Он выявляет ценовые свинги на графике и проецирует временные интервалы циклов Quarter, Half и Full вперёд, отмечая их вертикальными линиями. Инструмент предназначен для того, чтобы помочь трейдерам изучать взаимосвязь между величиной ценового движения и прошедшим временем непосредственно на графиках MT5. Функции Определяет локальные максимумы и минимумы на основе глубины пиво
Premium level - это уникальный индикатор с точностью правильных прогнозов  более 80%!  Данный индикатор тестировался более двух месяцев лучшими Специалистами в области Трейдинга!  Индикатор авторский такого вы больше не где не найдете!  По скриншотах можете сами увидеть точностью данного инструмента!  1 отлично подходит для торговли бинарными опционами со временем экспирации на 1 свечу. 2 работает на всех валютных парах, акциях, сырье, криптовалютах Инструкция: Как только появляется красная стре
Surf Board
Mohammadal Alizadehmadani
Benefits of the Surfboard indicator : Entry signals without repainting If a signal appears and is confirmed, it does NOT disappear anymore, unlike indicators with repainting, which lead to major financial losses because they can show a signal and then remove it. perfect opening of trades The indicator algorithms allow you to find the Peak and floor position to enter a deal (buy or sell an asset), which increases the success rate for each and every trader using it. Surfboard works with any asset
Утилита для автоматического управления ордерами и рисками.   Позволяет взять максимум с прибыли и ограничить свои убытки.   Создан практикующим трейдером для трейдеров.   Утилита  проста в использовании,  работает с любыми рыночными ордерами, открытыми трейдером вручную или при помощи советников. Может фильтровать сделки по магическому номеру. Одновременно утилита может работать с любым количеством ордеров.  Имеет такие функции: 1. В ыставление уровней стоплосс и тейкпрофит; 2. З акрытие сделок
Description : Rainbow EA MT5 is a simple Expert advisor based on   Rainbow MT5 indicator witch is based on Moving average with period 34. The indicator is incorporated in the EA, therefore, it is not required for the EA to operate, but if you wish, you can download it from   my product page . The Expert Advisor settings are as follows : Suitable for Timeframes up to H1 The parameters below can be set according to your trading rules. StopLoss ( Stop Loss in pips) TakeProfit ( Take Profit in pips
##   ONLY GOLD ##   Тiльки Золото ## **Mercaria Professional Trading Zones - Complete Guide** ## **Mercaria Professional Trading Zones - Повний посібник** ### **How Mercaria Zones Work / Як працюють зони Mercaria** **English:** Mercaria Zones is an advanced trading indicator that identifies high-probability support and resistance areas using ZigZag extremes combined with mathematical zone calculations. The indicator works on multiple timeframes simultaneously, providing a comprehensive view
AUTOMATIC TRADE COPIER for local *   use . (copy trades between several metatrader terminals on the local computer/ *or GLOBALLY after setting your network /server !) Can copy trades from one or   several main MT5 accounts   to several MT5 and MT4 accounts   (no limit). For MT5 to MT4 copy you have to also get version for Metatrader 4 here : https://www.mql5.com/en/market/product/80842 - very fast execution (theoretically up to 5ms delay, depends on computer speed) - user can set speed of copy
Santa Scalping is a fully automated Expert Advisor with no use of martingale. Night scalping strategy. The SMA indicator filter are used for entries. This EA can be run from very small accounts. As small as 50 EUR. General Recommendations The minimum deposit is 50 USD,  default settings reccomend for eurusd m5 gmt +2 . Please use max spread 10 if you will not have orders change it to -1. Use a broker with good execution and with a spread of 2-5 points. A very fast VPS is required, preferably wi
The relative strength index (RSI) is a popular momentum oscillator introduced in 1978. The RSI provides technical traders with signals about bullish and bearish price momentum, and it is often plotted beneath the graph of an asset's price. An asset is usually considered overbought when the RSI is above 70 and oversold when it is below 30. The Best RSI uses the input signal from the RSI indicator. Unlock the potential of the markets with The Best RSI, the fully automated and ready-to-use trading
Elevate your trading experience with Dynamic Trader EA MT5 , a cutting-edge trading robot designed to optimize your investment strategy. This advanced algorithm harnesses the power of four key indicators: RSI ( Relative Strength Index ), Stochastic Oscillator , MACD   ( Moving Average Convergence Divergence ) and ATR ( Average True Range ) to make informed and precise trading decisions. ATR is used to dynamically set stop-loss and take-profit levels based on market volatility. IMPORTANT! Read c
Mine Farm is one of the most classic and time-tested scalping strategies based on the breakdown of strong price levels. Mine Farm is the author's modification of the system for determining entry and exit points into the market... Mine Farm - is the combination of great potential with reliability and safety. Why Mine Farm?! - each order has a short dynamic Stop Loss - the advisor does not use any risky methods (averaging, martingale, grid, locking, etc.) - the advisor tries to get the most
Gold EA: Proven Power for 1-Minute Gold Trading Transform your trading with our Gold EA, meticulously crafted for 1-minute charts and delivering over 2000% growth in 5 years from just $100-$1000 . No Martingale, No AI Gimmicks : Pure, time-tested strategies with robust money management, stop loss, and take profit for reliable performance across multiple charts. Flexible Trading Modes : Choose Fixed Balance for safe profits, Mark IV for bold growth, or %Balance for high rewards—combine Mark IV an
Устанавливайте TP и SL по Цене – Автоматический модификатор ордеров для MT5 Автоматически устанавливает точные уровни TP и SL по цене сделки ️ Работает со всеми парами и советниками, фильтрация по символу или Magic Number Этот советник позволяет задавать точные уровни Take Profit (TP) и Stop Loss (SL) по ценовым значениям (например, 1.12345 на EURUSD). Без пунктов, без пипсов. Только точное и чистое управление сделками для всех ордеров или по выбранному символу или Magic Number. Основны
SmartRAL
Jemy Yeferson Dimu Ludji
SmartRAL (Smart Risk Auto-Lot EA) SmartRAL: The Ultimate Risk & Lot Management Expert Advisor (EA) SmartRAL is an essential tool for traders who demand precise risk management and automated position sizing in MetaTrader 5. Stop guessing your lot size and let the algorithm handle the calculations. This EA allows you to trade with confidence by guaranteeing your risk exposure on every single trade, while offering absolute flexibility in setting your Stop Loss (SL). Key Features & Benefits Guarante
Volume Profile V6
Andrey Kolesnik
4.67 (3)
Индикатор объемного профиля рынка + умный осциллятор. Работает практически на всех инструментах-валютные пары, акции, фьючерсы, криптовалюта, на реальных объемах и на тиковых. Можно задавать как автоматическое определение диапазона построения профиля, например, за неделю или месяц и т.д. так и устанавливать диапазон вручную передвигая границы (две вертикальные линии красная и синяя). Показывается в виде гистограммы. Ширина гистограммы на данном уровне означает, условно, количество сделок, пр
Советник отображает обновляющийся в реальном времени график ренко для простоты технического анализа. Протестируйте на истории вашу стратегию, используя график ренко в MetaTrader 5. Параметры Box Size : размер окна. Show Wicks : при true отображать свечу с максимумом/минимумом. History Start: дата создания первой свечи. Применение Запустите советника на графике (таймфрейм M1), для которого хотите создать ренко. Введите размер окна и дату. Используйте график ренко только на M1.
The Bitcoin Reaper
Profalgo Limited
3.71 (34)
ЗАПУСК ПРОМО: По текущей цене будет доступно лишь очень ограниченное количество экземпляров! Окончательная цена: 999$ НОВИНКА (от 349$) --> ПОЛУЧИТЕ 1 EA БЕСПЛАТНО (для 2 номеров торговых счетов). Лучшее комбо-предложение     ->     нажмите здесь ПРИСОЕДИНЯЙТЕСЬ К ПУБЛИЧНОЙ ГРУППЕ:   Нажмите здесь   LIVE SIGNAL LIVE SIGNAL V2.0 UPDATE 2.0 INFO Добро пожаловать в BITCOIN REAPER!   После колоссального успеха Gold Reaper я решил, что пришло время применить те же принципы победы к рынку биткоинов,
Noize Absorption Index - is the manual trading system that measures the difference of pressure between bears forces and bulls forces. Green line - is a noize free index that showing curent situation. Zero value of index shows totally choppy/flat market.Values above zero level shows how powerfull bullish wave is and values below zero measures bearish forces.Up arrow appears on bearish market when it's ready to reverse, dn arrow appears on weak bullish market, as a result of reverse expectation.
С этим продуктом покупают
Trade Assistant MT5
Evgeniy Kravchenko
4.41 (208)
Помогает рассчитать риск на сделку, простая установка нового ордера с помощью линий, управление ордерами с функциями частичного закрытия, 7 типов трейлинг-стопа и другие полезные функции. Дополнительные материалы и инструкции Инструкция по установке - Инструкция к приложению - Пробная версия приложения для демо счета Функция Линии   - отображает на графике линию открытия, стоп-лосс, тейк-профит. С помощью этой функции легко установить новый ордер и увидеть его дополнительные характеристики пе
Добро пожаловать в Trade Manager EA — лучший инструмент для управления рисками, предназначенный для упрощения, точности и эффективности торговли. Это не просто инструмент для размещения ордеров; это комплексное решение для удобного планирования торгов, управления позициями и усиленного контроля над рисками. Независимо от того, начинающий вы трейдер, опытный специалист или скальпер, нуждающийся в быстром исполнении, Trade Manager EA адаптируется к вашим потребностям и работает с любыми активами:
TradePanel MT5
Alfiya Fazylova
4.86 (148)
Trade Panel — это многофункциональный торговый помощник. Приложение содержит более 50 торговых функций для ручной торговли и позволяет автоматизировать большинство торговых операций. Внимание приложение не работает в тестере стратегий. Перед покупкой вы можете протестировать демоверсию на демо-счете. Демоверсия здесь . Полная инструкция здесь . Торговля. Позволяет совершать торговые операции в один клик: Открыть отложенные ордера и позиции с автоматическим расчетом риска. Открыть несколько ордер
Local Trade Copier EA MT5
Juvenille Emperor Limited
4.96 (124)
Опыт экстремально быстрого копирования сделок с помощью Local Trade Copier EA MT5 . Благодаря простой установке в течение 1 минуты этот копировщик сделок позволяет вам копировать сделки между несколькими терминалами MetaTrader на одном компьютере с Windows или на Windows VPS с крайне быстрыми скоростями копирования менее 0.5 секунды. Независимо от того, новичок вы или профессиональный трейдер, Local Trade Copier EA MT5 предлагает широкий спектр опций, чтобы настроить его под ваши конкретные по
Trade Dashboard MT5
Fatemeh Ameri
4.96 (111)
Tired of complex order placement and manual calculations? Trade Dashboard is your solution. With its user-friendly interface, placing orders becomes effortless, by a single click, you can open trades, set stop loss and take profit levels, manage trade lot size, and calculate risk to reward ratios, allowing you to only focus on your strategy. Say goodbye to manual calculations and streamline your trading experience with Trade Dashboard. Download  Demo Version  right now. You can find  Details of
Бета-версия Telegram to MT5 Signal Trader почти готов к официальному альфа-релизу. Некоторые функции все еще находятся в разработке, и вы можете столкнуться с небольшими ошибками. Если вы заметите проблемы, пожалуйста, сообщите о них, ваша обратная связь помогает улучшать программное обеспечение для всех. Цена увеличится после 20 продаж. Оставшиеся копии по $90:   2/20 . Telegram to MT5 Signal Trader — мощный инструмент, который автоматически копирует торговые сигналы из каналов и групп Telegr
The product will copy all telegram signal to MT5 ( which you are member) , also it can work as remote copier.  Easy to set up, copy order instant, can work with almost signal formats, image signal,  s upport to translate other language to English Work with all type of channel or group, even channel have "Restrict Saving Content", work with  multi channel, multi MT5 Work as remote copier: with signal have ticket number, it will copy exactly via ticket number. Support to backtest signal. How to s
Copy Cat More Trade Copier MT5 (Копи-Кот MT5) — это локальный торговый копировщик и полная система управления рисками и исполнения, разработанная для современных торговых задач. От испытаний проп-фирм до управления личным портфелем, он адаптируется к любой ситуации с сочетанием надежного исполнения, защиты капитала, гибкой настройки и продвинутой обработки сделок. Копировщик работает как в режиме Мастер (отправитель), так и в режиме Слейв (получатель), с синхронизацией в реальном времени рыночны
Trade Manager DaneTrades
Levi Dane Benjamin
4.36 (28)
Trade Manager, который поможет вам быстро входить и выходить из сделок, автоматически рассчитывая риск. Включает функции, которые помогут предотвратить чрезмерную торговлю, торговлю из мести и эмоциональную торговлю. Сделками можно управлять автоматически, а показатели эффективности счета можно визуализировать в виде графика. Эти функции делают эту панель идеальной для всех трейдеров, занимающихся ручной торговлей, и помогают улучшить платформу MetaTrader 5. Многоязычная поддержка. Версия для МТ
HINN MAGIC ENTRY - лучший инструмент для входа и менеджмента позиций! Выставляет ордера через выбор уровня на графике! полное описание    ::    demo-версия Основные функции: - Рыночные, лимитные и отложенные ордера -  Автоматический подсчет лоттажа  -  Автоматический учет спреда и комиссий -  Неограниченное количество промежуточных тейков для позиций - Перевод в безубыток и трейл стоп-лосса и тейк-профита - Уровни инвалидаций - Интуитивно понятный,  адаптивный, настраиваемый интерфейс - Любые
Ultimate Extractor - Professional Trading Analytics for MT5 *****this is the local HTML version of Ultimate Extractor. Check out Ultimate Extractor Cloud on mql5 for the Cloud version****** Ultimate Extractor transforms your MetaTrader 5 trading history into actionable insights with comprehensive analytics, interactive charts, and real-time performance tracking. What It Does Automatically analyzes your MT5 trading history across all Expert Advisors and generates detailed HTML reports with inte
Exp COPYLOT CLIENT for MT5
Vladislav Andruschenko
3.82 (34)
Trade copier for MT5 - копировщик позиций/СДЕЛОК/ордеров для МetaТrader 5  из МТ4/МТ5) Для копирования на терминал MetaTrader 5 между терминалами МТ5 - МТ5, МТ4 - МТ5  для версии COPYLOT MT5 ( или МТ4 - МТ4 МТ5 - МТ4 для версии COPYLOT MT4). Версия МT4 Полное описание +DEMO +PDF Как купить Как установить    Как получить файлы журналов   Как тестировать и оптимизировать    Все продукты от Expforex Вы также можете копировать сделки в терминал МТ4 (МТ4 - МТ4, МТ5 - МТ4):    COPYLOT CLIENT for M
Farmed Hedge Yield Farming - Professional Pair Trading Dashboard (Manual - Hybrid - Semi/Automated EA) VERSION 3 - WILD HARVEST UPDATE Trading Approach: - Manual Trading: Primary focus - Auto Pilot: Optional supplementary feature - Full Automation: Not the main purpose Recommended Timeframe: H1-H4 DEMO VERSION Download the free demo to test functionality. Use Strategy Tester with Visual Mode to see how it works. VERIFIED TRADING RESULTS - Farmed Hedge Yield Axi Copy: https://www.mql5.com/en/si
Seconds Chart MT5
Boris Sedov
4.59 (17)
Seconds Chart — уникальный инструмент для создания секундных графиков в MetaTrader 5 . С помощью Seconds Chart вы можете построить график с таймфреймом, заданным в секундах, получая идеальную гибкость и точность анализа, недоступную на стандартных минутных или часовых графиках. Например, таймфрейм S15 обозначает график со свечами продолжительностью 15 секунд. Вы можете использовать любые индикаторы и советники с поддержкой пользовательских символов. Работать с ними так же удобно, как и на станда
MT5 to Telegram Signal Provider — это простой в использовании полностью настраиваемый инструмент, который позволяет отправлять определённые сигналы в чат, канал или группу Telegram, превращая вашу учётную запись в провайдера сигналов . В отличие от большинства конкурирующих продуктов, он не использует импорт DLL. [ Демо ]   [ Руководство ] [ Версия MT4 ] [ Версия для Discord ] [ Канал в Telegram ]  New: [ Telegram To MT5 ] Настройка Доступно пошаговое руководство пользователя . Никаких знаний A
YuClusters
Yury Kulikov
4.93 (43)
Внимание: Ознакомиться с работой программы можно с помощью бесплатной версии  YuClusters DEMO . YuClusters это профессиональная система анализа рынка. Для трейдера открываются уникальные возможности анализа потока ордеров, объемов торговли, движения цены используя различные графики, профили, индикаторы, графические объекты. YuClusters оперирует данными на основе ленты сделок или тиковой информации, в зависимости от того, что доступно в котировках финансового инструмента.  YuClusters позволяет с
Smart Stop Manager – автоматизированное управление стоп-лоссами с профессиональной точностью Обзор Smart Stop Manager — это исполнительный модуль линейки Smart Stop, созданный для трейдеров, которым требуется структурированное, надежное и полностью автоматизированное управление стоп-лоссами по нескольким открытым позициям одновременно. Панель непрерывно отслеживает активные сделки, рассчитывает оптимальный уровень стоп-лосса на основе рыночной структуры Smart Stop и автоматически обновляет сто
Telegram to MT5: Идеальное решение для копирования сигналов Упростите свою торговлю с Telegram to MT5 — современным инструментом, который копирует торговые сигналы прямо из каналов и чатов Telegram на вашу платформу MetaTrader 5, без необходимости использования DLL. Это мощное решение обеспечивает точное исполнение сигналов, широкие возможности настройки, экономит время и повышает вашу эффективность. [ Instructions and DEMO ] Ключевые возможности Прямая интеграция с Telegram API Аутентификация ч
Telegram To MT5 Receiver
Levi Dane Benjamin
4.53 (15)
Копируйте сигналы из любого канала, участником которого вы являетесь (в том числе частного и ограниченного), прямо на свой MT5. Этот инструмент был разработан с учетом потребностей пользователей и предлагает множество функций, необходимых для управления и мониторинга сделок. Этот продукт представлен в простом в использовании и визуально привлекательном графическом интерфейсе. Настройте свои параметры и начните использовать продукт в течение нескольких минут! Руководство пользователя + Демо  |
GRat Crypto
Ivan Titov
4.5 (2)
Торгуйте на криптобиржах в МТ5! GRat_Crypto — это инструмент для ручной и автоматической торговли, в т.ч ЛЮБЫМИ имеющимися советниками, ЛЮБОЙ криптовалютой на самых популярных криптобиржах в привычной среде MT5 в режиме 24/7. Возможности 1. Доступны ВСЕ инструменты 9 наиболее популярных криптобирж: Binance, BingX, Bybit, Coinbase, CoinEx, Kraken, KuCoin, MEXC  и OKX . 2. Возможность выставлять ЛЮБЫЕ доступные в MT5 типы ордеров, как рыночные, так и отложенные, модифицировать ордера и позиции, у
Professional Footprint Chart EA - Complete Order Flow Trading Suite DEMO USERS - PLEASE SELECT EVERY TICK WHEN TESTING  See What Market Makers See! The most comprehensive order flow analysis tool for MetaTrader 5. Get institutional-grade volume analysis, real-time DOM, Time & Sales, and intelligent trade signals - all in one powerful EA. 6 Professional Panels - Complete order flow analysis suite Real-Time Tick Data - Live bid/ask volume at every price level Automatic Imbalance Detection - Spot
Entry In The Zone and SMC Multi Timeframe is a real-time market analysis tool developed based on Smart Money Concepts (SMC). It is designed to analyze market structure, price direction, reversal points, and key zones across multiple timeframes in a systematic way. The system displays Points of Interest (POI) and real-time No Repaint signals, with instant alerts when price reaches key zones or when signals occur within those zones. It functions as both an Indicator and a Signal System (2-in-1), c
Smart Stop Scanner – многоактивный интеллектуальный сканер стоп-лоссов Общее описание Smart Stop Scanner предоставляет профессиональный контроль стоп-лоссов на любом рынке. Он анализирует рыночную структуру, определяет значимые пробои и формирует ключевые защитные уровни по Forex, Золоту, Индексам, Металлам, Криптовалютам и другим инструментам. Все данные отображаются в одном чистом, информативном и DPI-адаптивном панели для максимальной ясности и скорости принятия решений. Как определяется с
Торговая панель для торговли в один клик.  Работа с позициями и ордерами!  Торговля с  графика  или  клавиатуры  . Используя нашу торговую панель, вы можете торговать в один клик с графика и совершать торговые операции в 30 раз быстрее, чем стандартное управление MetaTrader. Автоматические расчеты параметров и функций, которые облегчают жизнь трейдеру и помогают трейдеру вести торговую деятельность намного быстрее и удобнее. Графические подсказки и полная информация о торговых сделках на графике
Risk Manager for MT5
Sergey Batudayev
4.35 (17)
Советник Риск Менеджер для МТ5, очень важная и по моему мнению необходимая программа для каждого трейдера. С помощью данного советника вы сможете контролировать  риск на вашем торговом счету. Контроль риска и прибыли может осуществляться как в  денежном $ эквиваленте так и в % процентном. Для работы советника просто прикрепите его на график валютной пары и выставите значения допустимого риска в валюте депозита или в % от текущего баланса.   [ Инструкция с описанием настроек ] Функции советника
Trade Manager DashPlus
Henry Lyubomir Wallace
5 (13)
DashPlus – это продвинутое средство для управления торговлей, разработанное для повышения эффективности и результативности торговли на платформе MetaTrader 5. Оно предлагает широкий набор функций, включая расчет рисков, управление ордерами, продвинутые системы сеток, инструменты на основе графиков и аналитику производительности. Основные функции Восстановительная Сетка Внедряет систему усреднения и гибкую сетку для управления сделками в неблагоприятных рыночных условиях. Позволяет стратегически
Grid Manual MT5
Alfiya Fazylova
4.9 (20)
Grid Manual — это торговая панель для работы с сеточными стратегиями. Утилита универсальная, имеет гибкие настройки и понятный интерфейс. Работает с сеткой ордеров не только в сторону усреднения убытков, но и в сторону наращивания прибыли. Трейдеру не нужно создавать и сопровождать сетку ордеров, это сделает утилита. Достаточно открыть ордер и Grid manual автоматически создаст ему сетку ордеров и будет сопровождать его до самого закрытия. Полная инструкция и демо-версия здесь . Основные особенно
Lazy Trader — это ваш личный помощник по управлению рисками, который самостоятельно находит лучшие точки входа в рынок, управляет позициями и помогает извлечь максимальную прибыль из каждой торговой идеи! Он контролирует графики от   M1 до W1 , ищет оптимальные точки входа по заданным условиям, управляет позициями без вашего участия: -  Есть идея на дневке?   Не нужно ждать, когда младшие таймфреймы нарисует вход — Lazy Trader сам все проверит и откроет все нужные позиции пока вы занимаетесь жи
Trade Assistant 38 in 1
Makarii Gubaydullin
4.91 (23)
Многофункциональная утилита: калькулятор лота, сеточные ордера, индикатор Price Action, менеджер ордеров, рассчёт R/R, и многое другое Демо-веpсия  |   Инструкция  |   Версия для MT4 Утилита не работает в тестере стратегий: вы можете скачать демо-версию ЗДЕСЬ , чтобы протестировать продукт перед покупкой. Напишите мне  если есть вопросы / идеи по улучшению / в случае найденного бага Упроситите и сделайте вашу торговлю быстрее, при этом расширяя стандартные возможности терминала. 1. Открытие но
Представляем последнюю версию Dynamic Fibonacci Grid Dashboard для MT5. Теперь с множеством новых функций, этот обновлённый дашборд полностью меняет ваш торговый опыт и позволяет увидеть рынок и ценовое движение с совершенно иной перспективы. Откройте новые возможности благодаря одновременному анализу нескольких таймфреймов и множества инструментов. Удобный интерфейс для ручной торговли и управления позициями, а также расширенные возможности применения предопределённых автоматических стратегий.
Другие продукты этого автора
Have you ever take a long time to watch a Symbol when the network link is not good ? Have you ever wait for a long time when you switch chart between different Symbols or different TimeFrames ? If you do long-term backtesting , Have you ever to be downloaded datas for a long time ? Yes, If there is no data in the system, those will happen.  1. What is this: Download all the Symbol data in Market Watch to the system. PS: This is not outputting data to Files. This Link go to Demo version: https:/
This product can be used to synchronize multiple Charts, and each Chart can be set to a different sync mode. With this product you can better view and manipulate charts: different time frames for a single Symbol, the same time frame for multiple Symbols... and more. PS: The link below is the FreeDemo product, you can use it on EURUSD/XUAUSD/USDCNH symbol: https://www.mql5.com/en/market/product/38557 Feature: Chart settings  can be synchronized, including : background, indentation, size, etc. M
Do you think it's a bit cumbersome when you need to switch symbols or timeframes with mouse click? 1. What is this? This is a program that can switch symbols and timeframes with direction keys. Fast switching, very convenient, no mouse click required. For traders, one symbol with multi-timeframe charts are usually added,  you can change symbol on those charts easily. For multi-currency traders, different symbol charts are usually added, you can also change those timeframes easily. I wrote this p
1. What is this         Rising volatility and falling volatility are not the same, whether it is academic research or actual testing has shown this point.         The original ATR indicator is calculated by putting up and down fluctuations together. This indicator is to calculate separately the upward volatility and the downward volatility, which can better help you study the market. 2. Indicator description          There are two modes for the calculation of this indicator, as shown in the fo
This product can be used to synchronize multiple Charts, and each Chart can be set to a different sync mode. With this product you can better view and manipulate charts: different time frames for a single Symbol, the same time frame for multiple Symbols, system indicators for single/multiple Symbols... and more. Feature: Chart settings can be synchronized, including : background, indentation, size, etc. Multiple Chart window start times  or end times can be synchronized. Multiple Chart time fr
I see that many tools in the market deal with Position and Order in the form of operation panels. Which is loaded into a Chart in the form of an EA. However, once the operator panel EA is loaded, no other EAs can be loaded. So, I wrote the one-click operation of Position and Order as a script, so you can load other EAs and easily complete one-click operation of Trade. 1. What is this: This is a one-click script to close position order. Now you can close position tickets at high speed, for examp
I see that many tools in the market deal with Position and Order in the form of operation panels. Which is loaded into a Chart in the form of an EA. However, once the operator panel EA is loaded, no other EAs can be loaded. So, I wrote the one-click operation of Position and Order as a script, so you can load other EAs and easily complete one-click operation of Trade. 1. What is this: This is a one-click script to delete the pending order . Now you can delete pending tickets at high speed, for
Do you think it's a bit cumbersome when you need to switch symbols or timeframes with mouse click? 1. What is this? This is a program that can switch symbols and timeframes with direction keys. Fast switching, very convenient, no mouse click required. For traders, one symbol with multi-timeframe charts are usually added,  you can change symbol on those charts  easily . For multi-currency traders, different symbol charts are usually added, you can also change those timeframes easily. I wrote thi
According to trading experience: Some symbols are easy to reverse on certain days, such as Monday, or afternoon, and so on. So comparing the current price with the corresponding historical moment price is valuable. If the price coordinate system uses a logarithmic price, you will get a lot of valuable information. 1. What is this? This program can convert the symbol price and add it to your Chart. You can compare it with your major chart. The DEMO version Link: https://www.mql5.com/en/market/pr
What is this: Violent trading: means sending a large number of orders to your brokerage server,  it can conduct a stress test of the trading. In this program you can run a variety of trading tests.  Now you can trade at high speed, For example 1000 orders in an instant. The Demo version's link:  https://www.mql5.com/en/market/product/38431/ Why to use: Whether manual trading or EA trading,  the status of the broker server is very important. So it is beneficial to conduct a trading stress test on
1. Why did I develop this series of indicators I found that most traders need to use multiple time frame indicators. They usually switch time frame to see indicators. However, once the timeframe is switched, you cannot see the  corresponding relationship  between  the price in the smaller timeframe  and  the indicator in the larger timeframe . For example: if your price chart is in H1 timeframe, you can see H4, D1 and W1 indicators in H1 timeframe Chart. This is more helpful for you to find th
Фильтр:
Нет отзывов
Ответ на отзыв